5 Steps to a 5: AP Biology 2017 (2016)
STEP 4
Review the Knowledge You Need to Score High
CHAPTER 18
IN THIS CHAPTER
Summary: This chapter covers the main concepts of ecology, including population growth, biotic potential, life history strategies, and predator–prey relationships. This chapter also discusses concepts such as succession, trophic levels, energy and biomass pyramids, biomes, and biogeochemical cycles.

Key Ideas
![]() Three main types of dispersion patterns: clumped, uniform, and random.
Three main types of dispersion patterns: clumped, uniform, and random.
![]() Two main types of population growth: exponential (J-shaped) and logistic (S-shaped.)
Two main types of population growth: exponential (J-shaped) and logistic (S-shaped.)
![]() Two primary life history strategies: K -selected and R -selected populations.
Two primary life history strategies: K -selected and R -selected populations.
![]() Three main symbiotic relationships: commensalism, mutualism, and parasitism.
Three main symbiotic relationships: commensalism, mutualism, and parasitism.
![]() Defense mechanisms: aposematic coloration, Batesian mimicry, cryptic coloration, deceptive markings, and Müllerian mimicry.
Defense mechanisms: aposematic coloration, Batesian mimicry, cryptic coloration, deceptive markings, and Müllerian mimicry.
![]() Biomes that come up on the AP exam: desert, savannah, taiga, temperate deciduous forest, temperate grassland, tropical forest, tundra, and water.
Biomes that come up on the AP exam: desert, savannah, taiga, temperate deciduous forest, temperate grassland, tropical forest, tundra, and water.
![]() Have a general understanding of the biogeochemical cycles (carbon, nitrogen, and water).
Have a general understanding of the biogeochemical cycles (carbon, nitrogen, and water).
Introduction
Ecology is the study of the interaction of organisms and their environments. This chapter covers the main concepts of ecology, including population growth, biotic potential, life history “strategies,” and predator–prey relationships. The chapter will also look at within-community and between-community (intra- and intercommunity) interactions. Finally we will talk about succession, trophic levels, energy pyramids, biomass pyramids, biomes, and biogeochemical cycles.
Population Ecology and Growth
Like many fields of biology, ecology contains hierarchies of classification. A population is a collection of individuals of the same species living in the same geographic area. A collection of populations of species in a geographic area is known as a community. An ecosystem consists of the individuals of the community and the environment in which it exists. Ecosystems can be subdivided into abiotic and biotic components: biotic components are the living organisms of the ecosystem, while abiotic components are the nonliving players in an ecosystem, such as weather and nutrients. Finally, the biosphere is the entire life-containing area of a planet—all communities and ecosystems.
Three more terms for you: (1) the niche of an organism, which consists of all the biotic and abiotic resources used by the organism; (2) population density, which describes how many individuals are in a certain area; and (3) distribution, which describes how populations are dispersed over that area. There are three main types of dispersion patterns that you should know (see also Figure 18.1 ):
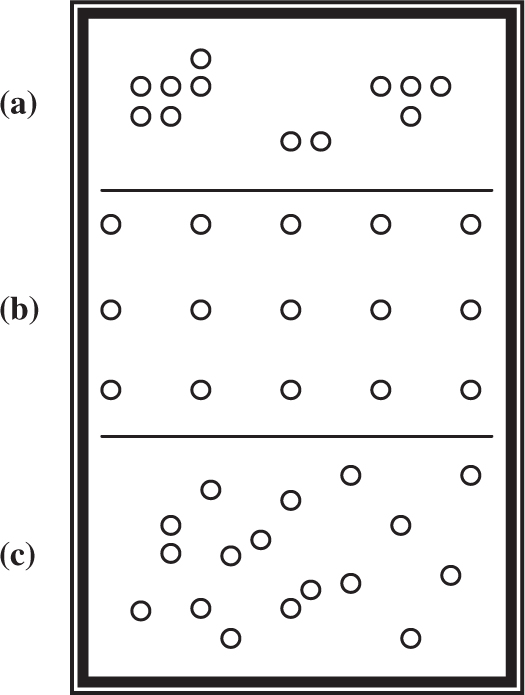
Figure 18.1 Distribution patterns: (a) clumped; (b) uniform; (c) random.
1. Clumped: The individuals live in packs that are spaced out from each other, as in schools of fish or herds of cattle.
2. Uniform: The individuals are evenly spaced out across a geographic area, such as birds on a wire sitting above the highway—notice how evenly spaced out they are.
3. Random: The species are randomly distributed across a geographic area, such as a tree distribution in a forest.
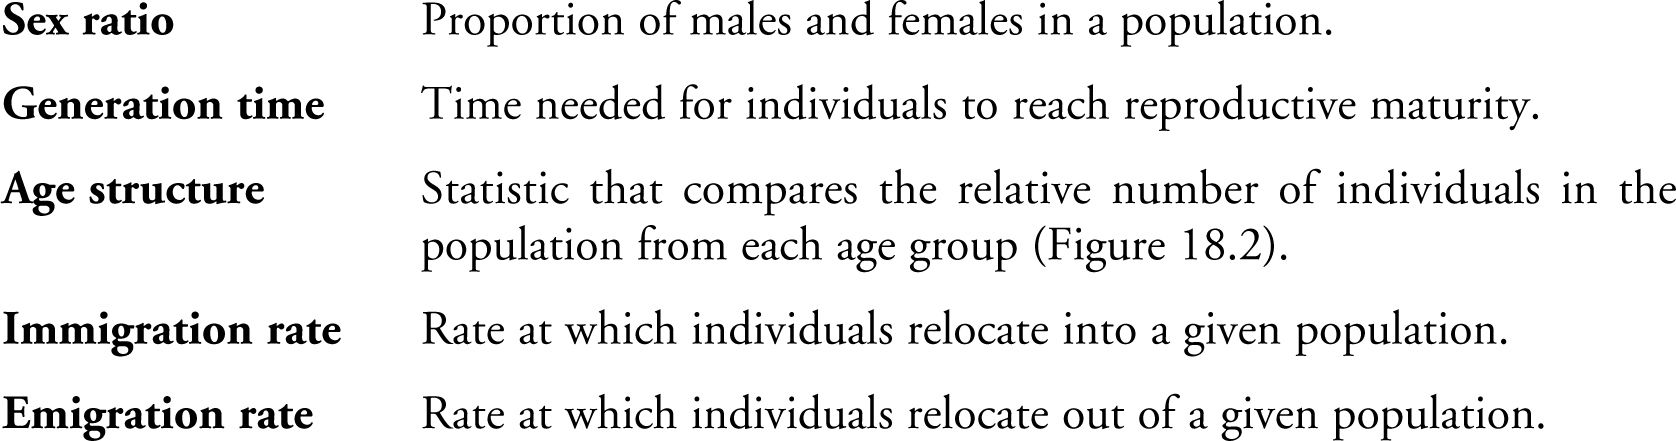
Population ecology is the study of the size, distribution, and density of populations and how these populations change with time. It takes into account all the variables we have mentioned already and many more. The size of the population, symbolized N , indicates how many individuals of that species are in a given area. Demographers study the theory and statistics behind population growth and decline. The following is a list of demographic statistics you should be familiar with for the AP Biology exam:
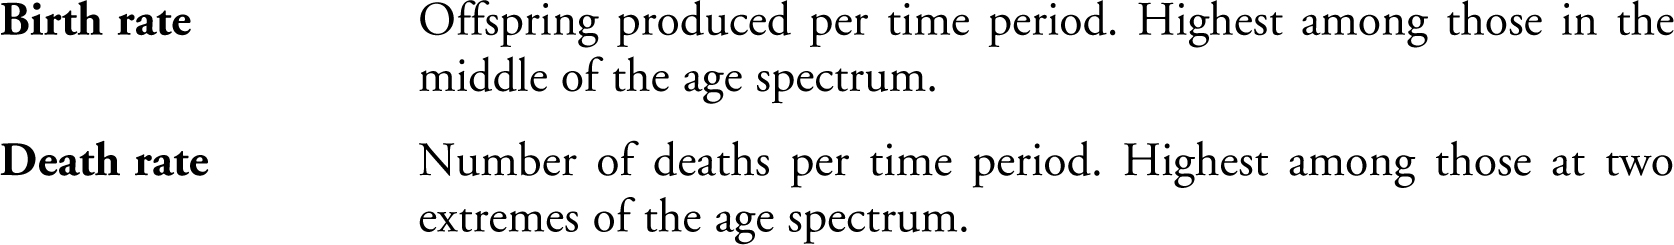
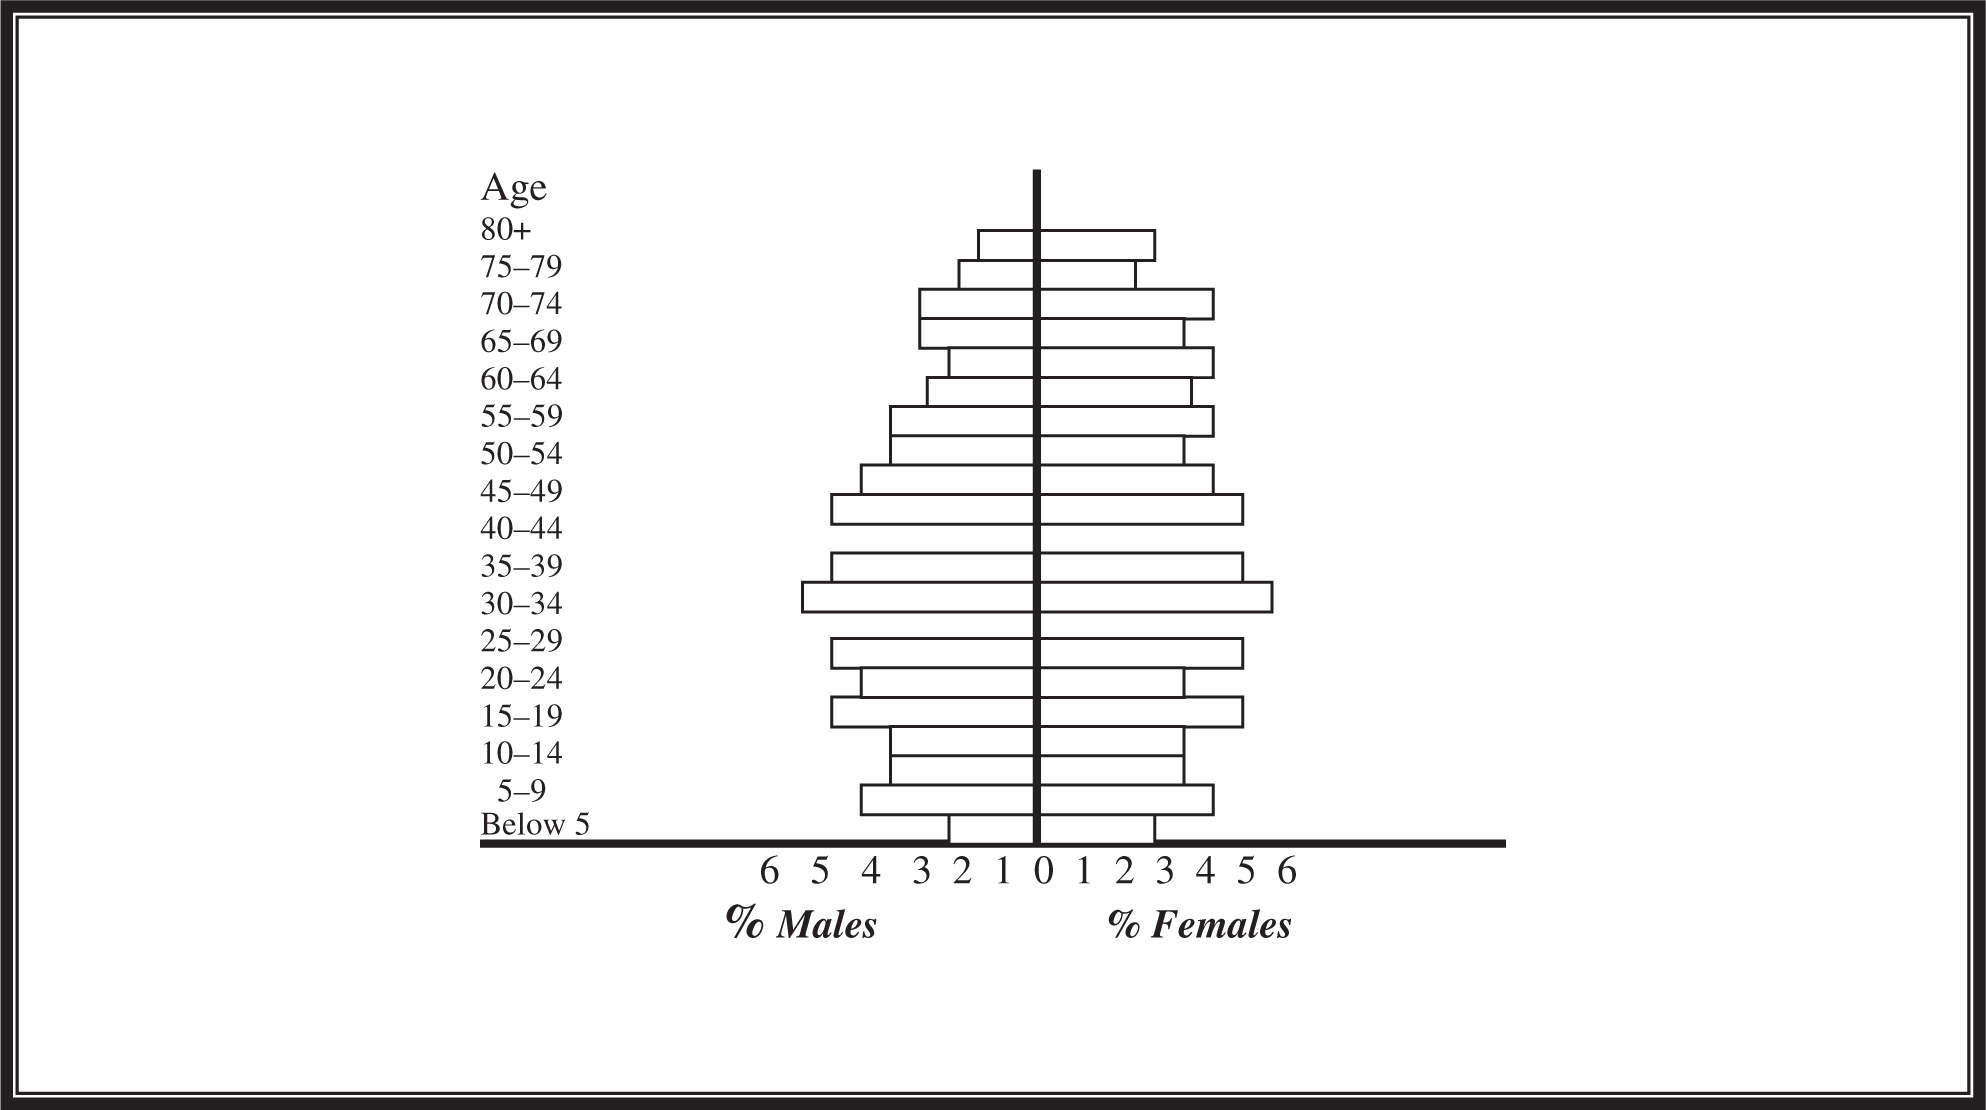
Figure 18.2 A typical age structure chart.
Liz (college freshman): “Know how to read these charts.”
All these statistics together determine the size and growth rate of a given population. Obviously, a higher birth rate and a lower death rate will give a faster rate of population growth. A high female sex ratio could lead to an increase in the number of births in a population (more females to produce offspring). A short generation time allows offspring to be produced at a faster rate. An age structure that consists of more individuals in the middle of their reproductive years will grow at a faster rate than one weighted toward older people.
Population Growth and Size
Biotic potential is the maximum growth rate of a population given unlimited resources, unlimited space, and lack of competition or predators. This rate varies from species to species. The carrying capacity is defined as the maximum number of individuals that a population can sustain in a given environment.
If biotic potential exists, then why isn’t every inch of this planet covered with life? Because of the environment in which we live, numerous limiting factors exist that help control population sizes. A few examples of limiting factors include predators, diseases, food supplies, and waste produced by organisms. There are two broad categories of limiting factors:
Density-dependent factors . These limiting factors rear their ugly heads as the population approaches and/or passes the carrying capacity. Examples of density-dependent limiting factors include food supplies, which run low; waste products, which build up; and population-crowding-related diseases such as the bubonic plague, which just stink.
Density-independent factors . These limiting factors have nothing to do with the population size. Examples of density-independent limiting factors include floods, droughts, earthquakes, and other natural disasters and weather conditions.
There are two main types of population growth:
1. Exponential growth: the population grows at a rate that creates a J-shaped curve. The population grows as if there are no limitations as to how large it can get (biotic potential).
2. Logistic growth: the population grows at a rate that creates an S-shaped curve similar to the initial portion of Figure 18.3 . Limiting factors are the culprits responsible for the S shape of the curve, putting a cap on the size to which the population can grow.
Take a look at Figure 18.3 . As the population size increases exponentially from point A to point C , there seem to be enough natural resources available to allow the growth rate to be quite high. At some point, however, natural resources, such as food, will start to run out. This will lead to competition between the members of the population for the scarce food. Whenever there is competition, there are winners and losers. Those who win survive; those who lose do not. Notice that the population rises above the carrying capacity. How can this be? This is short-lived, as the complications of being overpopulated (lack of food, disease from increased population density, buildup of waste) will lead to a rise in the death rate that pushes the population back down to the carrying capacity or below. When it drops below the carrying capacity, resources replenish, allowing for an increase in the birth rate and decline in the death rate. What you are looking at in Figure 18.3 is the phenomenon known as a population cycle. Often, as seen in the figure, when the population size dips below the carrying capacity, it will later come back to the capacity and even surpass it. However, another possibility shown in this figure is that when a population dips below the carrying capacity due to some major change in the environment, when all is said and done, it may equilibrate at a new, lower carrying capacity.
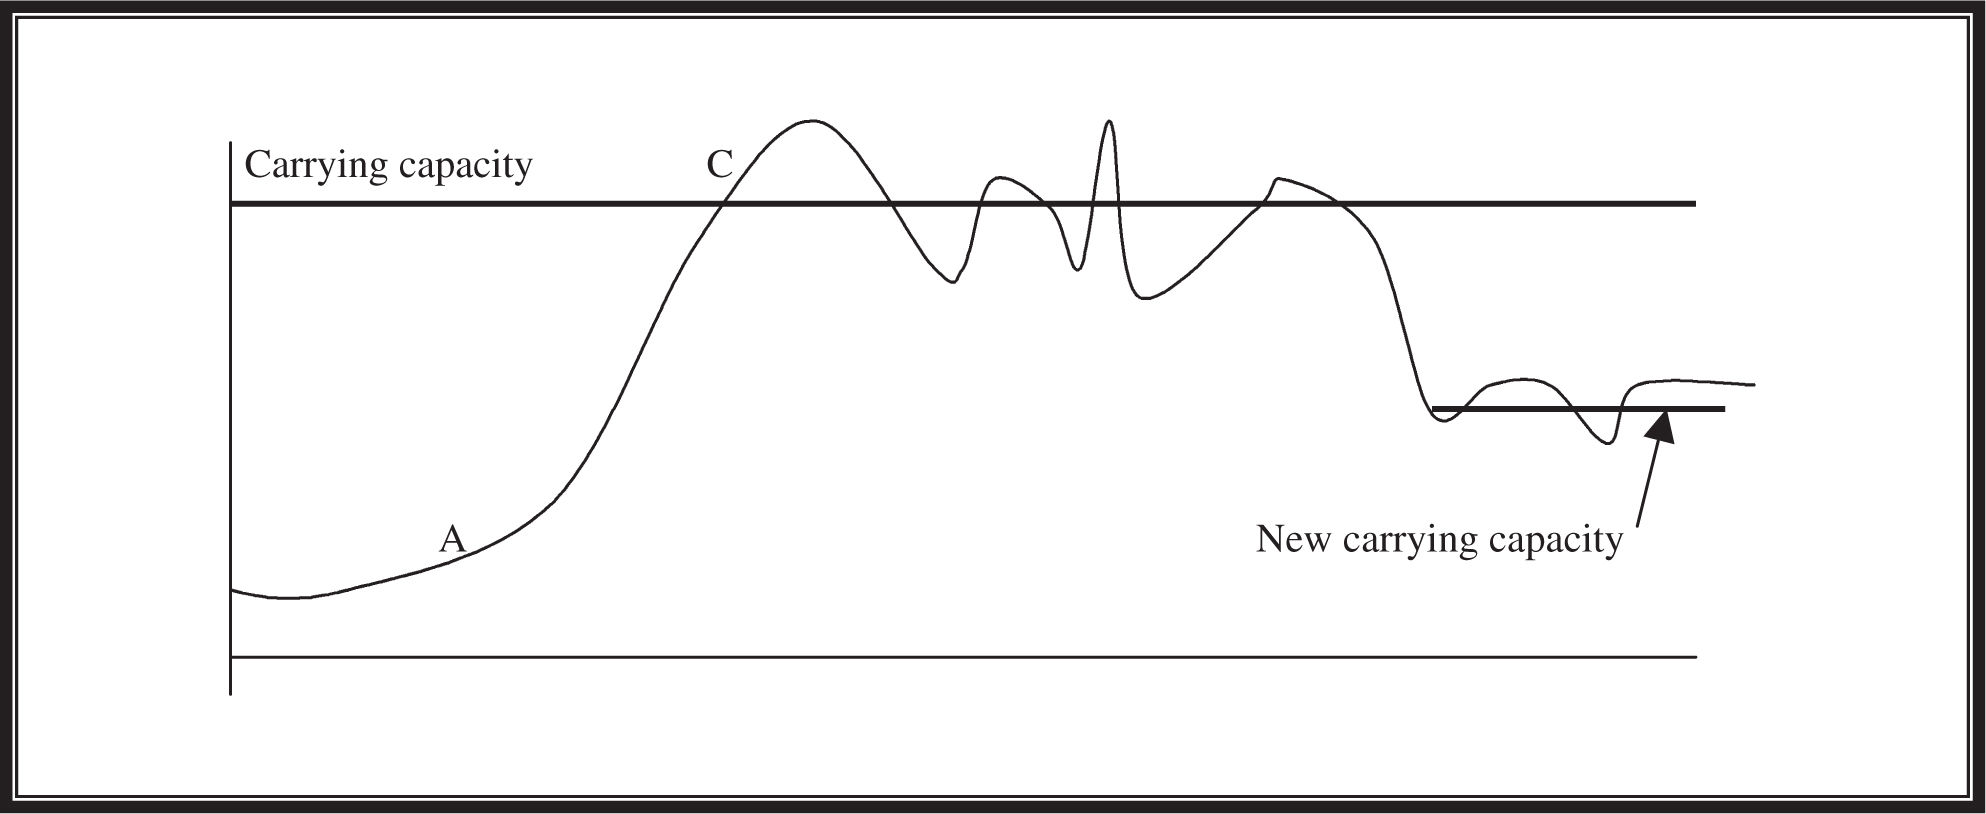
Figure 18.3 Carrying capacity.
Life History Strategies
You should be familiar with two primary life history “strategies,” which represent two extremes of the spectrum:
K-selected populations: populations of a roughly constant size whose members have low reproductive rates. The offspring produced by these K -selected organisms require extensive postnatal care until they have sufficiently matured. Humans are a fine example of a K -selected population.
R-selected populations: populations that experience rapid growth of the J-curve variety. The offspring produced by R -selected organisms are numerous, mature quite rapidly, and require very little postnatal care. These populations are also known as opportunistic populations and tend to show up when space in the region opens up as a result of some environmental change. The opportunistic population grows fast, reproduces quickly, and dies quickly as well. Bacteria are a good example of an R -selected population.
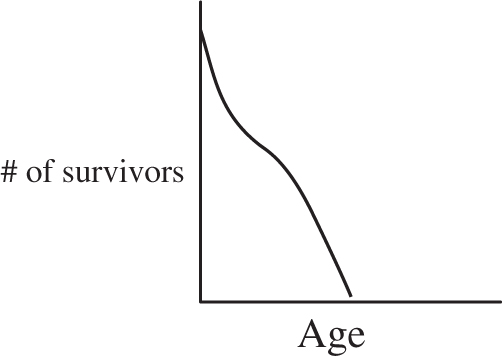
Survivorship Curves
Survivorship curves (Figure 18.4 ) are another tool used to study the population dynamics of species. These curves show the relative survival rates for population members of different ages.
Type I individuals live a long life until an age is reached where the death rate in the population increases rapidly, causing the steep downward end to the type I curve. Examples of type I organisms include humans and other large mammals.
Type II individuals have a death rate that is reasonably constant across the age spectrum. Examples of type II species include lizards, hydra, and other small mammals.
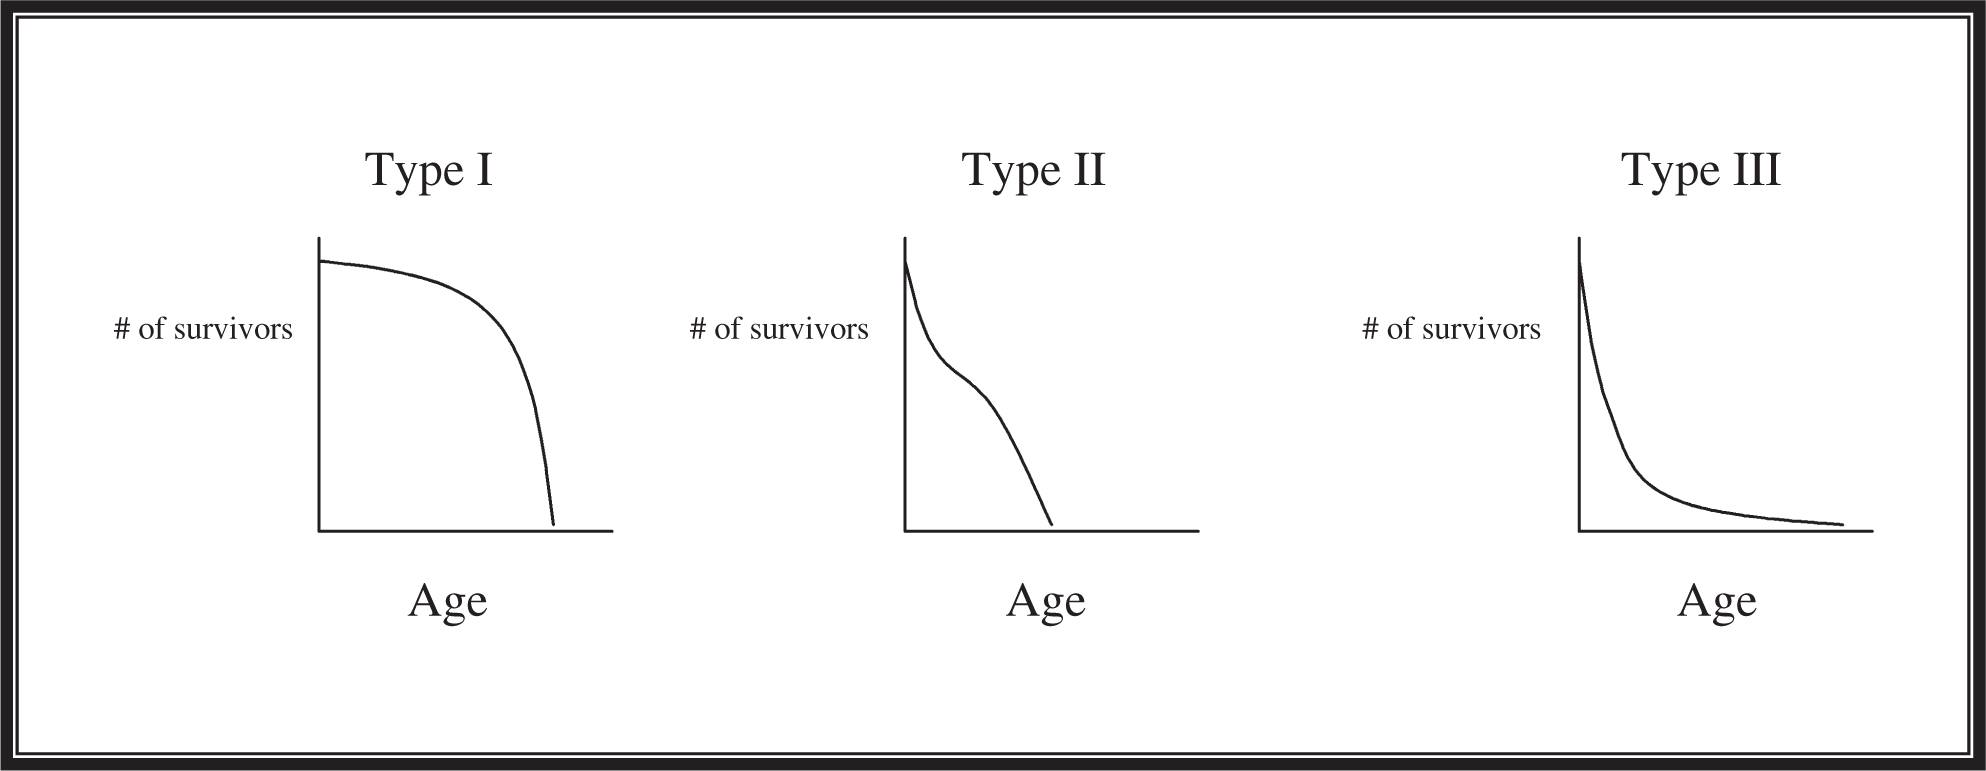
Figure 18.4 Survivorship curves.
Type III individuals have a steep downward curve for those of young age, representing a death rate that flattens out once a certain age is reached. Examples of type III organisms include many fishes, oysters, and other marine organisms.
Community and Succession
Community
Most species exist within a community. Because they share a geographic home, they are bound to interact. These interactions range from positive to neutral to negative.
Del (12th grade): “Know this for the multiple-choice questions. I should have. . . .”
Forms of Species Interaction
1. Symbiosis . A symbiotic relationship is one between two different species that can be classified as one of three main types: commensalism, mutualism, or parasitism.
A. Commensalism . One organism benefits while the other is unaffected. Commensalistic relationships are rare, and examples are hard to find. Cattle egrets feast on insects that are aroused into flight by cattle grazing in the insects’ habitat. The birds benefit because they get food, but the cattle do not appear to benefit at all.
B. Mutualism . Both organisms reap benefits from the interaction. One popular example of a mutualistic relationship is that between acacia trees and ants. The ants are able to feast on the yummy sugar produced by the trees, while the trees are protected by the ants’ attack on any potentially harmful foreign insects. Another example involves a lichen, which is a collection of photosynthetic organisms (fungus and algae) living as one. The fungus component pulls its weight by helping to create an environment suitable for the lichen’s survival, while the algae component supplies the food for the fungus. Without each other’s contribution, they are doomed.
BIG IDEA 2.D.1
Everything from cells to ecosystems is affected by interactions involving the exchange of matter and energy .
C. Parasitism . One organism benefits at the other’s expense. A popular example of a parasitic relationship involves tapeworms, which live in the digestive tract of their hosts. They reap the benefits of the meals that their host consumes by stealing the nutrients and depriving the host of nutrition. Another less well-known example of parasitism involves myself and my younger brother’s Playstation 2 console.
2. Competition . Both species are harmed by this kind of interaction. The two major forms of competition are intraspecific and interspecific competition. Intraspecific competition is within -species competition. This kind of competition occurs because members of the same species rely on the same valuable resources for survival. When resources become scarce, the most fit of the species will get more of the resource and survive. Interspecific competition is competition between different species.
3. Predation . This is one of the “negative” interactions seen in communities (well, for one half of those involved, it is negative.) ![]() One species, the predator, hunts another species, the prey. Not all prey give in to this without a fight, and the hunted may develop mechanisms to defend against predatory attack. The next section describes the various kinds of defense mechanisms developed by prey in an effort to survive.
One species, the predator, hunts another species, the prey. Not all prey give in to this without a fight, and the hunted may develop mechanisms to defend against predatory attack. The next section describes the various kinds of defense mechanisms developed by prey in an effort to survive.
BIG IDEA 4.A.5
Communities are composed of populations that interact in complex ways .
Defense Mechanisms
Aposematic coloration is a very impressive-sounding name for this defense mechanism. Stated simply, it is warning coloration adopted by animals that possess a chemical defense mechanism. Predators have grown cautious of animals with bright color patterns due to past encounters in which prey of a certain coloration have sprayed the predator with a chemical defense. It is kind of like the blinking red light seen in cars with elaborate alarm systems. Burglars notice the red light and may think twice about attempting to steal that car because of the potential for encountering an alarm system.
In Batesian mimicry, an animal that is harmless copies the appearance of an animal that is dangerous to trick predators. An example of this is a beetle whose colors closely resemble those of bees. Predators may fear that the beetle is a bee and avoid confrontation.
In cryptic coloration, those being hunted adopt a coloring scheme that allows them to blend in to the colors of the environment. It is like camouflage worn by army soldiers moving through the jungle. The more you look like the terrain, the harder you are to see.
Some animals have patterns called deceptive markings, which can cause a predator to think twice before attacking. For example, some insects may have colored designs on their wings that resemble large eyes, causing individuals to look more imposing than they truly are.
In Müllerian mimicry, two species that are aposematically colored as an indicator of their chemical defense mechanisms mimic each other’s color scheme in an effort to increase the speed with which their predators learn to avoid them. The more often predators see dangerous prey with this coloration, the faster the negative association is made.
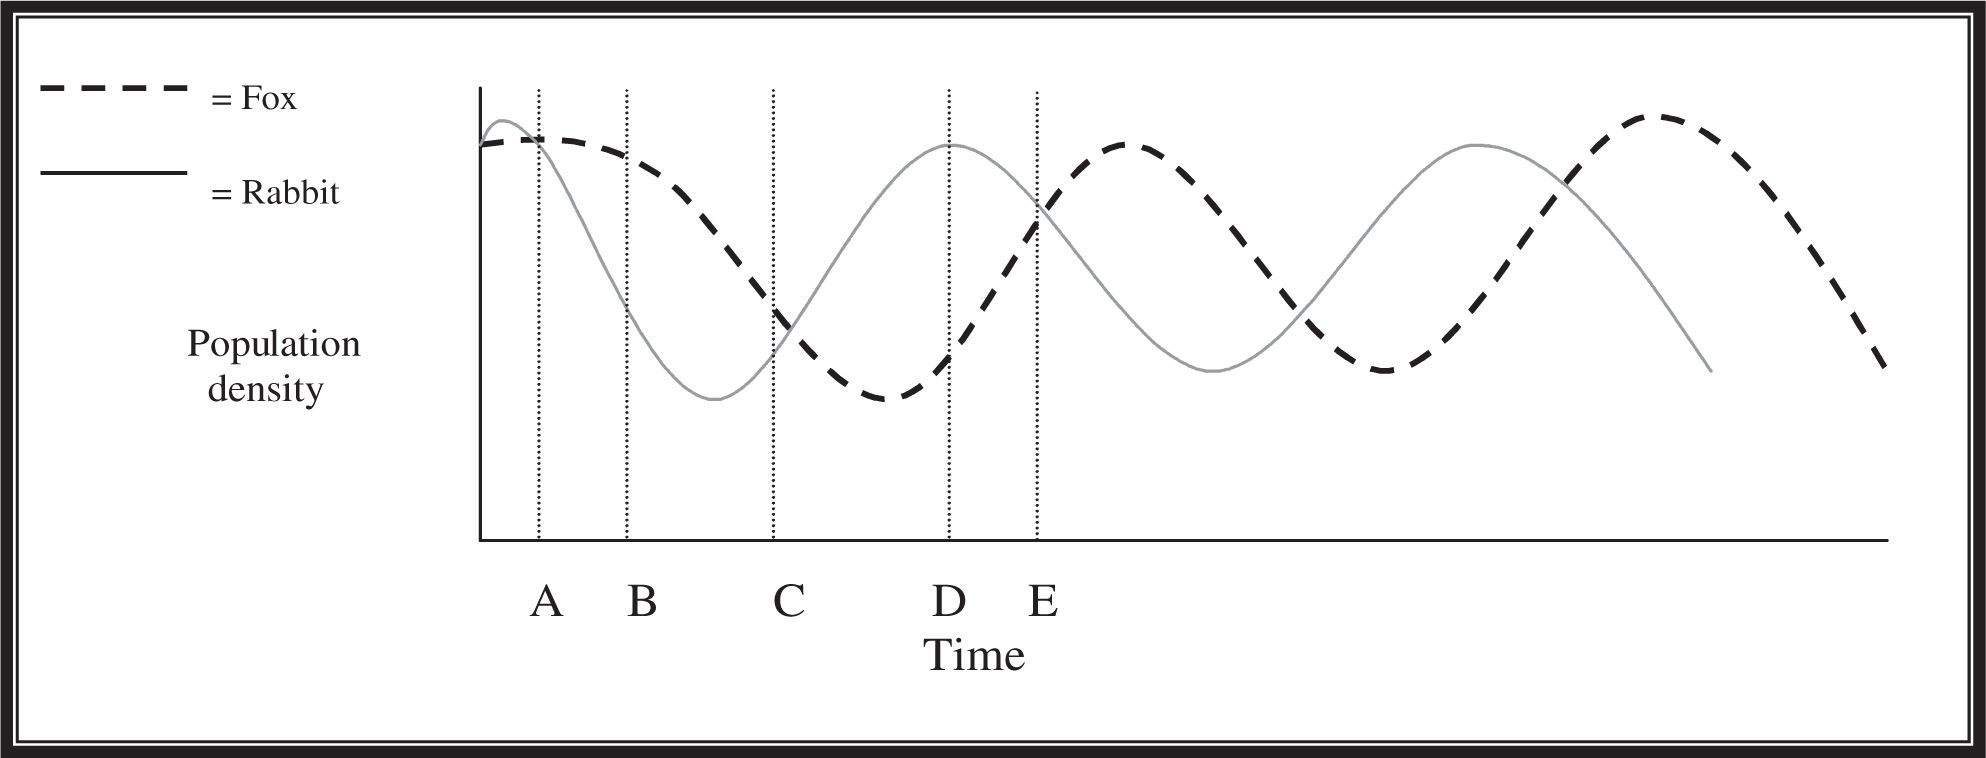
Looking at Figure 18.5 , we can see how the predator–prey dance plays out. When the prey population starts to decrease because of predation, there is a reactionary reduction in the predator population. Why does this happen? Because the predators run low on a valuable resource necessary to their survival—their prey. Notice in the figure that as the predator population declines, an increase in the population of the prey begins to appear because more of those prey animals are able to survive and reproduce. As the prey population density rises, the predators again have enough food available to sustain a higher population, and their population density returns to a higher level again. Unless disturbed by a dramatic environmental change, this cyclical pattern continues.
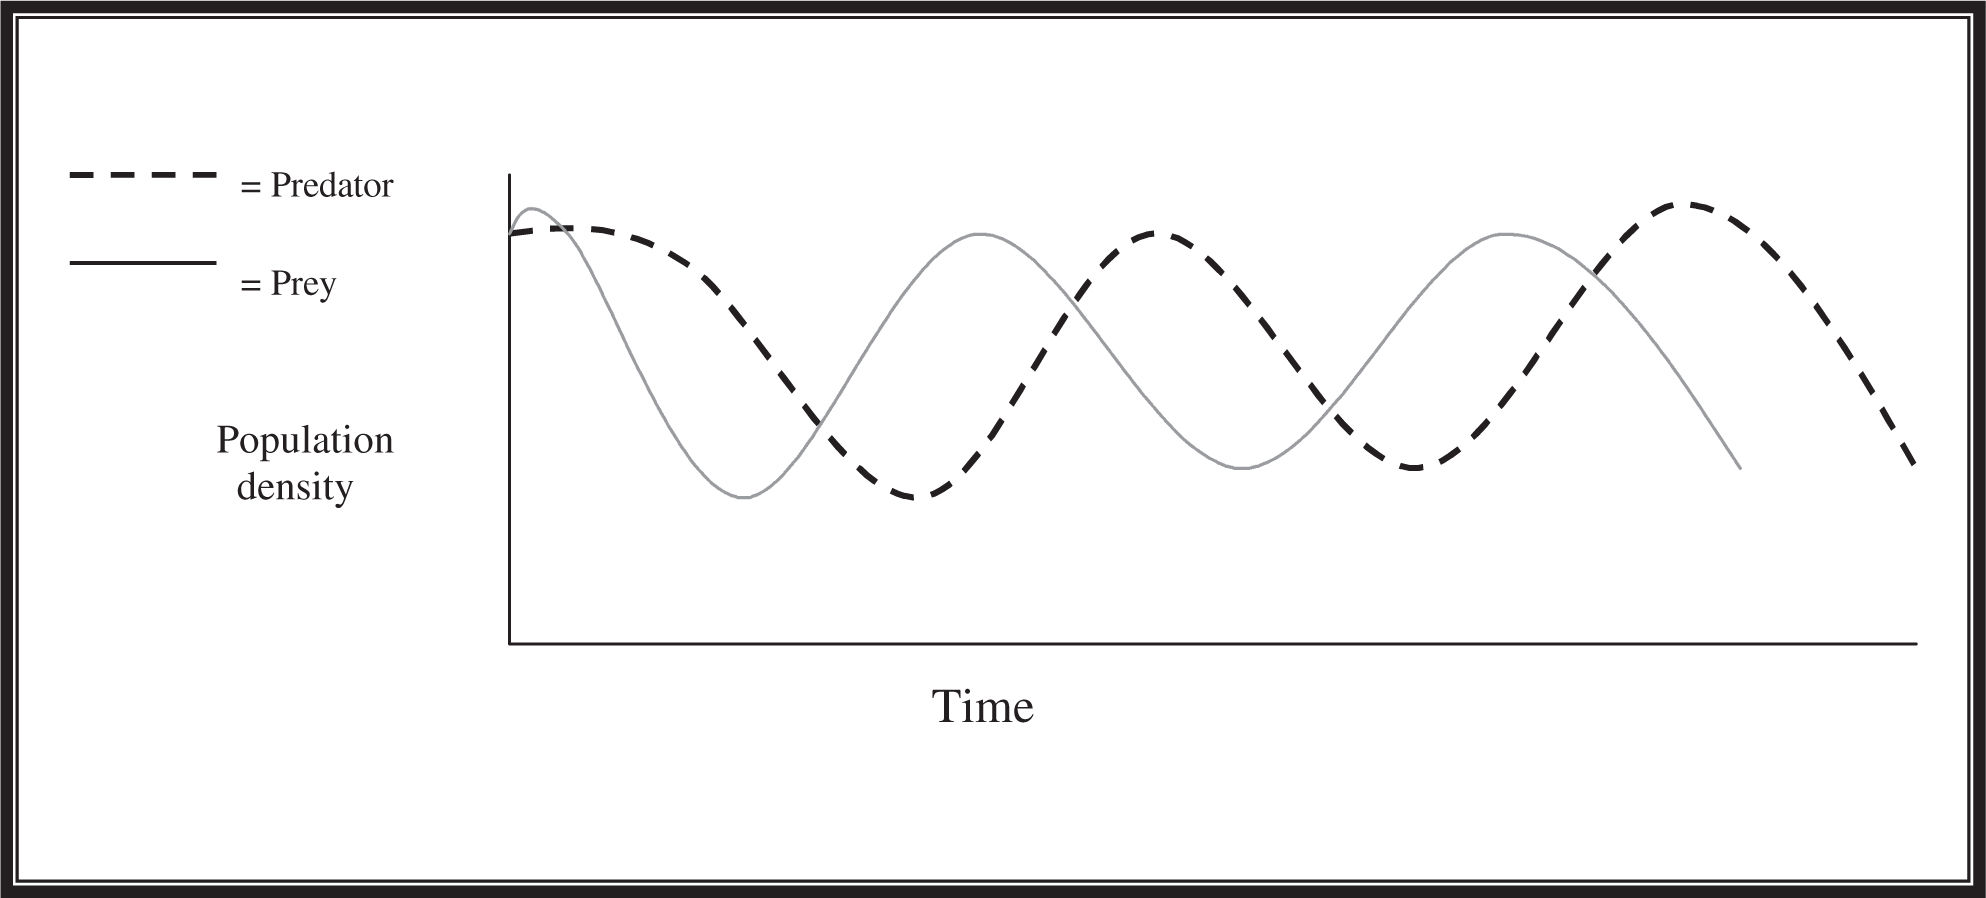
Figure 18.5 Predator–prey population curves.
Coevolution is mutual evolution between two species and is often seen in predator–prey relationships. For example, imagine that the hunted prey adapts a new character trait that allows it to better elude the predator. In order to survive, the predator must evolve so that it can catch its victim and eat.
Succession
When something happens to a community that causes a shift in the resources available to the local organisms, it sets the stage for the process of succession —the shift in the local composition of species in response to changes that occur over time. As time passes, the community goes through various stages until it arrives at a final stable stage called the climax community. Two major forms of succession you should know about are primary and secondary succession.
Primary succession occurs in an area that is devoid of life and contains no soil. A pioneer species (usually a small plant) able to survive in resource-poor conditions takes hold of a barren area such as a new volcanic island. The pioneer species does the grunt work, adding nutrients and other improvements to the once uninhabited volcanic rock until future species take over. As the plant species come and go, adding nutrients to the environment, animal species are drawn in by the presence of new plant life. These animals contribute to the development of the area with the addition of further organic matter (waste). This constant changing of the guard continues until the climax community is reached and a steady-state equilibrium is achieved. Bare-rock succession involves the attachment of lichen to rocks, followed by the step-by-step arrival of replacement species up to the climax community. Pond succession is kicked off when a shallow, water-filled hole is created. As time passes, animals arrive on the scene as the pioneer species deposit debris, encouraging the growth of vegetation on the pond floor. Over time, plants develop whose roots are underwater and whose leaves are above the water. As these plants begin to cover the entire area of the pond, the debris continues to build up, transforming the once empty pond into a marsh. When enough trees fill into the area, the marsh becomes a swamp. If the conditions are appropriate, the swamp can eventually become a forest or grassland, completing the succession process. One trivia fact to take out of primary succession is that usually the pioneer species is an R -selected species, while the later species tend to be K -selected species.
BIG IDEA 4.C.4
The diversity of species within an ecosystem may influence the stability of that ecosystem .
Secondary succession occurs in an area that once had stable life but has since been disturbed by some major force such as a forest fire. This type of succession is different from primary succession because there is already soil present on the terrain when the process begins.
Trophic Levels
As we discussed earlier, an ecosystem consists of the individuals of the community and the environment in which they exist. Organisms are classified as either producers or consumers. The producers of the world are the autotrophs mentioned in Chapter 8 , Photosynthesis. The autotrophs you should recognize can be one of two types: photosynthetic or chemo-synthetic autotrophs. Photoautotrophs (photosynthetic autotrophs) start the earth’s food chain by converting the energy of light into the energy of life. Chemoautotrophs (chemosynthetic autotrophs) release energy through the movement of electrons in oxidation reactions.
BIG IDEA 2.A.1
All living systems require the constant input of energy .
The consumers of the world are the heterotrophs. They are able to obtain their energy only through consumption of other living things. One type of consumer is a herbivore, which feeds on plants for nourishment. Another consumer, the carnivore, obtains energy and nutrients through the consumption of other animals. A third consumer, the detritivore, obtains its energy through the consumption of dead animals and plants. A special subcategory of this type of consumer includes decomposers, which also consume dead animal and plant matter, but then release nutrients back into the environment. The decomposer subcategory includes fungi, bacteria, and earthworms.
Here comes another hierarchy for you to remember. The distribution of energy on the planet can be subdivided into a hierarchy of energy levels called trophic levels. Take a look at the energy pyramid in Figure 18.6 . The primary producers make up the first trophic level. The next trophic level consists of the organisms that consume the primary producers: the herbivores. These organisms are known as primary consumers. The primary consumers are consumed by the secondary consumers, or primary carnivores, that are the next trophic level. These primary carnivores are consumed by the secondary carnivores to create the next trophic level. This is an oversimplified yet important basic explanation of how trophic levels work. Usually there are only four or five trophic levels to a food chain because energy is lost from each level as it progresses higher.
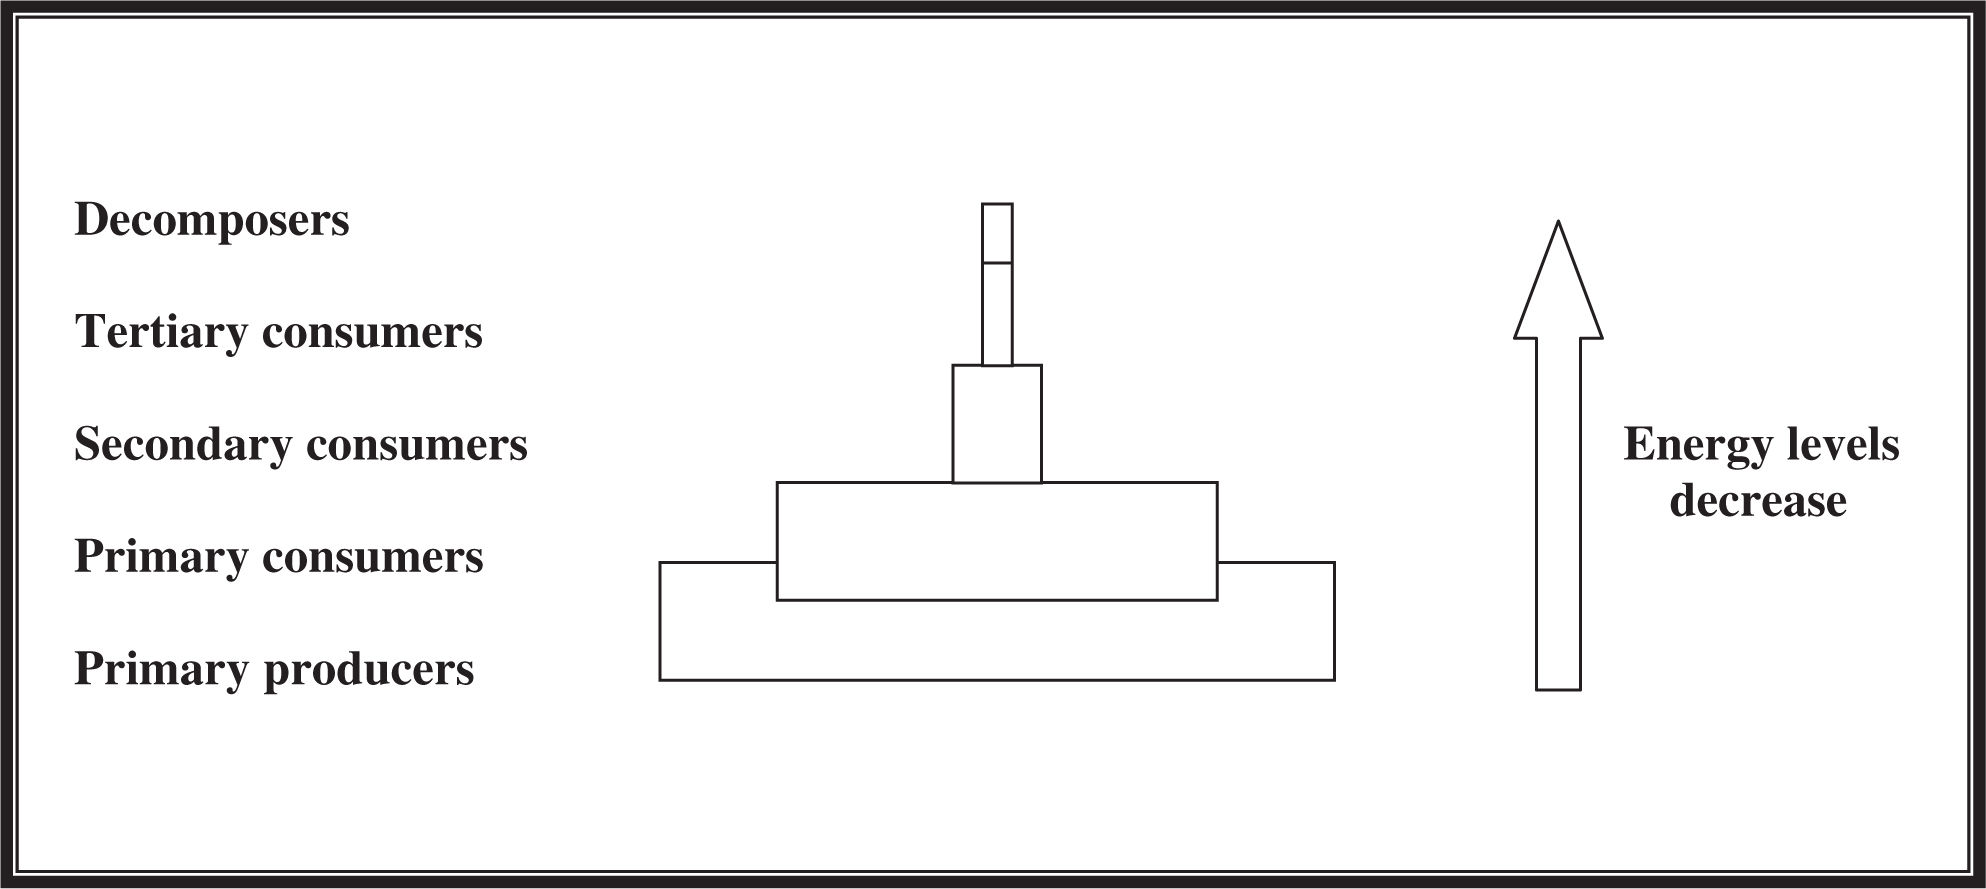
Figure 18.6 Energy pyramid, indicating decrease in energy level.
BIG IDEA 4.B.3
Interactions between populations influence patterns of species distribution .
The energy pyramid is not the only type of ecological pyramid that you might encounter on the AP Biology exam. Be familiar with a type of pyramid known as a biomass pyramid (Figure 18.7 ), which represents the cumulative weight of all of the members at a given trophic level. These pyramids tend to vary from one ecosystem to another. Like energy pyramids, the base of the biomass pyramid represents the primary producers and tends to be the largest.
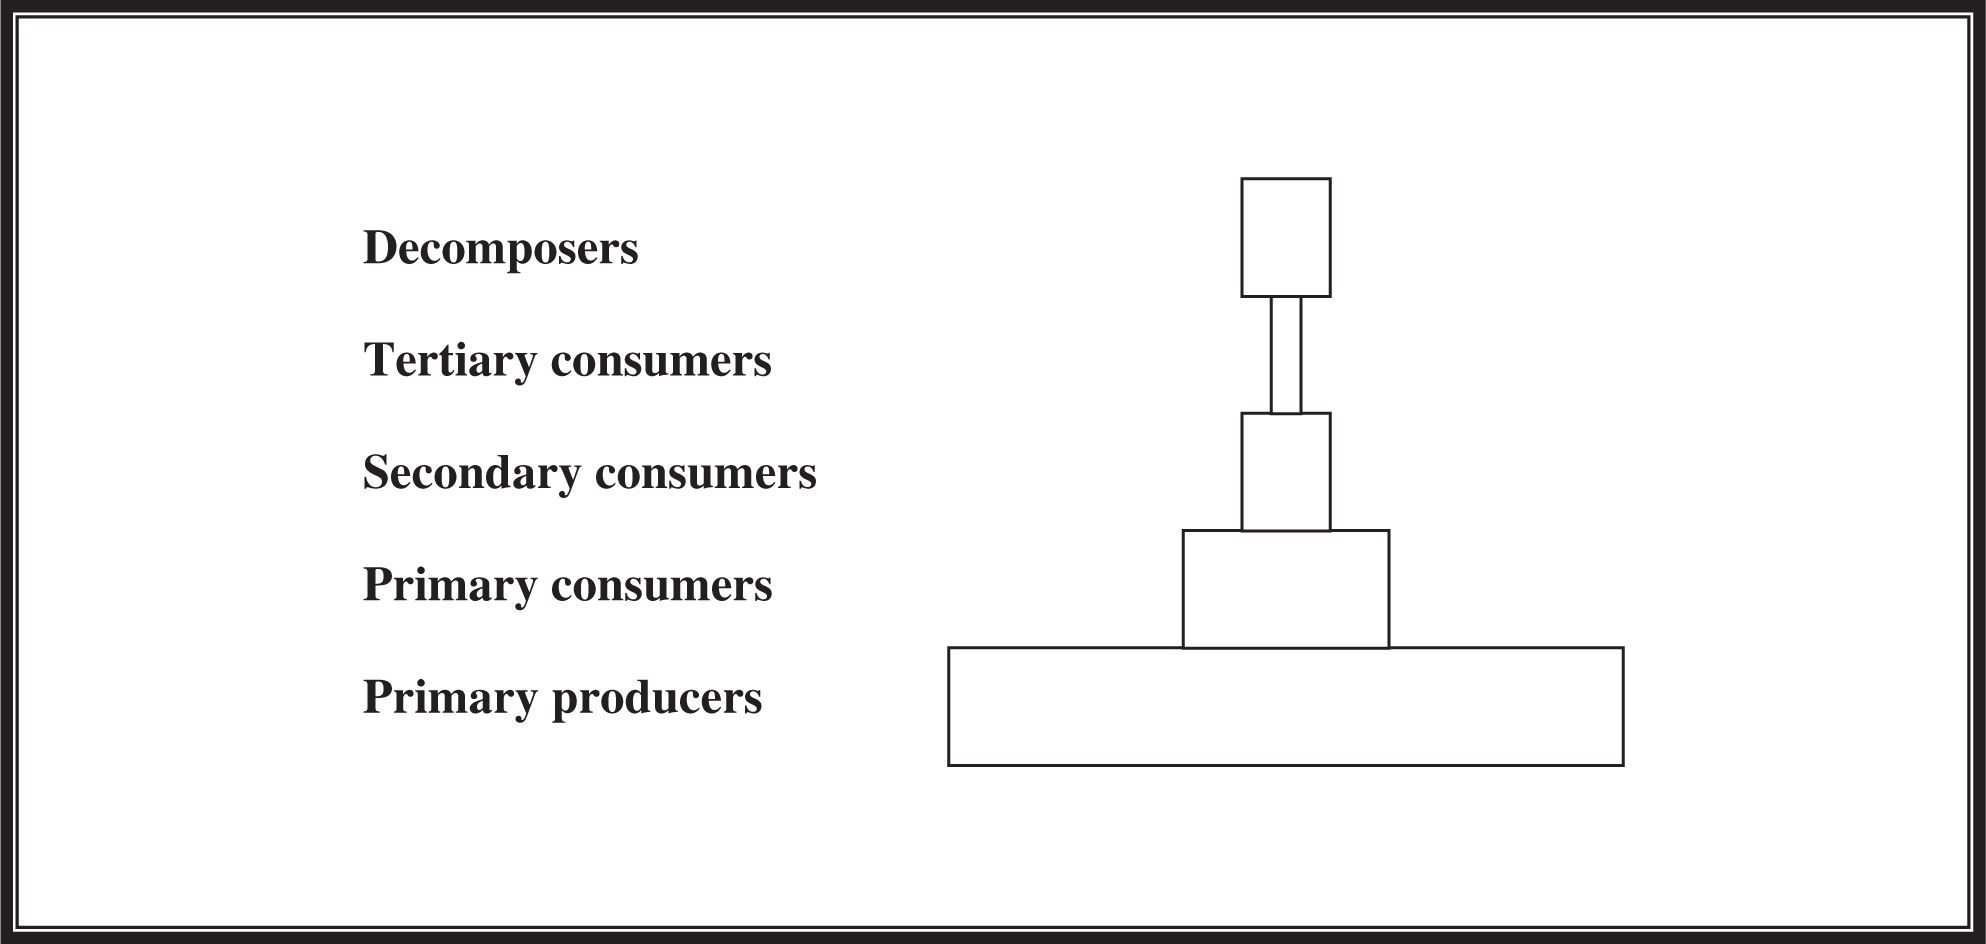
Figure 18.7 Biomass pyramid.
There is also the pyramid of numbers, which is based on the number of individuals at each level of the biomass chain. Each box in this pyramid represents the number of members of that level. The highest consumers in the chain tend to be quite large, resulting in a smaller number of those individuals spread out over an area.
BIG IDEA 4.A.6
Interactions among organisms and with their environment result in movement of matter and energy .
Two more terms to cover before moving on to the biomes are food chains and food webs. A food chain is a hierarchical list of who snacks on who. For example, bugs are eaten by spiders, who are eaten by birds, who are eaten by cats. A food web provides more information than a food chain—it is not so cut and dry. Food webs recognize that, for example, bugs are eaten by more than only spiders. Food webs can be regarded as overlapping food chains that show all the various dietary relationships.
Biomes
The various geographic regions of the earth that serve as hosts for ecosystems are known as biomes. Read through the following list so that you will be able to sprinkle some biome knowledge into an essay on ecological principles.
BIG IDEA 4.B.4
Distribution of local and global ecosystems changes over time .
1. Deserts . The driest land biome of the group, deserts experience a wide range of temperature from day to night and exist on nearly every continent. Deserts that do not receive adequate rainfall will not have any vegetative life. However, plants such as cacti seem to have adjusted to desert life and have done quite nicely in this biome, given enough water. Much of the wildlife found in deserts is nocturnal and conserves energy and water during the heat of the day. This biome shows the greatest daily fluctuation in temperature due to the fact that water moderates temperature.
2. Savanna . Savanna grasslands, which contain a spattering of trees, are found throughout South America, Australia, and Africa. Savanna soil tends to be low in nutrients, while temperatures tend to run high. Many of the grazing species of this planet (herbivores) make savannas their home.
3. Taiga . This biome, characterized by lengthy cold and wet winters, is found in Canada and has gymnosperms as its prominent plant life. Taigas contain coniferous forests (pine and other needle-bearing trees).
4. Temperate deciduous forests . A biome that is found in regions that experience cold winters where plant life is dormant, alternating with warm summers that provide enough moisture to keep large trees alive. Temperate deciduous forests can be seen in the northeastern United States, much of Europe, and eastern Asia.
5. Temperate grasslands . Temperate grasslands are found in regions with cold winters. The soil of this biome is considered to be among the most fertile of all. This biome receives less water than tropical savannas.
6. Tropical forests . Found all over the planet in South America, Africa, Australia, and Asia, tropical forests come in many shapes and sizes. Near the equator, they can be rainforests, whereas in lowland areas that have dry seasons, they tend to be dry forests. Rainforests consist primarily of tall trees that form a thick cover, which blocks the light from reaching the floor of the forest (where there is little growth). Tropical rainforests are known for their rapid recycling of nutrients and contain the greatest diversity of species.
7. Tundras . The tundra biome experiences extremely cold winters during which the ground freezes completely. The upper layer of the ground is able to thaw during the summer months, but the land directly underneath, called the permafrost, remains frozen throughout the year. This keeps plants from forming deep roots in this soil and dictates what type of plant life can survive. The plant life that tends to predominate is short shrubs or grasses that are able to withstand difficult conditions.
8. Water biomes . Both freshwater and marine water biomes occupy the majority of the surface of the earth.
The general distribution of biomes on the earth’s surface is shown in Figure 18.8 .
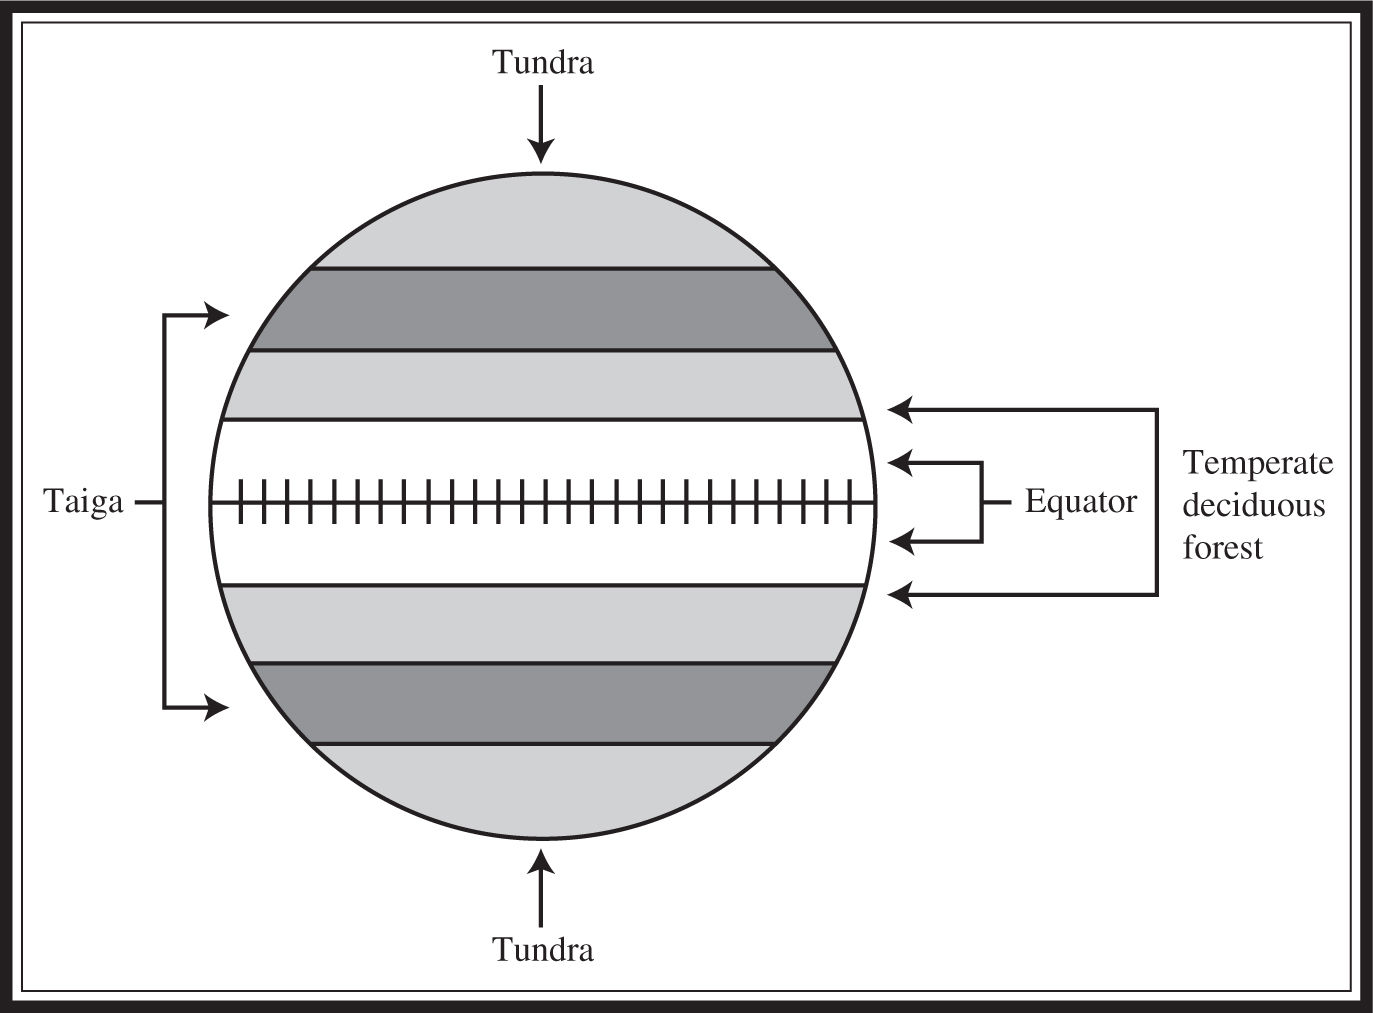
Figure 18.8 General distribution of biomes on the earth’s surface. (The other land biomes such as grassland and desert are interspersed in temperate and tropical regions with water as the limiting factor.)
Biogeochemical Cycles
One last topic to briefly cover before we wave goodbye to ecology is that of biogeochemical cycles. These cycles represent the movement of elements, such as nitrogen and carbon, from organisms to the environment and back in a continuous cycle. Do not attempt to become a master of these cycles, but you should understand the basics.
Carbon cycle . Carbon is the building block of organic life. The carbon cycle begins when carbon is released to the atmosphere from volcanoes, aerobic respiration (CO2 ), and the burning of fossil fuels (coal). Most of the carbon in the atmosphere is present in the form of CO2 . Plants contribute to the carbon cycle by taking in carbon and using it to perform photosynthetic reactions, and then incorporating it into their sugars. The carbon is ingested by animals, who send the carbon back to the atmosphere when they die.
Nitrogen cycle . Nitrogen is an element vital to plant growth. In the nitrogen cycle (Figure 18.9 ), plants have nitrogen to consume thanks to the existence of organisms that perform the thankless task of nitrogen fixation —the conversion of N2 to NH3 (ammonia). The only source of nitrogen for animals is the plants they consume. When these organisms die, their remains become a source of nitrogen for the remaining members of the environment. Bacteria and fungi (decomposers) chomp at these organisms and break down any nitrogen remains. The NH3 in the environment is converted by bacteria into NO3 (nitrate), and this NO3 is taken up by plants and then eventually by animals to complete the nitrogen cycle. Denitrification is the process by which bacteria themselves use nitrates and release N2 as a product.
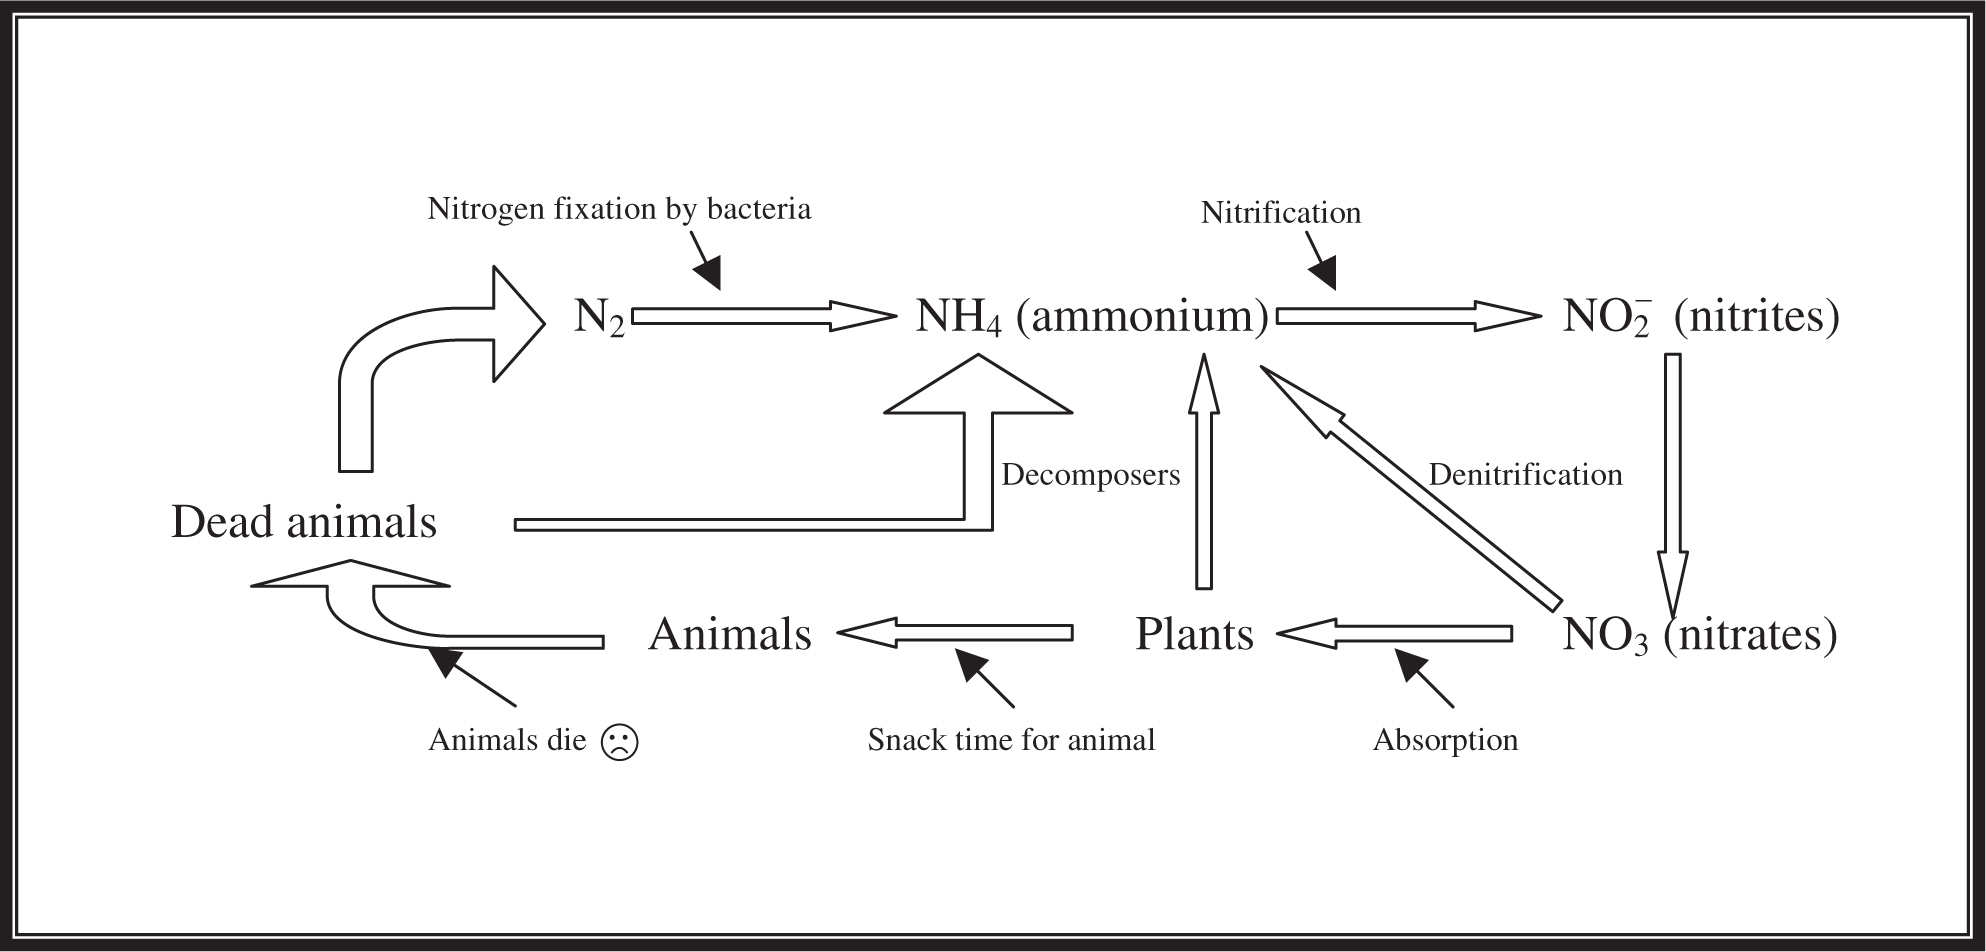
Figure 18.9 The nitrogen cycle.
Water cycle . The earth is covered in water. A considerable amount of this water evaporates each day and returns to the clouds. Eventually, this water is returned to the earth in the form of precipitation. This process is termed the water cycle.
![]() Review Questions
Review Questions
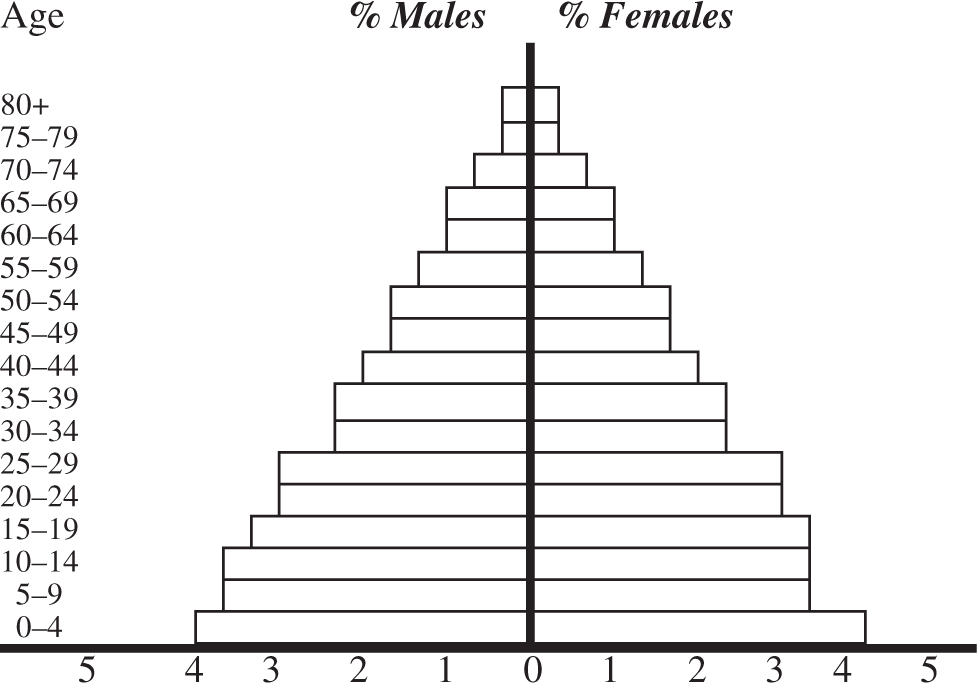
1 . How would you describe the population depicted in the age structure graph shown here?
A. Growing rapidly
B. Growing slowly
C. Not growing at all
D. Experiencing slow negative growth
E. Experiencing rapid negative growth
2 . Carbon is most commonly present in the atmosphere in what form?
A. CCl4
B. CO
C. CO2
D. CH2
E. C6 H12 O6
3 . Which of the following is a density-dependent limiting factor?
A. Flood
B. Drought
C. Earthquake
D. Famine
E. Tornado
4 . The process by which bacteria themselves use the nitrate of the environment, releasing N2 as a product, is called
A. nitrogen fixation.
B. abiotic fixation.
C. denitrification.
D. chemosynthetic autotrophism.
E. nitrogen turnover.
For question 5, please use the following curve:
5 . At what point on the graph does the decline in rabbit population act as a limiting factor to the survival of the foxes, leading to a decline in their population size?
A. A
B. B
C. C
D. D
E. E
6 . A collection of all the individuals of an area combined with the environment in which they exist is called a/an
A. population.
B. community.
C. ecosystem.
D. biosphere.
E. niche.
For questions 7–10, please use the following answer choices:
A. Aposometric coloration
B. Batesian mimicry
C. Müllerian mimicry
D. Cryptic coloration
E. Deceptive markings
7 . A beetle that has the coloration of a yellow jacket is displaying which defense mechanism?
8 . A moth whose body color matches that of the trees in which it lives is displaying which defense mechanism?
9 . Two different lizard species, each possessing a particular chemical defense mechanism and sharing a similar body coloration, are displaying which defense mechanism?
10 . A lizard with a chemical defense mechanism has a bright-colored body as a warning to predators that it is one tough customer is displaying which defense mechanism?
11 . Which of the following is not a characteristic of a K -selected population?
A. Populations tend to be of a relatively constant size.
B. Offspring produced tend to require extensive postnatal care.
C. Primates are classified as K -selected organisms.
D. Offspring are produced in large quantities.
E. Offspring produced tend to be relatively large in size compared to R -selected offspring.
12 . Which of the following would have the survivorship curve shown in the following diagram?
A. Humans
B. Lizards
C. Oysters
D. Fish
E. Whales
For questions 13–16, please use the following answer choices:
A. Desert
B. Taiga
C. Tundra
D. Tropical rain forest
E. Deciduous forest
13 . This biome is known for having the most diverse variety of species.
14 . This biome is the driest of the land biomes.
15 . The predominate plant life of this biome is short shrubs or grasses.
16 . This biome is known for its cold, lengthy, and snowy winters and the presence of coniferous forests.
![]() Answers and Explanations
Answers and Explanations
1 . A —The population shown in this age structure chart is one that is growing rapidly because of the gradual increase in percentage of the population as the age approaches 0. This shows a population that has a high birth rate and a reasonable life expectancy.
2 . C —CO2 is the dominant form of carbon present in the atmosphere.
3 . D —Density-dependent limiting factors show up as the population approaches and/or passes the carrying capacity. Examples of density-dependent limiting factors include availability of food resources, waste buildup, and density-induced diseases. The other four choices are examples of density-independent factors, which affect population size regardless of how large or small it may be.
4 . C —Denitrification is defined as the process by which bacteria themselves use nitrates and release nitrogen gas as a product. Bacteria also perform the necessary task of nitrogen fixation, which takes atmospheric nitrogen and converts it to NH3 . They later take this NH3 and convert it to nitrate, which plants require for photosynthetic success. (Abiotic fixation and nitrogen turnover are terms that we made up because they sounded cool.) Chemiosynthetic autotrophs are the producers of the planet that produce energy through the movement of electrons in oxidation reactions.
5 . B —At this point, the population of rabbits has declined to the point where the foxes are starting to feel the reduction in their food supply. The fox survival curve soon begins its decline, which leads to the revival of the rabbits.
6 . C —An ecosystem consists of all the individuals in the community and the environment in which they exist. A population is a collection of individuals of the same species living in the same area. A community is a collection of all the different populations of the various species in a geographic area. A biosphere is the collection of all the life-containing areas of the planet. A niche is a representation of all the biotic and abiotic resources a given organism requires.
7 . B —An animal that is harmless copies the appearance of an animal that is dangerous as a defense mechanism to make predators think twice about attacking.
8 . D —Cryptic coloration is the animal kingdom’s version of army clothes. Their coloration matches that of their environment so they can blend in and hide from their predators.
9 . C —Two species that are aposematically colored as an indicator of their chemical defense mechanism mimic each other’s color scheme in an effort to increase the speed with which their predators learn to avoid them. This, of course, requires a predator that can learn based on experience.
10 . A —This defense mechanism is warning coloration adopted by animals that possess a chemical defense mechanism. Ideally, predators will learn to avoid the species, helping the prey survive longer.
11 . D —K -selected populations tend to be populations of a roughly constant size, with low reproductive rates and whose offspring require extensive postnatal care until they have sufficiently matured. R -selected populations tend to produce many offspring per birth.
12 . B —Lizards follow a type II survivorship curve as illustrated in the diagram in review question 12. Humans (answer A) and whales (answer E) follow a type I curve, while oysters and fish (answers C and D) follow a type III survivorship curve.
13 . D
14 . A
15 . C
16 . B
![]() Rapid Review
Rapid Review
The following terms are important in this chapter:
Population: collection of individuals of the same species living in the same geographic area.
Community: collection of populations of species in a geographic area.
Ecosystem: community + environment.
Biosphere: communities + ecosystems of planet.
Biotic components: living organisms of ecosystem.
Abiotic components: nonliving players in ecosystem.
Dispersion patterns: clumped dispersion (animals live in packs spaced from each other—cattle), uniform distribution (species are evenly spaced out across an area, e.g., birds on a wire), random distribution (species are randomly distributed across an area, e.g., trees in a forest).
Biotic potential: maximum growth rate for a population.
Carrying capacity: maximum number of individuals that a population can sustain in a given environment.
Limiting factors: factors that keep population size in check: density-dependent (food, waste, disease), density-independent (weather, natural disasters).
Population growth: exponential growth (J-shaped curve, unlimited growth), logistic growth (S-shaped curve, limited growth).
Life history strategies: K - selected populations (constant size, low reproductive rate, extensive postnatal care—humans); R - selected populations (rapid growth, J-curve style, little postnatal care, reproduce quickly, die quickly—bacteria).
Survivorship curves: show survival rates for different-aged members of a population:
• Type I: live long life, until age is reached where death rate increases rapidly—humans, large mammals.
• Type II: constant death rate across the age spectrum—lizards, hydra, small mammals.
• Type III: steep downward death rate for young individuals that flattens out at certain age—fish, oysters.
Forms of Species Interaction
• Parasitism: one organism benefits at another’s expense (tapeworms and humans).
• Commensalism: one organism benefits while the other is unaffected (cattle egrets and cattle).
• Mutualism: both organisms reap benefits from the interaction (acacia trees and ants, lichen).
• Competition: both species are harmed by the interaction (intraspecific vs. interspecific ).
• Predation: one species, the predator, hunts the other, the prey.
Defense Mechanisms
• Cryptic coloration: coloring scheme that allows organism to blend into colors of environment.
• Deceptive markings: patterns that cause an animal to appear larger or more dangerous than it really is.
• Aposematic coloration: warning coloration adopted by animals that possess a chemical defense mechanism.
• Batesian mimicry: animal that is harmless copies the appearance of an animal that is dangerous.
• Müllerian mimicry: two aposemetrically colored species have a similar coloration pattern.
Primary succession: occurs in area devoid of life that contains no soil; pioneer species come in, add nutrients, and are replaced by future species, which attract animals to the area, thus adding more nutrients; constant changing of guards until the climax community is reached and a steady-state equilibrium is achieved.
Secondary succession: occurs in area that once had stable life but was disturbed by major force (fire).
Biomes: The Special Facts
We recommend that you read the biome material in the chapter for more detail.
• Desert: driest land biome.
• Taiga: lengthy cold, wet winters; lots of conifers.
• Temperate grasslands: most fertile soil of all.
• Tundra: permafrost, cold winters, short shrubs.
• Savanna: grasslands, home to herbivores.
• Deciduous forest: cold winters/warm summers.
• Tropical forest: greatest diversity of species.
• Water biomes: freshwater and marine biomes of earth.
Trophic levels: hierarchy of energy levels on a planet; energy level decreases from bottom to top (Figure 18.7 ); primary producers (bottom) → primary consumers (herbivores) → secondary consumers → tertiary consumers → decomposers.
CHAPTER 18
Ecology in Further Detail
1 . Animals such as penguins and fish both have finlike structures to help them navigate through their aquatic environments. However, because one is a bird and one is a fish, it is clear that the fin evolved in the different species because it was the best functional structure for the environment they inhabit instead of a feature from a common ancestor. This represents an example of
(A) homologous structures.
(B) analogous structures.
(C) Mullerian mimicry.
(D) Batesian mimicry.
2 . Each of the following represents an example of a density-dependent factor EXCEPT
(A) food supplies.
(B) waste buildup.
(C) natural disasters.
(D) bubonic plague.
3 . A mature, mixed-species forest undergoes a clear cutting that considerably reduces the population of trees. The original forest was dominated by a mixture of angiosperm and coniferous tree species, plus various plants that are tolerant of the stressful, shaded conditions beneath a closed forest canopy. Some of the plants from the original community survive the disturbance of clear-cutting, and they immediately begin to regenerate. Other species regenerate from a long-lived seed bank buried in the forest floor and stimulated to germinate by the environmental conditions occurring after disturbance of the forest. Some of the original species do not survive the clear-cutting in large numbers, and they must reinvade the developing habitat. Another group of species is not even present in the community prior to its disturbance, but these species quickly invade the site to take advantage of the temporary conditions of resource availability and little competition immediately after disturbance. This is an example of
(A) primary succession.
(B) pond succession.
(C) secondary succession.
(D) bare rock succession.
4 . Which biome, characterized by lengthy cold and wet winters, is found in Canada and has gymnosperms as its prominent plant life?
(A) Taiga
(B) Tundra
(C) Temperate deciduous forests
(D) Savanna
![]() Answers and Explanations
Answers and Explanations
1 . B —This is a classic example of analogous structures.
2 . C —Density-dependent factors rear their ugly heads as the population approaches and/or passes the carrying capacity. These factors are related to the population size. Natural disasters occur regardless of how many organisms are in a particular area.
3 . C —Secondary succession occurs in an area that once had stable life but has since been disturbed by some major force such as a forest fire. This type of succession is different from primary succession, because there is already soil present on the terrain when the process begins.