THE LIVING WORLD
Unit Four. The Evolution and Diversity of Life
14. Evolution and Natural Selection
14.8. Genetic Change in Populations: The Hardy-Weinberg Rule
Population genetics is the study of the properties of genes in populations. Genetic variation within natural populations could not be explained by Darwin and his contemporaries. The way in which meiosis produces genetic segregation among the progeny of a hybrid had not yet been discovered. And, although Mendel performed his experiments during this same time period, his work was largely unknown. Selection, scientists then thought, should always favor an optimal form, and so tend to eliminate variation.
Hardy-Weinberg Equilibrium
Indeed, variation within populations puzzled many scientists; alleles (alternative forms of a gene) that were dominant were believed to drive recessive alleles out of populations, with selection favoring an optimal form. The solution to the puzzle of why genetic variation persists was developed in 1908 by G. H. Hardy and W. Weinberg. Hardy and Weinberg studied allele frequencies (the proportion of alleles of a particular type in a population) in a population’s gene pool, which is the sum of all of the genes in a population, including all alleles in all individuals. Hardy and Weinberg pointed out that in a large population in which there is random mating, and in the absence of forces that change allele frequencies, the original genotype proportions remain constant from generation to generation. Dominant alleles do not, in fact, replace recessive ones. Because their proportions do not change, the genotypes are said to be in Hardy-Weinberg equilibrium.
The Hardy-Weinberg rule is viewed as a baseline to which the frequencies of alleles in a population can be compared. If the allele frequencies are not changing (they are in Hardy-Weinberg equilibrium), the population is not evolving. If, however, allele frequencies are sampled at one point in time and they differ greatly from what would be expected under Hardy-Weinberg equilibrium, then the population is undergoing evolutionary change.
Hardy and Weinberg came to their conclusion by analyzing the frequencies of alleles in successive generations. The frequency of something is defined as the proportion of individuals with a certain characteristic, compared to the entire population. Thus, in the population of 1,000 cats shown in figure 14.21, there are 840 black cats and 160 white cats. To determine the frequency of black cats, divide 840 by 1,000 (840/1,000), which is 0.84. The frequency of white cats is 160/1,000 = 0.16.
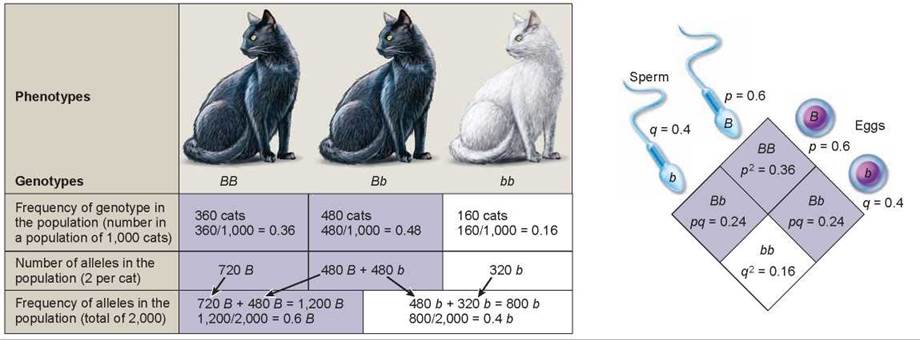
Figure 14.21. Calculating allele frequencies at Hardy-Weinberg equilibrium.
The example here is a population of 1,000 cats, in which 160 are white and 840 are black. White cats are bb, and black cats are BB or Bb.
Knowing the frequency of the phenotype, one can calculate the frequency of the genotypes and alleles in the population. By convention, the frequency of the more common of two alleles (in this case B for the black allele) is designated by the letterp and that of the less common allele (b for the white allele) by the letter q. Because there are only two alleles, the sum ofp and q must always equal 1 (p + q = 1).
In algebraic terms, the Hardy-Weinberg equilibrium is written as an equation. For a gene with two alternative alleles B (frequencyp) and b (frequency q), the equation looks like this:
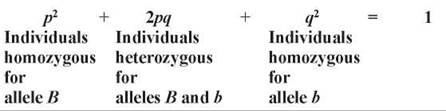
You will notice that not only does the sum of the alleles add up to 1 but so does the sum of the frequencies of genotypes.
Knowing the frequencies of the alleles in a population doesn’t reveal whether the population is evolving or not. We need to look at future generations to determine this. Using the allele frequencies calculated for our population of cats, we can predict what the genotypic and phenotypic frequencies will be in future generations. The Punnett square shown on the right in figure 14.21 is constructed with allele frequencies of 0.6 for the B allele and 0.4 for the b allele, taken from the bottom row of the chart. It might help you to consider these frequencies as percentages, with a 0.6 representing 60% of the population and 0.4 representing 40% of the population. According to the Hardy-Weinberg rule, 60% of the sperm in the population will carry the B allele (indicated as p = 0.6 in the Punnett square) and 40% of the sperm will carry the b allele (q = 0.4). When these are crossed with eggs carrying the same allele frequencies (60% orp = 0.6 B allele and 40% or q = 0.4 b allele), the predicted genotypic frequencies can be simply calculated. The genotypic ratio for BB, in the upper quadrant, equals the frequency of B (0.6) multiplied by the frequency of B (0.6) or (0.6 x 0.6 = 0.36). So, if the population is not evolving, the genotypic ratio for BB would stay the same, and 0.36 or 36% of the cats in future generations would be homozygous dominant (BB) for coat color. Likewise, 0.48 or 48% of the cats would be heterozygous Bb (0.24 + 0.24 = 0.48), and 0.16 or 16% of the cats would be homozygous recessive bb.
Hardy-Weinberg Assumptions
The Hardy-Weinberg rule is based on certain assumptions. The equation on page 300 is true only if the following five assumptions are met:
1. The size of the population is very large or effectively infinite.
2. Individuals mate with one another at random.
3. There is no mutation.
4. There is no input of new copies of any allele from any extraneous source (such as migration from a nearby population) or losses of copies of alleles through emigration (individuals leaving the population).
5. All alleles are replaced equally from generation to generation (natural selection is not occurring).
Hardy-Weinberg: A Null Hypothesis
Many populations, and most human populations, are large and randomly mating with respect to most traits (a few traits affecting appearance undergo strong sexual selection in humans). Thus, many populations are similar to the ideal population envisioned by Hardy and Weinberg. For some genes, however, the observed proportion of heterozygotes does not match the value calculated from the allele frequencies. When this occurs, it indicates that something is acting on the population to alter one or more of the genotypic frequencies, whether it is selection, nonrandom mating, migration, or some other factor. Viewed in this light, Hardy-Weinberg can be viewed as a null hypothesis. A null hypothesis is a prediction that is made stating there will be no differences in the parameters being measured. If over several generations, the genotypic frequencies in the population do not match those predicted by the Hardy-Weinberg equation, the null hypothesis would be rejected and the assumption made that some force is acting on the population to change the frequencies of alleles. The factors that can affect the frequencies of alleles in a population are discussed in detail later in this chapter.
Case-Study: Cystic Fibrosis in Humans
How valid are the predictions made by the Hardy-Weinberg equation? For many genes, they prove to be very accurate. As an example, consider the recessive allele responsible for the serious human disease cystic fibrosis. This allele (q) is present in Caucasians in North America at a frequency of 0.022. What proportion of Caucasian North Americans, therefore, is expected to express this trait? The frequency of double-recessive individuals (q2) is expected to be:
q2 = 0.022 x 0.022 = 0.00048
which equals 0.48 in every 1,000 individuals or about 1 in every 2,000 individuals, very close to real estimates.
What proportion is expected to be heterozygous carriers? If the frequency of the recessive allele q is 0.022, then the frequency of the dominant allele p must be p = 1 - q or:
p = 1 - 0.022 = 0.978
The frequency of heterozygous individuals (2pq) is thus expected to be:
2 x 0.978 x 0.022 = 0.043
It is estimated that 12 million individuals in the United States are carriers of the cystic fibrosis allele. In a population of 292 million people, that is a frequency of 0.041, very close to projections using the Hardy-Weinberg equation. However, if the frequency of the cystic fibrosis allele in the United States were to change, this would suggest that the population is no longer following the assumptions of the Hardy-Weinberg rule. For example, if prospective parents who were carriers of the allele chose not to have children, the frequency of the allele would decrease in future generations. Mating would no longer be random, because those carrying the allele would not mate. Consider another scenario. If gene therapies were developed that were able to cure the symptoms of cystic fibrosis, patients would survive longer and would have more of an opportunity to reproduce. This would increase the frequency of the allele in future generations. An increase could also result from an influx of the allele into the population by migration, if the allele were more frequent among individuals migrating into the country.
Key Learning Outcome 14.8. In a large, randomly-mating population that fulfills the other Hardy-Weinberg assumptions, allele frequencies can be expected to be in Hardy-Weinberg equilibrium.
If they are not, then the population is undergoing evolutionary change.