THE LIVING WORLD
Unit Eight. The Living Environment
35. Populations and Communities
Within its range, a species typically is found living in local populations, separated to at least some extent from other populations of that species. In this section, we will focus on the factors that influence whether a population will grow or shrink, and at what rate, and these factors are also important when considering our own population. Although we humans picture ourselves as different from populations of animals living in the wild, factors that affect wild populations affect human populations in similar ways.
One of the critical properties of any population is its population size—the number of individuals in the population. For example, if an entire species consists of only one or a few small populations, that species is likely to become extinct, especially if it occurs in areas that have been or are being radically changed. In addition to population size, population density—the number of individuals that occur in a unit area, such as per square kilometer—is often an important characteristic. The density of a population, how closely individuals associate with each other, is an indication of how they live. Animals that live in small family groups, like the Siberian tiger seen in figure 35.9a, often have few predators, while animals that live in large groups, such as the herd of wildebeests seen in figure 35.9b, may find safety in numbers.
In addition to size and density, another key characteristic of any population is its capacity to grow. To understand populations we must consider this, and what factors in nature limit population growth.
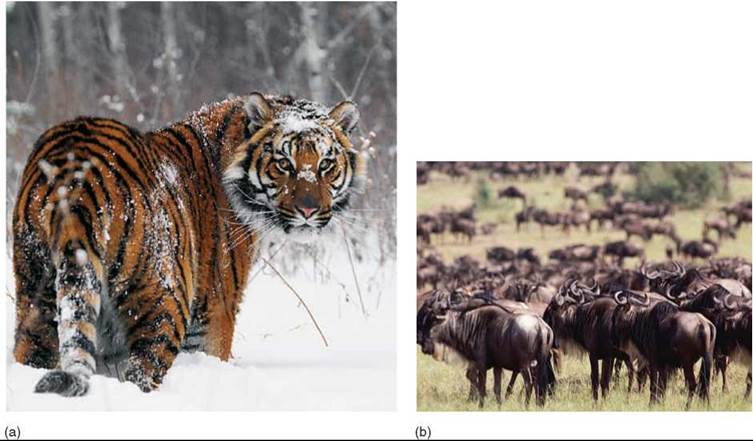
Figure 35.9. Population density.
(a) Siberian tigers occupy enormous territories (typically 60-100 km2 for an adult male) because of the relative lack of prey in the dense Siberian forests, especially in winter. (b) This Serengeti wildebeest herd numbers over 1 million animals.
The Exponential Growth Model
The simplest model of population growth assumes a population growing without limits at its maximal rate. This rate, symbolized r and called the biotic potential, is the rate at which a population of a given species will increase when no limits are placed on its rate of growth. In mathematical terms, this is defined by the following formula:
![]()
where N is the number of individuals in the population, G is the change in its numbers over time (growth rate), and ri is the intrinsic rate of natural increase for that population—its innate capacity for growth.
The actual rate of population increase r is defined as the difference between the birthrate b and the death rate d corrected for any movement of individuals in or out of the population, whether emigration (movement out of the area e) or immigration (movement into the area i). Thus,
![]()
Movements of individuals can have a major impact on population growth rates. For example, the increase in human population in the United States during the closing decades of the twentieth century was mostly due to immigrants. Less than half of the increase came from the reproduction of the people already living there.
The innate capacity for growth of any population is exponential, and is called exponential growth. Even when the rate of increase remains constant, the actual increase in the number of individuals accelerates rapidly as the size of the population grows. Rapid exponential growth is indicated by the red line in figure 35.10. This sort of growth pattern is similar to that obtained by compounding interest on an investment. In practice, such patterns prevail only for short periods, usually when an organism reaches a new habitat with abundant resources. Natural examples include dandelions reaching the fields, lawns, and meadows of North America from Europe for the first time; algae colonizing a newly formed pond; or the first plants arriving on an island recently thrust up from the sea.
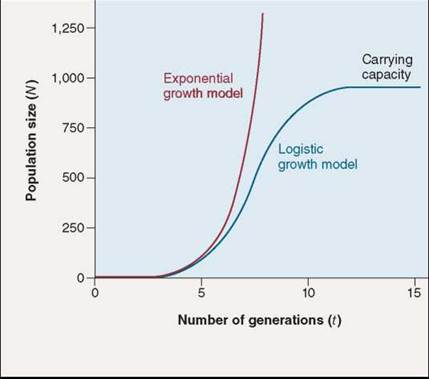
Figure 35.10. Two models of population growth.
The red line illustrates the exponential growth model for a population with an r of 1.0. The blue line illustrates the logistic growth model in a population with r = 1.0 and K = 1,000 individuals. At first, logistic growth accelerates exponentially, and then, as resources become limiting, the birthrate decreases or the death rate increases, and growth slows. Growth ceases when the death rate equals the birthrate. The carrying capacity (K) ultimately depends on the resources available in the environment.
Carrying Capacity
No matter how rapidly populations grow, they eventually reach a limit imposed by shortages of important environmental factors such as space, light, water, or nutrients. A population usually ultimately stabilizes at a certain size, called the carrying capacity of the particular place where it lives, and the size of the population levels off, like the blue line in figure 35.10. The carrying capacity, symbolized by K, is the maximum number of individuals that an area can support.
The Logistic Growth Model
As a population approaches its carrying capacity, its rate of growth slows greatly, because fewer resources remain for each new individual to use. The growth curve of such a population, which is always limited by one or more factors in the environment, can be approximated by the following logistic growth equation that adjusts the growth rate to account for the lessening availability of limiting factors:
In this logistic model of population growth, the growth rate of the population (G) equals its rate of increase (r multiplied by N, the number of individuals present at any one time), adjusted for the amount of resources available. The adjustment is made by multiplying rN by the fraction of K still unused (K minus N, divided by K). As N increases (the population grows in size), the fraction by which r is multiplied (the remaining resources) becomes smaller and smaller, and the rate of increase of the population declines.
In mathematical terms, as N approaches K, the rate of population growth (G) begins to slow, until it reaches 0 when N = K (the blue line in figure 35.10). In practical terms, factors such as increasing competition among more individuals for a given set of resources, the buildup of waste, or an increased rate of predation causes the decline in the rate of population growth.
Graphically, if you plot N versus t (time), you obtain an S-shaped sigmoid growth curve characteristic of most biological populations. The curve is called “sigmoid” because its shape has a double curve like the letter S. As the size of a population stabilizes at the carrying capacity, its rate of growth slows down, eventually coming to a halt. The fur seal population in figure 35.11 has a carrying capacity of about 10,000 breeding male seals.
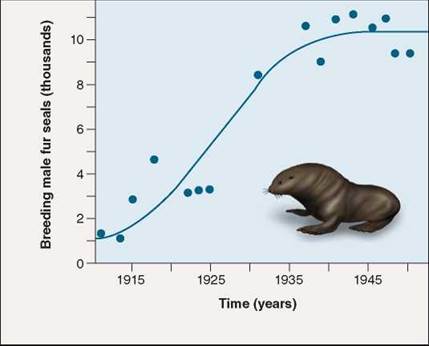
Figure 35.11. Most natural populations exhibit logistic growth.
These data present the history of a fur seal (Callorhinus ursinus) population on St. Paul Island, Alaska. Driven almost to extinction by hunting in the late 1800s, the fur seal made a comeback after hunting was banned in 1911. Today the number of breeding males with "harems" oscillates around 10,000 individuals, presumably the carrying capacity of the island.
Processes such as competition for resources, emigration, and the accumulation of toxic wastes all tend to increase as a population approaches its carrying capacity for a particular habitat. The resources for which the members of the population are competing may be food, shelter, light, mating sites, mates, or any other factor needed to survive and reproduce.
Key Learning Outcome 35.4. The size at which a population stabilizes in a particular place is defined as the carrying capacity of that place for that species. Populations increase in size to the carrying capacity of their environment.