THE LIVING WORLD
Unit Eight. The Living Environment
35. Populations and Communities
Demography is the statistical study of populations. The term comes from two Greek words: demos, “the people” (the same root we see in the word democracy), and graphos, “measurement.” Demography therefore means measurement of people, or, by extension, of the characteristics of populations. Demography is the science that helps predict how population sizes will change in the future. Populations grow if births outnumber deaths and shrink if deaths outnumber births. Because birthrates and death rates also depend on age and sex, the future size of a population depends on its present age structure and sex ratio.
Age Structure
Many annual plants and insects time their reproduction to particular seasons of the year and then die. All members of these populations are the same age. Perennial plants and longer- lived animals contain individuals of more than one generation, so that in any given year individuals of different ages are reproducing within the population. A group of individuals of the same age is referred to as a cohort.
Within a population, every cohort has a characteristic birthrate, or fecundity, defined as the number of offspring produced in a standard time (for example, per year), and a characteristic death rate, or mortality, the number of individuals that die in that period. The rate of a population’s growth depends on the difference between these two rates.
The relative number of individuals in each cohort defines a population’s age structure. Because individuals of different ages have different fecundity and death rates, age structure has a critical impact on a population’s growth rate. A population with a large proportion of young individuals, for example, tends to grow rapidly because an increasing proportion of its individuals are reproductive.
Sex Ratio
The proportion of males and females in a population is its sex ratio. The number of births is usually directly related to the number of females, but it may not be as closely related to the number of males in species where a single male can mate with several females. In deer, elk, lions, and many other animals, a reproductive male guards a “harem” of females with which he mates, while preventing other males from mating with them. In such species, a reduction in the number of males simply changes the identities of the reproductive males without reducing the number of births. Among monogamous species like many birds, by contrast, where pairs form long- lasting reproductive relationships, a reduction in the number of males can directly reduce the number of births.
Mortality and Survivorship Curves
A population’s intrinsic rate of increase depends on the ages of the organisms in it and the reproductive performance of the individuals in the various age groups. When a population lives in a constant environment for a few generations, its age distribution—the proportion of individuals in different age categories—tends to stabilize. This distribution differs greatly from species to species and even, to some extent, from population to population within a given species. Depending on the mating system of the species, sex ratio and generation time can also have a significant effect on population growth. A population whose size remains fairly constant through time is called a stable population. In such a population, births plus immigration must balance deaths plus emigration.
One way to express the age distribution characteristics of populations is through a survivorship curve. Survivorship is defined as the percentage of an original population that survives to a given age. Examples of different kinds of survivorship curves are shown in figure 35.15. In hydra, animals related to jellyfish, individuals are equally likely to die at any age, as indicated by the straight survivorship curve (the blue line, type II). Oysters, like plants, produce vast numbers of offspring, only a few of which live to reproduce. However, once they become established and grow into reproductive individuals, their mortality is extremely low (red line, type III survivorship curve). Finally, even though human babies are susceptible to death at relatively high rates, mortality in humans, as in many animals and protists, rises in the postreproductive years (green line, type I survivorship curve).
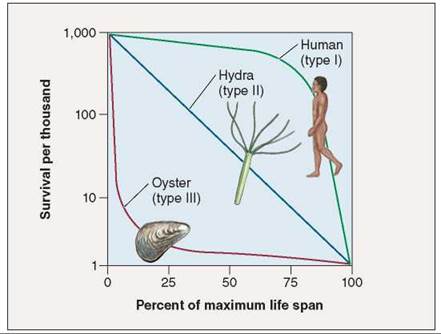
Figure 35.15. Survivorship curves.
By convention, survival (the vertical axis) is plotted on a log scale. Humans have a type I life cycle, the hydra (an animal related to jellyfish) type II, and oysters type III.
Key Learning Outcome 35.7. The growth rate of a population is a sensitive function of its age structure. In some species, mortality is higher among the young, and in others, among the old; in only a few is mortality independent of age.