THE LIVING WORLD
Unit Eight. The Living Environment
36.2. Ecological Pyramids
As previously mentioned, a plant fixes about 1% of the sun’s energy that falls on its green parts. The successive members of a food chain, in turn, process into their own bodies on average about 10% of the energy available in the organisms on which they feed. For this reason, there are generally far more individuals at the lower trophic levels of any ecosystem than at the higher levels. Similarly, the biomass of the primary producers present in a given ecosystem is greater than the biomass of the primary consumers, with successive trophic levels having a lower and lower biomass and correspondingly less potential energy. Larger animals are characteristically members of the higher trophic levels. To some extent, they must be larger to be able to capture enough prey in the lower trophic levels.
These relationships, if shown diagrammatically, appear as pyramids. Ecologists speak of “pyramids of numbers,” where the sizes of the blocks reflect the number of individuals at each trophic level. As you can see in the aquatic example in figure 36.5a, the producers in the green box represent the largest number of individuals. Similarly, the producers (plankton) represent the largest group in “pyramids of biomass,” shown in figure 36.5b where the sizes of the blocks reflect the total weight of all the organisms at each trophic level. The inverted pyramid in figure 36.5c is an exception and is discussed below. The “pyramid of energy” in figure 36.5d shows the producers as the largest block, reflecting the amount of energy stored at this trophic level.
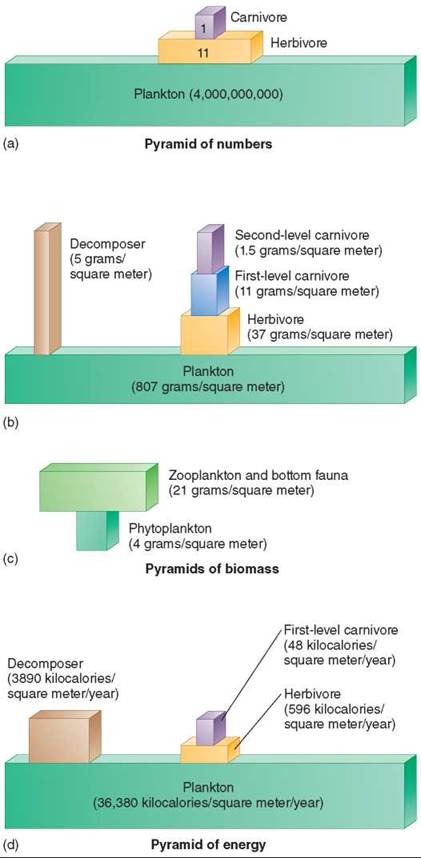
Figure 36.5. Ecological pyramids.
Ecological pyramids measure different characteristics of each trophic level. (a) Pyramid of numbers. Pyramids of biomass, both normal (b) and inverted (c). (d) Pyramid of energy. In the above aquatic examples, the producers are plankton.
Inverted Pyramids
Some aquatic ecosystems have inverted biomass pyramids, like in figure 36.5c. In a planktonic ecosystem—dominated by small organisms floating in water—the turnover of photosynthetic phytoplankton at the lowest level is very rapid, with zooplankton consuming phytoplankton so quickly that the phytoplankton (the producers at the base of the food chain) can never develop a large population size. Because the phytoplankton reproduce very rapidly, the community can support a population of heterotrophs that is larger in biomass and more numerous than the phytoplankton. However, don’t confuse the sizes of these bars with the energy present at each level. The zooplankton that eat the phytoplankton are present in greater numbers but they contain about only 10% of the energy.
The loss of energy that occurs at each trophic level places a limit on how many top-level carnivores a community can support. As we have seen, only about one-thousandth of the energy captured by photosynthesis passes all the way through a three-stage food chain to a tertiary consumer such as a snake or hawk. This explains why there are no predators that subsist on lions or eagles—the biomass of these animals is simply insufficient to support another trophic level.
In the pyramid of numbers, top-level predators tend to be fairly large animals. Thus, the small residual biomass available at the top of the pyramid is concentrated in a relatively small number of individuals.
Key Learning Outcome 36.2. Because energy is lost at every step of a food chain, the biomass of primary producers (photosynthesizers) tends to be greater than that of the herbivores that consume them, and herbivore biomass tends to be greater than the biomass of the carnivores that consume them.