Lippincott’s Illustrated Reviews: Biochemistr, Sixth Edition (2014)
UNIT V: Integration of Metabolism
Chapter 27. Nutrition
I. OVERVIEW
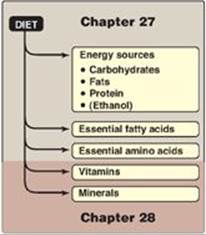
Nutrients are the constituents of food necessary to sustain the normal functions of the body. All energy is provided by three classes of nutrients: fats, carbohydrates, and protein, with ethanol providing calories in some diets (Figure 27.1). Because the intake of these energy-rich molecules is larger than that of the other dietary nutrients, they are called macronutrients. This chapter focuses on the kinds and amounts of macronutrients that are needed to maintain optimal health and prevent chronic disease in adults. Those nutrients needed in lesser amounts, vitamins and minerals, are called micronutrients and are considered in Chapter 28.
Figure 27.1 Essential nutrients obtained from the diet. [Note: Ethanol is not considered an essential component of the diet but may provide a significant contribution to the daily caloric intake of some individuals.]
II. DIETARY REFERENCE INTAKES
Committees of U.S. and Canadian experts organized by the Food and Nutrition Board of the Institute of Medicine of the National Academy of Sciences have compiled Dietary Reference Intakes (DRIs), which are estimates of the amounts of nutrients required to prevent deficiencies and maintain optimal health and growth. The DRI expands on the Recommended Dietary Allowances (RDAs), which have been published with periodic revisions since 1941. Unlike the RDA, the DRI establishes upper limits on the consumption of some nutrients and incorporates the role of nutrients in lifelong health, going beyond deficiency diseases. Both the DRI and the RDA refer to long-term average daily nutrient intakes, because it is not necessary to consume the full RDA every day.
A. Definition of Dietary Reference Intake
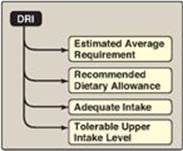
The DRIs consist of four dietary reference standards for the intake of nutrients designated for specific life stage (age) groups, physiologic states, and gender (Figure 27.2).
1. Estimated Average Requirement: The average daily nutrient intake level estimated to meet the requirement of one half of the healthy individuals in a particular life stage and gender group is the Estimated Average Requirement (EAR). It is useful in estimating the actual requirements in groups and individuals.
2. Recommended Dietary Allowance: The RDA is the average daily dietary intake level that is sufficient to meet the nutrient requirements of nearly all (97%–98%) individuals in a life stage and gender group. The RDA is not the minimal requirement for healthy individuals, but it is intentionally set to provide a margin of safety for most individuals. The EAR serves as the foundation for setting the RDA. If the standard deviation (SD) of the EAR is available and the requirement for the nutrient is normally distributed, the RDA is set at 2 SDs above the EAR (that is, RDA = EAR + 2SDEAR).
Figure 27.2 Components of the Dietary Reference Intakes (DRI).
3. Adequate Intake: An Adequate Intake (AI) is set instead of an RDA if sufficient scientific evidence is not available to calculate an EAR or RDA. The AI is based on estimates of nutrient intake by a group (or groups) of apparently healthy people. For example, the AI for young infants, for whom human milk is the recommended sole source of food for the first 4–6 months, is based on the estimated daily mean nutrient intake supplied by human milk for healthy, full-term infants who are exclusively breastfed.
4. Tolerable Upper Intake Level: The highest average daily nutrient intake level that is likely to pose no risk of adverse health effects to almost all individuals in the general population is the Tolerable Upper Intake Level (UL). As intake increases above the UL, the potential risk of adverse effects may increase. The UL is useful because of the increased availability of fortified foods and the increased use of dietary supplements. For some nutrients, there may be insufficient data on which to develop a UL.
B. Using the Dietary Reference Intakes
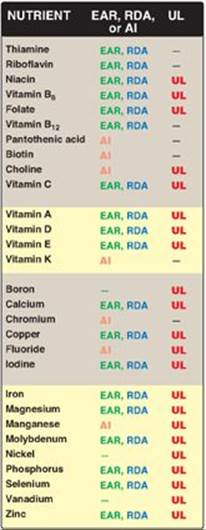
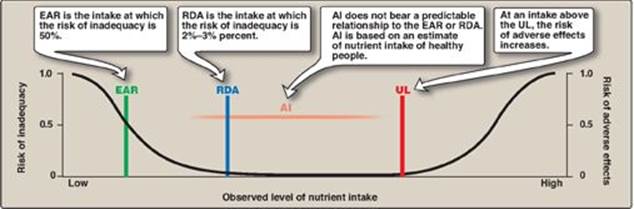
Most nutrients have a set of DRIs (Figure 27.3). Usually a nutrient has an EAR and a corresponding RDA. Most are set by age and gender and may be influenced by special factors, such as pregnancy and lactation in women. When the data are not sufficient to estimate an EAR (or an RDA), an AI is designated. Intakes below the EAR need to be improved because the probability of adequacy is 50% or less (Figure 27.4). Intakes between the EAR and RDA likely need to be improved because the probability of adequacy is less than 98%, and intakes at or above the RDA can be considered adequate. Intakes above the AI can be considered adequate. Intakes between the UL and the RDA can be considered to have no risk for adverse effects. [Note: The DRI is designed to meet the nutritional needs of the healthy and, thus, does not include any special needs of the sick.]
Figure 27.3 Dietary Reference Intakes for vitamins and minerals in individuals age 1 year and older. EAR = Estimated Average Requirement; RDA = Recommended Dietary Allowance; AI = Adequate Intake; UL = Tolerable Upper Intake Level; – = no value established.
III. ENERGY REQUIREMENT IN HUMANS
The Estimated Energy Requirement (EER) is the average dietary energy intake predicted to maintain an energy balance (that is, when the calories consumed are equal to the energy expended) in a healthy adult of a defined age, gender, and height whose weight and level of physical activity are consistent with good health. Differences in the genetics, body composition, metabolism, and behavior of individuals make it difficult to accurately predict a person’s caloric requirements. However, some simple approximations can provide useful estimates. For example, sedentary adults require about 30 kcal/kg/day to maintain body weight, moderately active adults require 35 kcal/kg/day, and very active adults require 40 kcal/kg/day. [Note: The EER that is listed on food labels is either 2,000 or 2,500 kcal/day.]
A. Energy content of food
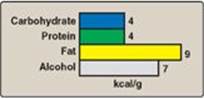
The energy content of food is calculated from the heat released by the total combustion of food in a calorimeter. It is expressed in kilocalories (kcal, or Cal). The standard conversion factors for determining the metabolic caloric value of fat, protein, and carbohydrate are shown in Figure 27.5. Note that the energy content of fat is more than twice that of carbohydrate or protein, whereas the energy content of ethanol is intermediate between those of fat and carbohydrate. [Note: The joule (J) is a unit of energy widely used in countries other than the United States. One cal = 4.2 J; 1 Cal (1 kcal, 1 food calorie) = 4.2 kJ. For uniformity, many scientists are promoting the use of joules rather than calories in the United States. However, kcal still predominates and is used throughout this text.]
Figure 27.4 Comparison of the components of the Dietary Reference Intakes. EAR = Estimated Average Requirement; RDA = Recommended Dietary Allowance; AI = Adequate Intake; UL = Tolerable Upper Intake Level.
B. Use of food energy in the body
The energy generated by metabolism of the macronutrients is used for three energy-requiring processes that occur in the body: resting metabolic rate (RMR), physical activity, and thermic effect of food (formerly termed specific dynamic action). The number of calories expended by these processes in a 24-hour period is the total energy expenditure (TEE).
Figure 27.5 Average energy available from the major food components.
1. Resting metabolic rate: RMR is the energy expended by an individual in a resting, postabsorptive state. It represents the energy required to carry out the normal body functions, such as respiration, blood flow, and ion transport. [Note: A basal metabolic rate (BMR) is determined under more stringent environmental conditions. BMR can be determined by measuring O2 consumed or CO2 produced (indirect calorimetry). It also can be estimated using equations that include sex and age (BMR reflects lean muscle mass, which is highest in men and the young) as well as height and weight. A commonly used rough estimate is 1 kcal/kg/hour for men and 0.9 kcal/kg/hour for women. RMR is about 10% higher than the BMR.] In an adult, the 24-hour RMR, known as the resting energy expenditure (REE), is about 1,800 kcal for men (70 kg) and 1,300 kcal for women (50 kg). From 50%–70% of the TEE in sedentary individuals is attributable to the REE (Figure 27.6). [Note: Hospitalized individuals are commonly hypercatabolic, and an “injury factor” is included in calculating their TEE.]
2. Physical activity: Muscular activity provides the greatest variation in the TEE. The amount of energy consumed depends on the duration and intensity of the exercise. The daily expenditure of energy can be estimated by carefully recording the type and duration of all activities to determine a physical activity factor. In general, a sedentary person requires about 30%–50% more calories than the RMR (see Figure 27.6), whereas a highly active individual may require 100% or more calories above the RMR.
Figure 27.6 Estimated total energy expenditure in a healthy 20-year-old woman, 165 cm (5 feet, 4 inches) tall, weighing 50 kg (110 lb), and engaged in light activity.
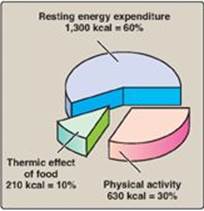
3. Thermic effect of food: The production of heat by the body increases as much as 30% above the resting level during the digestion and absorption of food. This is called the thermic effect of food, or diet-induced thermogenesis. The thermic response to food intake may amount to 5%–10% of the TEE.
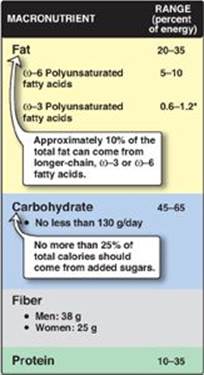
Figure 27.7 Acceptable macronutrient distribution ranges in adults. *A growing body of evidence suggests that higher levels of ω-3 polyunsaturated fatty acids provide protection against coronary heart disease.
IV. ACCEPTABLE MACRONUTRIENT DISTRIBUTION RANGES
Acceptable Macronutrient Distribution Ranges (AMDRs) are defined as a range of intakes for a particular macronutrient that is associated with reduced risk of chronic disease while providing adequate amounts of essential nutrients. The AMDR for adults is 45%–65% of their total calories from carbohydrates, 20%–35% from fat, and 10%–35% from protein (Figure 27.7). The biologic properties of dietary fat, carbohydrate, and protein are described below.
V. DIETARY FATS
The incidence of a number of chronic diseases is significantly influenced by the kinds and amounts of nutrients consumed (Figure 27.8). Dietary fats most strongly influence the incidence of coronary heart disease (CHD), but evidence linking dietary fat and the risk for cancer or obesity is much weaker.
Although earlier recommendations emphasized decreasing the total amount of fat and cholesterol in the diet, data now show that the type of fat is a more important risk factor than the total amount of fat consumed.
A. Plasma lipids and coronary heart disease
Plasma cholesterol may arise from the diet or from endogenous biosynthesis. In either case, cholesterol is transported between the tissues in combination with protein and phospholipids as lipoproteins.
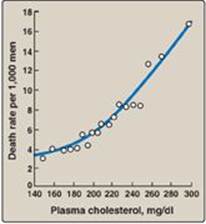
1. Low-density lipoprotein and high-density lipoprotein: The level of plasma cholesterol is not precisely regulated but, rather, varies in response to the diet. Elevated levels of total cholesterol (hypercholesterolemia) result in an increased risk for CHD (Figure 27.9). A much stronger correlation exists between CHD and the level of cholesterol in low-density lipoproteins ([LDL-C] see p. 232). As LDL-C increases, CHD increases. In contrast, high levels of high-density lipoprotein cholesterol (HDL-C) have been associated with a decreased risk for heart disease (see p. 235). [Note: Elevated plasma triacylglycerol (TAG) is associated with CHD, but a causative relationship has yet to be demonstrated.] Abnormal levels of plasma lipids (dyslipidemias) act in combination with smoking, obesity, sedentary lifestyle, insulin resistance, and other risk factors to increase the risk of CHD.
2. Benefits of lowering plasma cholesterol: Dietary or drug treatment of hypercholesterolemia has been shown to be effective in decreasing LDL-C, increasing HDL-C, and reducing the risk for cardiovascular events. The diet-induced changes of plasma lipoprotein concentrations are modest, typically 10%–20%, whereas treatment with “statin” drugs decreases plasma cholesterol by 30%–60% (see p. 224). [Note: Dietary and drug treatment can lower TAGs.]
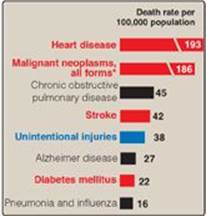
Figure 27.8 Influence of nutrition on some common causes of death in the United States in the year 2010. Red indicates causes of death in which the diet plays a significant role. Blue indicates causes of death in which excessive alcohol consumption plays a part. (*Diet plays a role in only some forms of cancer.)
B. Dietary fats and plasma lipids
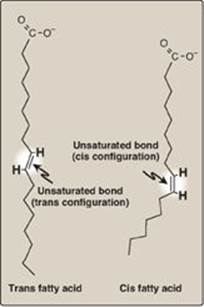
TAGs are quantitatively the most important class of dietary fats. The influence of TAGs on blood lipids is determined by the chemical nature of their constituent fatty acids. The absence or presence and number of double bonds (saturated versus mono- and polyunsaturated), the location of the double bonds (w-6 versus w-3), and the cis versus trans configuration of the unsaturated fatty acids are the most important structural features that influence blood lipids.
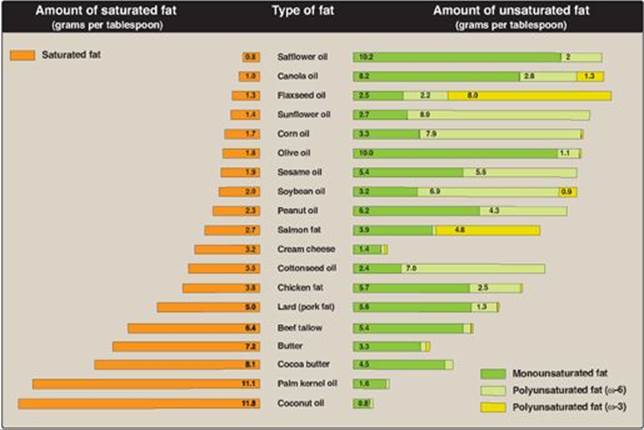
1. Saturated fat: TAGs composed primarily of fatty acids whose hydrocarbon chains do not contain any double bonds are referred to as saturated fats. Consumption of saturated fats is positively associated with high levels of total plasma cholesterol and LDL-C and an increased risk of CHD. The main sources of saturated fatty acids are dairy and meat products and some vegetable oils, such as coconut and palm oils (a major source of fat in Latin America and Asia, although not in the United States; Figure 27.10). Most experts strongly advise limiting intake of saturated fats to less than 10% of total caloric intake.
Saturated fatty acids with carbon chain lengths of 14 (myristic) and 16 (palmitic) are most potent in increasing the serum cholesterol. Stearic acid (18 carbons, found in many foods including chocolate) has little effect on blood cholesterol.
2. Monounsaturated fats: TAGs containing primarily fatty acids with one double bond are referred to as monounsaturated fat. Unsaturated fatty acids are generally derived from vegetables and fish. When substituted for saturated fatty acids in the diet, monounsaturated fats lower both total plasma cholesterol and LDL-C but maintain or increase HDL-C. This ability of monounsaturated fats to favorably modify lipoprotein levels may explain, in part, the observation that Mediterranean cultures, with diets rich in olive oil (high in monounsaturated oleic acid), show a low incidence of CHD. It is recommended that monounsaturated fats account for about 50% of the total fat intake.
Figure 27.9 Correlation of the death rate from coronary heart disease with the concentration of plasma cholesterol. [Note: The data were obtained from a 6-year study of men with the death rate adjusted for age.]
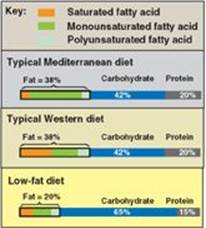
a. The Mediterranean diet: The Mediterranean diet is an example of a diet rich in monounsaturated fatty acids, or MUFAs (from olive oil), and polyunsaturated fatty acids, or PUFAs (from fish oils and some nuts), but low in saturated fat. For example, Figure 27.11 shows the composition of the Mediterranean diet in comparison with both a Western diet similar to that consumed in the United States and a typical low-fat diet. The Mediterranean diet contains seasonally fresh food, with an abundance of plant material, low amounts of red meat, and olive oil as the principal source of fat. The Mediterranean diet is associated with decreased serum total cholesterol and LDL-C, decreased TAGs, and increased HDL-C when compared with a typical Western diet higher in saturated fats.
Figure 27.10 Compositions of commonly encountered dietary fats.
3. Polyunsaturated fats: TAGs containing primarily fatty acids with more than one double bond are referred to as polyunsaturated fats. The effects of PUFAs on cardiovascular disease is influenced by the location of the double bonds within the molecule.
Figure 27.11 Composition of typical Mediterranean, Western, and low-fat diets.
a. ω-6 Fatty acids: These are long-chain PUFAs, with the first double bond beginning at the sixth bond position when starting from the methyl (ω) end of the fatty acid molecule. [Note: They are also called n-6 fatty acids (see p. 183).]
Consumption of fats containing w-6 PUFAs, principally linoleic acid (18:2 [9,12]), obtained from vegetable oils, lowers plasma cholesterol when substituted for saturated fats. Plasma LDL-C is lowered, but HDL-C, which protects against CHD, is also lowered. The powerful benefits of lowering LDLs are only partially offset because of the decreased HDL. Nuts, avocados, olives, soybeans, and various oils, including sunflower, cottonseed, and corn oil, are common sources of these fatty acids (see Figure 27.10). The AMDR for linoleic acid is 5%–10%. [Note: The lower recommendation for PUFAs relative to MUFAs is because of concern that free radical–mediated oxidation (peroxidation) of PUFAs may lead to deleterious products.]
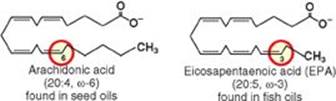
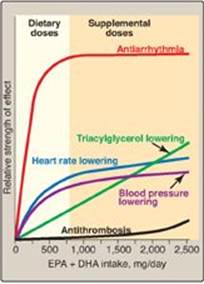
b. ω-3 Fatty acids: These are long-chain PUFAs, with the first double bond beginning at the third bond position from the methyl (ω) end. Dietary w-3 PUFAs suppress cardiac arrhythmias, reduce serum TAGs, decrease the tendency for thrombosis, lower blood pressure, and substantially reduce risk of cardiovascular mortality (Figure 27.12), but they have little effect on LDL-C or HDL-C levels. Evidence suggests that they have anti-inflammatory effects. The w-3 PUFAs, principally α-linolenic acid, 18:3(9,12,15), are found in plant oils, such as flaxseed and canola, and some nuts. The AMDR for α-linolenic acid is 0.6%–1.2%. Fish oil contains the long-chain ω-3 docosahexaenoic acid (DHA) and eicosapentaenoic acid (EPA). Two fatty fish (for example, salmon) meals per week are recommended. For patients with documented CHD, 1 g/day of fish oils is recommended, while 2–4 g/day is prescribed to lower TAGs. [Note: The ω-3 long-chain PUFAs are included in infant formulas to promote brain development.] Linoleic and α-linolenic acids are essential fatty acids (EFAs) required for membrane fluidity and synthesis of eicosanoids (see p. 213). EFA deficiency is characterized by scaly dermatitis as a result of the depletion of skin ceramides with long-chain fatty acids (see p. 206).]
Figure 27.12 Dose responses of physiologic effects of fish oil intake. EPA = eicosapentaenoic acid; DHA = docosahexaenoic acid.
4. Trans fatty acids: Trans fatty acids (Figure 27.13) are chemically classified as unsaturated fatty acids but behave more like saturated fatty acids in the body because they elevate serum LDL-C (but not HDL-C), and they increase the risk of CHD. Trans fatty acids do not occur naturally in plants but occur in small amounts in animals. However, trans fatty acids are formed during the hydrogenation of liquid vegetable oils (for example, in the manufacture of margarine and partially hydrogenated vegetable oil). Trans fatty acids are a major component of many commercial baked goods, such as cookies and cakes, and most deep-fried foods. Many manufacturers have reformulated their products to be free of trans fats. Starting in 2006, the U.S. Food and Drug Administration requires that Nutrition Facts labels portray the trans fat content of packaged food. Some municipalities, such as New York City, have banned the use of trans fats in restaurants.
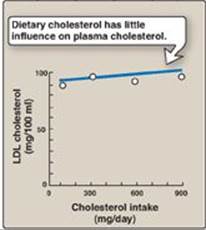
5. Dietary cholesterol: Cholesterol is found only in animal products. The effect of dietary cholesterol on plasma cholesterol (Figure 27.14) is less important than the amount and types of fatty acids consumed. Cholesterol consumption should be no more than 300 mg/day.
Figure 27.13 Structure of cis and trans fatty acids.
C. Other dietary factors affecting coronary heart disease
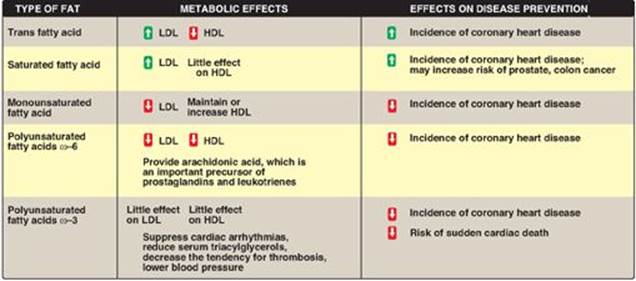
Moderate consumption of alcohol (up to 1 drink a day for women and up to 2 drinks a day for men) decreases the risk of CHD, because there is a positive correlation between moderate alcohol consumption and the plasma concentration of HDL-C. However, because of the potential dangers of alcohol abuse, health professionals are reluctant to recommend increased alcohol consumption to their patients. Red wine may provide cardioprotective benefits in addition to those resulting from its alcohol content (for example, red wine contains phenolic compounds that inhibit lipoprotein oxidation; see p. 235). [Note: These antioxidants are also present in raisins and grape juice.] Figure 27.15 summarizes the effects of dietary fats.
Figure 27.14 Response of plasma low-density lipoprotein (LDL) concentrations to an increase in dietary cholesterol intake.
VI. DIETARY CARBOHYDRATES
The primary role of dietary carbohydrate is to provide energy. Although caloric intake in the United States has shown a modest increase since 1971, the incidence of obesity has dramatically increased (see p. 349). During this same period, carbohydrate consumption has significantly increased (as fat consumption decreased), leading some observers to link obesity with carbohydrate consumption. However, obesity has also been related to increasingly inactive lifestyles and to calorie-dense foods served in expanded portion size. Carbohydrates are not inherently fattening.
A. Classification of carbohydrates
Dietary carbohydrates are classified as simple sugars (monosaccharides and disaccharides), complex sugars (polysaccharides), and fiber.
1. Monosaccharides: Glucose and fructose are the principal monosaccharides found in food. Glucose is abundant in fruits, sweet corn, corn syrup, and honey. Free fructose is found together with free glucose and sucrose in honey and fruits (for example, apples).
Figure 27.15 Effects of dietary fats. LDL = low-density lipoprotein; HDL = high-density lipoprotein.
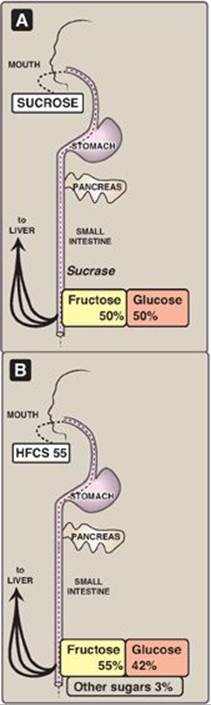
a. High-fructose corn syrup: High-fructose corn syrups (HFCSs) are corn syrups that have undergone enzymatic processing to convert their glucose into fructose and have then been mixed with pure corn syrup (100% glucose) to produce a desired sweetness. In the United States, HFCS 55 (containing 55% fructose and 42% glucose) is commonly used as a substitute for sucrose in beverages, including soft drinks, with HFCS 42 used in processed foods. The composition and metabolism of HFCS and sucrose are similar, the major difference being that HFCS is ingested as a mixture of monosaccharides (Figure 27.16). Most studies have shown no significant difference between sucrose and HFCS syrup meals in either postprandial glucose or insulin responses. [Note: The rise in the use of HFCS parallels the rise in obesity, but a causal relationship has not been demonstrated.]
2. Disaccharides: The most abundant disaccharides are sucrose (glucose + fructose), lactose (glucose + galactose), and maltose (glucose + glucose). Sucrose is ordinary “table sugar” and is abundant in molasses and maple syrup. Lactose is the principal sugar found in milk. Maltose is a product of enzymic digestion of polysaccharides. It is also found in significant quantities in beer and malt liquors. The term “sugar” refers to monosaccharides and disaccharides. “Added sugars” are those sugars and syrups (such as HFCSs) added to foods during processing or preparation. [Note: Fructose is 1.7 times sweeter than sucrose.]
Figure 27.16 Digestion of high-fructose corn syrup (HFCS) 55 or sucrose leads to absorption of glucose plus fructose.
3. Polysaccharides: Complex carbohydrates are polysaccharides (most often polymers of glucose) that do not have a sweet taste. Starch is an example of a complex carbohydrate that is found in abundance in plants. Common sources include wheat and other grains, potatoes, dried peas and beans, and vegetables.
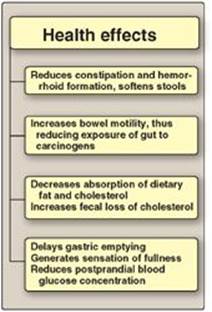
4. Fiber: Dietary fiber is defined as the nondigestible, nonstarch carbohydrates and lignin (a noncarbohydrate polymer of aromatic alcohols) present intact in plants. Soluble fiber is the edible parts of plants that is resistant to digestion and absorption in the human small intestine but is completely or partially fermented by bacteria to short-chain fatty acids in the large intestine. Insoluble fiber passes through the digestive track largely intact. Dietary fiber provides little energy but has several beneficial effects. First, it adds bulk to the diet (Figure 27.17). Fiber can absorb 10–15 times its own weight in water, drawing fluid into the lumen of the intestine and increasing bowel motility and promoting normal laxation. Soluble fiber delays gastric emptying and can result in a sensation of fullness. This delayed emptying also results in reduced peaks of blood glucose following a meal. Second, consumption of soluble fiber has now been shown to lower LDL-C levels by increasing fecal bile acid excretion and interfering with bile acid absorption (see p. 225). For example, diets rich (25–50 g/day) in the soluble fiber oat bran are associated with a modest, but significant, reduction in risk for CHD by lowering total cholesterol and LDL-C levels. Also, fiber-rich diets decrease the risk for constipation, hemorrhoids, and diverticulosis. The AI for dietary fiber is 25 g/day for women and 38 g/day for men. However, most American diets are far lower in fiber at approximately 15 g/day. [Note: “Functional fiber” is the term used for isolated fiber that has proven health benefits such as commercially available fiber supplements. Total fiber is the sum of dietary fiber and functional fiber.]
Figure 27.17 Actions of dietary fiber.
B. Dietary carbohydrate and blood glucose
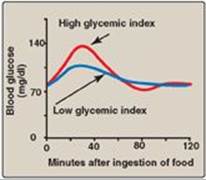
Some carbohydrate-containing foods produce a rapid rise followed by a steep fall in blood glucose concentration, whereas others result in a gradual rise followed by a slow decline. Thus, they differ in their glycemic response (GR). [Note: Fiber blunts the GR.] The glycemic index (GI) quantitates these differences in the time course of postprandial glucose concentrations (Figure 27.18). GI is defined as the area under the blood glucose curves seen after ingestion of a meal with carbohydrate-rich food, compared with the area under the blood glucose curve observed after a meal consisting of the same amount (50 g) of carbohydrate either as glucose or white bread. The clinical importance of the GI is unresolved, but evidence suggests that a low-GI diet improves glycemic control in diabetic individuals. Food with a low GI tends to create a sense of satiety over a longer period of time and may be helpful in limiting caloric intake. [Note: How much a typical serving size of a food raises blood glucose is referred to as the glycemic load (GL). A food (for example, carrots) can have a high GI and a low GL.]
C. Requirements for carbohydrate
Carbohydrates are not essential nutrients, because the carbon skeletons of most amino acids can be converted into glucose (see p. 261). However, the absence of dietary carbohydrate leads to ketone body production (see p. 262) and degradation of body protein whose constituent amino acids provide carbon skeletons for gluconeogenesis (see p. 118). The RDA for carbohydrate is set at 130 g/day for adults and children, based on the amount of glucose used by carbohydrate-dependent tissues, such as the brain and erythrocytes. However, this level of intake is usually exceeded to meet energy needs. Adults should consume 45%–65% of their total calories from carbohydrates. It is recommended that added sugar represent no more than 25% of total energy because of concerns that sugar may displace nutrient-rich foods from the diet, potentially leading to deficiencies of certain micronutrients.
D. Simple sugars and disease
There is no direct evidence that the consumption of simple sugars is harmful. Contrary to folklore, diets high in sucrose do not lead to diabetes or hypoglycemia. Also contrary to popular belief, carbohydrates are not inherently fattening. They yield 4 kcal/g (the same as protein and less than one half that of fat; see Figure 27.5) and result in fat synthesis only when consumed in excess of the body’s energy needs. However, there is an association between sucrose consumption and dental caries, particularly in the absence of fluoride treatment.
Figure 27.18 Blood glucose concentrations following ingestion of food with low or high glycemic index.
VII. DIETARY PROTEIN
Humans have no dietary requirement for protein per se, but the protein in food does provide essential amino acids (see Figure 20.2, p. 262). Nine of the 20 amino acids needed for the synthesis of body proteins are essential (that is, they cannot be synthesized in humans).
A. Quality of proteins
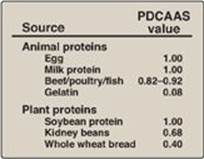
The quality of a dietary protein is a measure of its ability to provide the essential amino acids required for tissue maintenance. Most government agencies have adopted the Protein Digestibility–Corrected Amino Acid Score (PDCAAS) as the standard by which to evaluate protein quality. PDCAAS is based on the profile of essential amino acids after correcting for the digestibility of the protein. The highest possible score under these guidelines is 1.00. This amino acid score provides a method to balance intakes of poorer-quality proteins with high-quality dietary proteins.
1. Proteins from animal sources: Proteins from animal sources (meat, poultry, milk, and fish) have a high quality because they contain all the essential amino acids in proportions similar to those required for synthesis of human tissue proteins (Figure 27.19), and they are more readily digested. [Note: Gelatin prepared from animal collagen is an exception. It has a low biologic value as a result of deficiencies in several essential amino acids.]
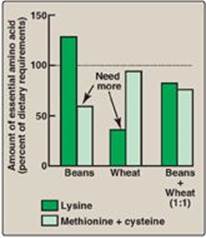
2. Proteins from plant sources: Proteins from plant sources have a lower quality than do animal proteins. However, proteins from different plant sources may be combined in such a way that the result is equivalent in nutritional value to animal protein. For example, wheat (lysine deficient but methionine rich) may be combined with kidney beans (methionine poor but lysine rich) to produce an improved biologic value. Therefore, eating foods with different amino acids during the day can result in a dietary combination with a higher biologic value than either of the component proteins (Figure 27.20). [Note: Animal proteins can also complement the biologic value of plant proteins.]
Figure 27.19 Relative quality of some common dietary proteins. PDCAAS = protein digestibility-corrected amino acid score.
B. Nitrogen balance
Nitrogen balance occurs when the amount of nitrogen consumed equals that of the nitrogen excreted in the urine (primarily as urinary urea nitrogen, or UUN), sweat, and feces. Most healthy adults are normally in nitrogen balance.
1. Positive nitrogen balance: This occurs when nitrogen intake exceeds nitrogen excretion. It is observed during situations in which tissue growth occurs, for example, in childhood, pregnancy, or during recovery from an emaciating illness.
2. Negative nitrogen balance: This occurs when nitrogen loss is greater than nitrogen intake. It is associated with inadequate dietary protein; lack of an essential amino acid; or during physiologic stresses, such as trauma, burns, illness, or surgery.
Nitrogen (N) balance can be determined by the formula, N balance = protein N intake (g/24 hrs) – (UUN + 4 g), where 4 g accounts for urinary loss in forms other than UUN plus loss in skin and feces. Alternatively, protein balance = protein intake (g/24 hrs) – [(UUN + 4 g) x 6.25] can be used because there are, on average, 6.25 g N in 1 g protein.
Figure 27.20 Combining two incomplete proteins that have complementary amino acid deficiencies results in a mixture with a higher biologic value.
C. Requirement for protein in humans
The amount of dietary protein required in the diet varies with its biologic value. The greater the proportion of animal protein included in the diet, the less protein is required. The RDA for protein is computed for proteins of mixed biologic value at 0.8 g/kg of body weight for adults, or about 56 g of protein for a 70-kg individual. People who exercise strenuously on a regular basis may benefit from extra protein to maintain muscle mass, and a daily intake of about 1 g/kg has been recommended for athletes. Women who are pregnant or lactating require up to 30 g/day in addition to their basal requirements. To support growth, infants should consume 2 g/kg/day.
1. Consumption of excess protein: There is no physiologic advantage to the consumption of more protein than the RDA. Protein consumed in excess of the body’s needs is deaminated, and the resulting carbon skeletons are metabolized to provide energy or acetyl coenzyme A for fatty acid synthesis. When excess protein is eliminated from the body as urinary nitrogen, it is often accompanied by increased urinary calcium, thereby increasing the risk of nephrolithiasis and osteoporosis.
2. The protein-sparing effect of carbohydrate: The dietary protein requirement is influenced by the carbohydrate content of the diet. When the intake of carbohydrates is low, amino acids are deaminated to provide carbon skeletons for the synthesis of glucose that is needed as a fuel by the central nervous system. If carbohydrate intake is less than 130 g/day, substantial amounts of protein are metabolized to provide precursors for gluconeogenesis. Therefore, carbohydrate is considered to be “protein-sparing,” because it allows amino acids to be used for repair and maintenance of tissue protein rather than for gluconeogenesis.
Figure 27.21 Features of protein-energy malnutrition in children.

D. Protein-energy (calorie) malnutrition
In developed countries, protein-energy malnutrition (PEM) is most commonly seen in patients with medical conditions that decrease appetite or alter how nutrients are digested or absorbed or in hospitalized patients with major trauma or infections. [Note: Such highly catabolic patients frequently require intravenous (parenteral) or tube-based (enteral) administration of nutrients.] PEM may also be seen in children or the elderly who are malnourished. In developing countries, an inadequate intake of protein and/or energy is the primary cause of PEM. Affected individuals show a variety of symptoms, including a depressed immune system with a reduced ability to resist infection. Death from secondary infection is common. PEM is a spectrum of degrees of malnutrition, and two extreme forms are kwashiorkor and marasmus (Figure 27.21). [Note: PEM is also referred to as protein-energy undernutrition (PEU).]
1. Kwashiorkor: Kwashiorkor occurs when protein deprivation is relatively greater than the reduction in total calories. Protein deprivation is associated with severely decreased synthesis of visceral protein. Kwashiorkor is commonly seen in developing countries in children after weaning at about age 1 year, when their diet consists predominantly of carbohydrates. Typical symptoms include stunted growth, skin lesions, depigmented hair, anorexia, enlarged fatty liver, edema, and decreased serum albumin concentration. Edema results from the lack of adequate blood proteins, primarily albumin, to maintain the distribution of water between blood and tissues. It may mask muscle loss. Therefore, chronic malnutrition is reflected in the level of serum albumin. [Note: Because caloric intake from carbohydrates may be adequate, insulin levels suppress lipolysis and proteolysis. Kwashiorkor is nonadapted malnutrition.]
Cachexia, a wasting disorder characterized by loss of appetite and muscle atrophy (with or without increased lipolysis) that cannot be reversed by conventional nutritional support, is seen with a number of chronic diseases, such as cancer and chronic pulmonary and renal disease. It is associated with decreased treatment tolerance and response and decreased survival time.
Figure 27.22 A. Listless child with kwashiorkor. Note the swollen belly.
B. Child suffering with marasmus.

2. Marasmus: Marasmus occurs when calorie deprivation is relatively greater than the reduction in protein. It usually occurs in developing countries in children younger than age 1 year when breast milk is supplemented with watery gruels of native cereals that are usually deficient in both protein and calories. Typical symptoms include arrested growth, extreme muscle wasting and loss of subcutaneous fat (emaciation), weakness, and anemia (Figure 27.22). Individuals with marasmus do not show the edema observed in kwashiorkor.
VIII. CHAPTER SUMMARY
The Dietary Reference Intakes (DRIs) provide estimates of the amounts of nutrients required to prevent deficiencies and maintain optimal health and growth. It consists of the Estimated Average Requirement (EAR), the average daily nutrient intake level estimated to meet the requirement of 50% of the healthy individuals in a particular life stage (age) and gender group; the Recommended Dietary Allowance (RDA), the average daily dietary intake level that is sufficient to meet the nutrient requirements of nearly all (97%–98%) individuals in a life stage and gender group; the Adequate Intake (AI), which is set instead of an RDA if sufficient scientific evidence is not available to calculate the RDA; and the Tolerable Upper Intake Level (UL), the highest average daily nutrient intake level that is likely to pose no risk of adverse health effects to almost all individuals in the general population. The energy generated by the metabolism of the macronutrients is used for three energy-requiring processes that occur in the body: resting metabolic rate, physical activity, and thermic effect of food. Acceptable Macronutrient Distribution Ranges (AMDR) are defined as the ranges of intake for a particular macronutrient that are associated with reduced risk of chronic disease while providing adequate amounts of essential nutrients. Adults should consume 45%–65% of their total calories from carbohydrates, 20%–35% from fat, and 10%–35% from protein (Figure 27.23). Elevated levels of cholesterol in low-density lipoproteins (LDL-C) result in increased risk for cardiovascular disease. In contrast, high levels of cholesterol in high-density lipoproteins (HDL-C) have been associated with a decreased risk for heart disease. Dietary or drug treatment of hypercholesterolemia is effective in decreasing LDL-C, increasing HDL-C, and reducing the risk for cardiovascular events. Consumption of saturated fats is strongly associated with high levels of total plasma and LDL-C. When substituted for saturated fatty acids in the diet, monounsaturated fats lower both total plasma cholesterol and LDL-C but maintain or increase HDL-C. Consumption of fats containing w-6 polyunsaturated fatty acidslowers plasma LDL-C, but HDL-C, which protects against coronary heart disease, is also lowered. Dietary w-3 polyunsaturated fats suppress cardiac arrhythmias and reduce serum triacylglycerols, decrease the tendency for thrombosis, and substantially reduce the risk of cardiovascular mortality. Carbohydrates provide energy and fiber to the diet. When they are consumed as part of a diet in which caloric intake is equal to energy expenditure, they do not promote obesity. Dietary protein provides essential amino acids. The quality of a protein is a measure of its ability to provide the essential amino acids required for tissue maintenance. Proteins from animal sources, in general, have a higher-quality protein than that derived from plants. However, proteins from different plant sources may be combined in such a way that the result is equivalent in nutritional value to animal protein. Positive nitrogen balance occurs when nitrogen intake exceeds nitrogen excretion. It is observed in situations in which tissue growth occurs, for example, in childhood, pregnancy, or during recovery from an emaciating illness. Negative nitrogen balance occurs when nitrogen losses are greater than nitrogen intake. It is associated with inadequate dietary protein; lack of an essential amino acid; or during physiologic stresses such as trauma, burns, illness, or surgery. Kwashiorkor occurs when protein deprivation is relatively greater than the reduction in total calories. It is characterized by edema. Marasmus occurs when calorie deprivation is relatively greater than the reduction in protein. Both are extreme forms of protein-energy malnutrition (PEM).
Study Questions
Choose the ONE best answer.
27.1 For the child shown at right, which of the statements is true and supports a diagnosis of kwashiorkor? The child:
A. appears plump due to increased deposition of fat in adipose tissue.
B. displays abdominal and peripheral edema.
C. has a serum albumin level above normal.
D. has markedly decreased weight for height.

The correct answer = B. Kwashiorkor is caused by inadequate protein intake in the presence of fair to good energy (calorie) intake. Typical findings in a patient with kwashiorkor include abdominal and peripheral edema (note the swollen belly and legs) caused largely by a decreased serum albumin concentration. Body fat stores are depleted, but weight for height can be normal. Treatment includes a diet adequate in calories and protein.
Figure 27.23 Key concept map for the macronutrients. *Note: Trans fatty acids are chemically classified as unsaturated. PEM = protein energy malnutrition; LDL = low-density lipoprotein; C = cholesterol.

27.2 Which one of the following statements concerning dietary fat is correct?
A. Coconut oil is rich in monounsaturated fats, and olive oil is rich in saturated fats.
B. Fatty acids containing trans double bonds, unlike the naturally occurring cis isomers, raise high-density lipoprotein cholesterol levels.
C. The polyunsaturated fatty acids linoleic and linolenic acids are required components.
D. Triacylglycerols obtained from plants generally contain less unsaturated fatty acids than those from animals.
Correct answer = C. We are unable to make linoleic and linolenic fatty acids. Consequently, these fatty acids are essential in the diet. Coconut oil is rich in saturated fats, and olive oil is rich in monounsaturated fats. Trans fatty acids raise plasma levels of low-density lipoprotein cholesterol, not high-density lipoprotein cholesterol. Triacylglycerols obtained from plants generally contain more unsaturated fatty acids than those from animals.
27.3 Given the information that a 70-kg man is consuming a daily average of 275 g of carbohydrate, 75 g of protein, and 65 g of fat, which one of the following conclusions can reasonably be drawn?
A. About 20% of calories are derived from fats.
B. The diet contains a sufficient amount of fiber.
C. The individual is in nitrogen balance.
D. The proportions of carbohydrate, protein, and fat in the diet conform to current recommendations.
E. The total energy intake per day is about 3,000 kcal.
Correct answer = D. The total energy intake is (275 g carbohydrate × 4 kcal/g) + (75 g protein × 4 kcal/g) + (65 g fat × 9 kcal/g) = 1,100 + 300 + 585 = 1,985 total kcal/day. The percentage calories from carbohydrate is 1,100/1,985 = 55, percentage calories from protein is 300/1,985 = 15, and percentage calories derived from fat is 585/1,985 = 30. These are very close to current recommendations. The amount of fiber or nitrogen balance cannot be deduced from the data presented. If the protein is of low biologic value, a negative nitrogen balance is possible.
For Questions 27.4 and 27.5:
A sedentary 50-year-old man weighing 80 kg (176 pounds) requests a physical. He denies any health problems. Routine blood analysis is unremarkable except for plasma total cholesterol of 295 mg/dl. (Reference value is less than 200 mg.) The man refuses drug therapy for his hypercholesterolemia. Analysis of a 1-day dietary recall showed the following:
|
Kilocalories |
3,475 kcal |
|
Protein |
102 g |
|
Carbohydrate |
383 g |
|
Fiber |
6 g |
|
Cholesterol |
822 mg |
|
Saturated fat |
69 g |
|
Total Fat |
165 g |
27.4 Decreasing which one of the following dietary components would have the greatest effect in lowering the patient’s plasma cholesterol?
A. Carbohydrate
B. Cholesterol
C. Fiber
D. Monounsaturated fat
E. Polyunsaturated fat
F. Saturated fat
Correct answer = F. The intake of saturated fat most strongly influences plasma cholesterol in this diet. The patient is consuming a high-calorie, high-fat diet with 40% of the fat as saturated fat. The most important dietary recommendations are lower total caloric intake, substitute monounsaturated and polyunsaturated fats for saturated fats, and increase dietary fiber. A decrease in dietary cholesterol would be helpful but is not a primary objective.
27.5 What would you need to know to estimate the total energy expenditure of the patient?
The daily basal energy expenditure (estimated resting metabolic rate/hour x 24 hours) and an activity factor (AF) based on the type and duration of physical activities are needed variables. An additional 10% would be added to account for the thermic effect of food. Note that if the patient were hospitalized, an injury factor (IF) would be included in the calculation, and the AF would be modified. Tables of AFs and IFs are available.