Harper’s Illustrated Biochemistry, 29th Edition (2012)
SECTION VI. Special Topics
Chapter 56. Clinical Biochemistry
Joe Varghese, MB BS, MD, Molly Jacob, MB BS, MD, PhD, & Robert K. Murray, MD, PhD
OBJECTIVES
After studying this chapter, you should be able to:
![]() Briefly describe the importance of biochemical tests in clinical medicine.
Briefly describe the importance of biochemical tests in clinical medicine.
![]() Discuss major considerations to be kept in mind when ordering and interpreting results of laboratory tests.
Discuss major considerations to be kept in mind when ordering and interpreting results of laboratory tests.
![]() Name and have a general understanding of the principal tests used to assess liver, kidney, thyroid, and adrenal function.
Name and have a general understanding of the principal tests used to assess liver, kidney, thyroid, and adrenal function.
IMPORTANCE OF LABORATORY TESTS IN CLINICAL MEDICINE
Laboratory (lab) tests play an important role in helping physicians and other healthcare workers make diagnoses and other clinical judgments. In this chapter, only biochemical tests (and not hematological, microbiological, immunological, or other types of tests) are discussed, with a few exceptions. In addition, only a brief overview of this subject is presented; medical students will receive much further coverage as they progress through the years of their medical education.
Lab tests constitute only one part of the diagnostic process in clinical medicine. In fact, it has been stated that an experienced physician may arrive at a relatively accurate diagnosis in ~80% of cases, based solely on a thorough history and physical examination; some may, however, doubt the validity of this statement. However, there is no doubt that, nowadays, biochemical and other lab tests are almost always an important part of the overall diagnostic process. The use of biochemical investigations and lab tests is, however, not confined to diagnoses of diseases. Table 56-1 summarizes some of the different uses of biochemical tests, with examples for each.
TABLE 56–1 Major Uses of Biochemical Tests with Selected Examples for Each
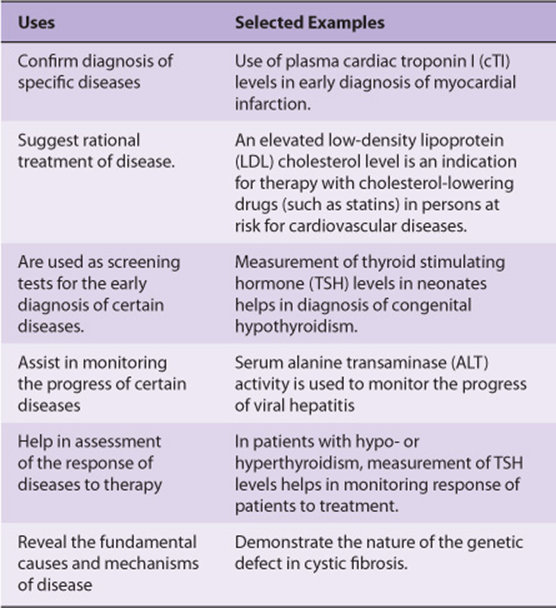
Two important questions that one should answer prior to ordering any lab investigation are: “What useful information will I get by ordering this test?” and “Will it help the patient?” The concepts discussed in this chapter will contribute to answering these questions and help one make wise use of lab tests in the management of patients.
CAUSES OF ABNORMALITIES IN LEVELS OF ANALYTES MEASURED IN THE LABORATORY
A myriad of conditions and disorders can lead to abnormalities of levels of various molecules (analytes) measured in clinical labs. Some of these are listed in Table 56-2.
TABLE 56–2 Common Causes for Abnormalities in Analytes Measured in Clinical Labs
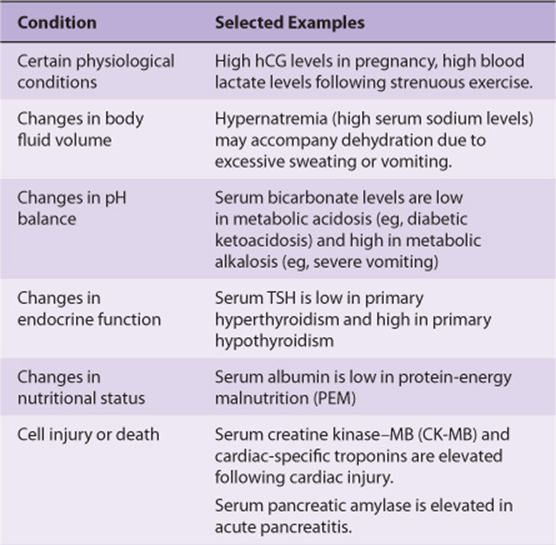
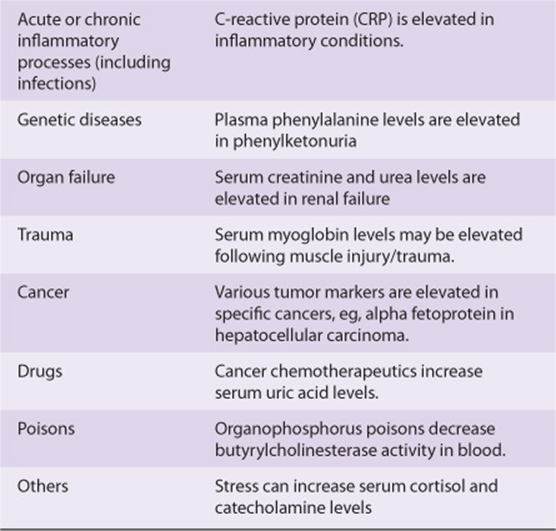
It is clear from this Table that conditions that cause abnormal levels of analytes are diverse. For instance, when tissue injury occurs, it results in damage to cell membranes and an increase in the permeability of the plasma membrane of affected cells. This leads to leakage of intracellular molecules into the blood (eg, leakage of troponins into blood following a myocardial infarction), causing their blood levels to increase. In other cases, the synthesis of certain molecules is increased or decreased (eg, C-reactive protein [CRP] in inflammatory states or specific hormones in certain endocrine disorders). Kidney and liver failure lead to the accumulation of a number of molecules (eg, creatinine and ammonia respectively) in the blood, due to an inability of the organ concerned to excrete or metabolize the analyte concerned.
VALIDITY OF LABORATORY RESULTS
Good diagnostic labs are subject to inspection and regulatory procedures on a regular basis. These assess the validity of their results and ensure quality control of their reports. Such measures will ensure that the value of the concentration, activity, or amount of a substance in a specimen reported from a clinical lab represents the best value obtainable with the method, reagents and instruments used and technical personnel involved in obtaining and processing the specimen. In addition, it is important for medical personnel to possess basic knowledge about the validity of lab results and their interpretation. It is also good practice to visit labs and to discuss, with appropriate lab personnel, questions, and problems that may arise with regard to values of lab results.
Accuracy is the degree of agreement of an estimated value of an analyte with the “true” value of the analyte in the sample. Precision denotes the reproducibility of an analysis and is the ability of the method used to consistently produce the same value when an analyte in a sample is repeatedly measured. It is expressed as the variation seen when these repeated measurements of the analyte are done. Precision is not absolute, but is subject to variation inherent in the complexity of the method used, the stability of reagents, the accuracy of the primary standard used, the sophistication of the equipment used for the assay and the skill of the technical personnel involved. Each lab should maintain data on precision (reproducibility) that can be expressed statistically in terms of the standard deviation (SD) from the mean value obtained by repeated analyses of the same sample.
For example, the precision in determination of cholesterol in serum in a good lab may be the mean value of repeated estimations with a SD of 5 mg/dL. The 95% confidence limits for this assay are ± 2 SD or ±10 mg/dL. This means that any value reported is “accurate” within a range of 20 mg/dL. Therefore, a reported value of 200 mg/dL signifies that, in 95% of cases, the true value lies between 190 and 210 mg/dL. Similarly, for the determination of serum potassium levels in a specimen, a SD of ± 0.1 mmol/L indicates that the 95% confidence limit of ± 2SD for this assay is ± 0.2 mmol/L. Thus, a potassium value of 5.5 mmol/L indicates that, in 95% of cases, the true value lies in the range 5.3-5.7 mmol/L. Values of 5.3 and 5.7 mmol/L may be obtained on repeated analysis of the sample and will still be within the limits of precision of the test.
ASSESSMENT OF VALIDITY OF A LAB TEST
The clinical value of a lab test depends on its specificity, sensitivity, and the prevalence of the disease in the population tested.
Sensitivity is the percentage of positive results in patients with the disease. Ideally, a test should have 100% sensitivity. However, this is seldom attained. For example, the carcinoembryonic antigen (CEA) test has a lower than ideal sensitivity; only 72% of those with carcinoma of the colon test positive when the disease is extensive, and only 20% test positive when they have early disease. Lab tests often have lower sensitivity in the early stages of many diseases, in contrast to their higher sensitivity in well-established disease. In biochemical analysis, sensitivity refers to the ability of the method to detect small changes in the levels of the analyte. The lowest concentration of the analyte that can reliably be detected is called the limit of detection. Usually, a highly sensitive test will have a very low limit of detection.
Specificity refers to the percentage of negative results among people who do not have the disease. Ideally, tests should be 100% specific. The CEA test for carcinoma of the colon has a variable specificity; about 3% of non-smoking individuals give a false-positive result (97% specificity), whereas 20% of smokers give a false-positive result (80% specificity). In biochemical analysis, specificity may also indicate if substances or factors other than the one being measured influence the assay in any way (positive or negative interference).
The predictive value of a positive test (positive predictive value) defines the percentage of positive results that are true positives. Similarly, the predictive value of a negative test (negative predictive value) defines the percentage of negative results that are true negatives. This is related to the prevalence of the disease. For example, in a group of patients in a urology ward, the prevalence of renal disease is higher than in the general population. In this group, the level of serum creatinine will have a higher predictive value than in the general population. Formulae for calculating sensitivity, specificity, and predictive values of a diagnostic test are shown in Table 56-3.
TABLE 56–3 Two-By-Two Table Illustrating Concepts of Sensitivity, Specificity and Predictive Values
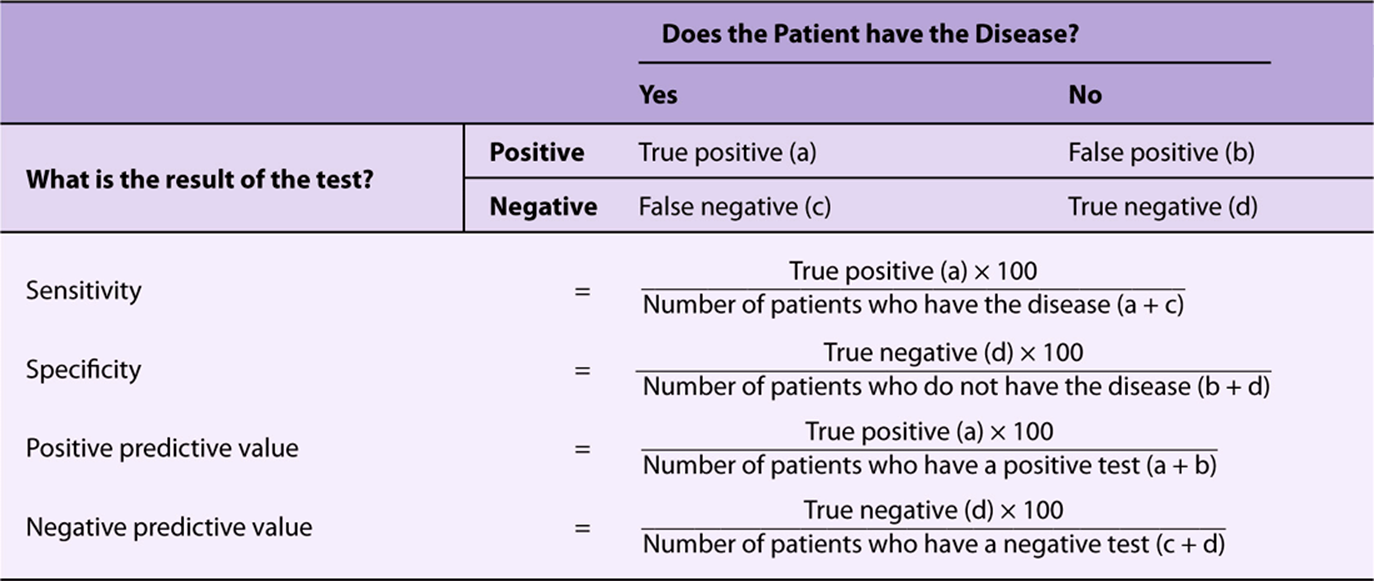
An ideal diagnostic test is one that has 100% sensitivity and 100% specificity. However, this is not true for most, if not all, tests available nowadays. Before ordering a test, it is important to attempt to determine whether the sensitivity, specificity, and predictive value of the test are adequate to provide useful information. The result obtained should influence diagnosis, prognosis, or therapy or lead to a better understanding of the disease process and benefit the patient.
VARIABLES THAT AFFECT VALUES OF ANALYSIS
Apart from age and sex, many other factors (called preanalytical variables) may affect values of analytes and influence their normal ranges. These include race, environment, posture (supine vs. sitting), diurnal and other cyclic variations, pregnancy, fasting or postprandial state, foods eaten, drugs, and level of exercise. For example, it is important to take a blood sample for analysis of triglycerides after fasting for 12 h. It is also always important to ask a patient if he/she is on any medications.
Values of analytes may also be influenced by the method of collection of the specimen. Inaccurate collection of urine over a 24-h period, hemolysis of a blood sample, addition of an inappropriate anticoagulant, and contaminated glassware or other apparatus are other examples of pre-analytical errors that may occur.
Errors may also be associated with the analysis of samples. Random errors are those errors that are not easily identified and are commonly associated with manual assays. Automation of analysis can significantly lower random errors. On the other hand, systematic errors are errors inherently associated with the method of analysis and result in inaccurate results. These can often be identified and corrected if quality control procedures are adequately followed.
INTERPRETATION OF LAB TESTS
Normal values are generally considered to be those that fall within 2 standard deviations (SD) (± 2 SD) of the mean value for a healthy population. This span of values constitutes a reference range, which is constructed from results for an analyte obtained from a particular population (say, healthy male adults, 20-50 years of age). Other reference ranges are constructed and used for the same analyte for other healthy populations, such as adult females, neonates, infants, adolescents, and elderly subjects. These ranges usually encompass 95% of the selected population. Normal or reference ranges vary with the method employed, the analytical instrument used, and conditions of collection and preservation of specimens. The normal ranges established by individual labs should be clearly expressed to ensure proper interpretation of results of lab tests.
Interpretation of lab results must always be related to the condition of the patient. A low value may be the result of a deficit, or of dilution of the substance measured (eg, low serum sodium). Deviation from normal may be associated with a specific disease, or with some drug consumed by the subject. For example, elevated levels of uric acid may occur in patients with gout or be due to treatment with certain diuretics or with anticancer drugs.
The role of a clinician in assessing the probability of disease in the individuals tested cannot be overemphasized. There needs to be a reasonable certainty about the presence or absence of a disease before a surrogate marker for the disease is checked for. This will ensure most optimal interpretation of test results. Whenever an unusual or unexpected result is obtained, one may wish to consult a clinical biochemist before initiating any treatment based on the result, to ensure that no pre-analytical error has occurred. If no such error is detected, the test should be repeated to rule out an analytical mistake.
THE REALITY OF LABORATORY TESTS—A PERSPECTIVE ON THEIR USE
One must always keep in mind that laboratory tests serve as surrogate markers for tissue pathology. They do not provide definitive evidence of such pathology and hence should not be used as the sole means by which a diagnosis is made on a patient. Information obtained from laboratory tests needs to be combined with a clinical history and data from other investigations to arrive at a diagnostic decision. The results of many diagnostic tests used in clinical practice are often categorized as positive or negative. This makes for mathematical and clinical convenience; however, such dichotomous categorizations may not represent clinical reality, as states of disease often lie on a spectrum, and such rigid demarcations can lead to errors in diagnosis.
AUTOMATION OF LABORATORY TESTS
Most modern clinical laboratories use a high degree of automation. Automated analyzers improve efficiency and reduce random errors that are invariably associated with manual methods. The pre-analytical phase of laboratory testing (eg, sample processing and transport) may also be automated, thus reducing the lag time between collection of the sample and analysis.
ORGAN FUNCTION TESTS
Tests that provide information on the functioning of particular organs are often grouped together as organ function tests and are sometimes ordered together by a clinician. Commonly done organ function tests are briefly discussed below.
Liver Function Tests (LFTs)
Liver function tests (LFTs) are a group of tests that help in diagnosis, monitoring therapy, and assessing prognosis of liver disease. Major tests in this category are listed in Table 56-4. Each test assesses a specific aspect of liver function. Increases in serum bilirubin levels occur due to many causes and result in jaundice. Low levels of total serum protein and albumin are seen in chronic hepatic disorders, such as cirrhosis. Prothrombin time (PT) may be prolonged in acute disorders of the liver due to impaired synthesis of coagulation factors.
TABLE 56–4 Important Liver Function Tests
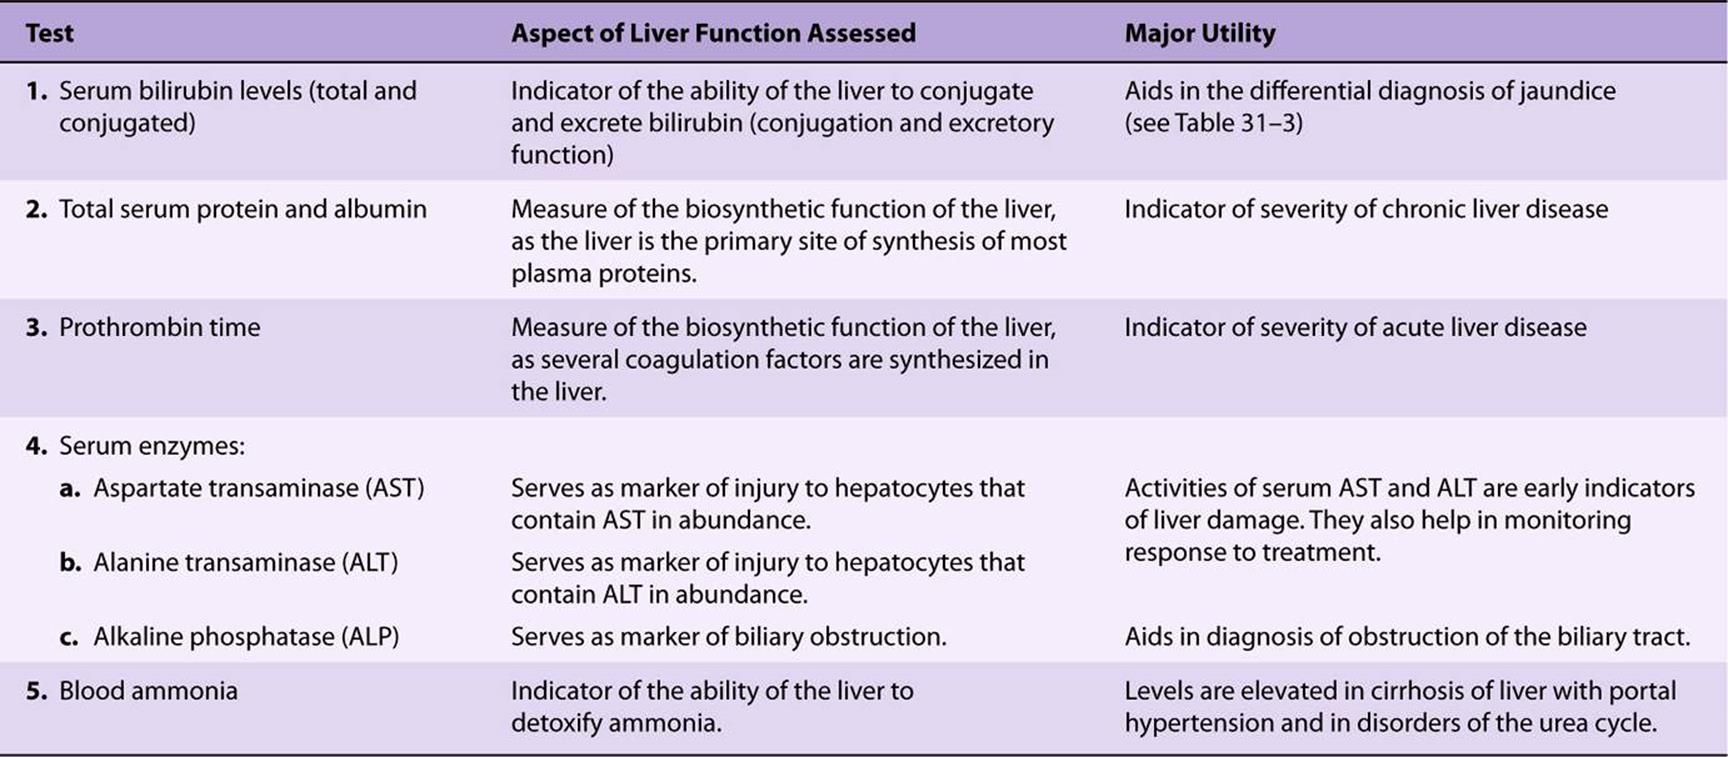
Activities of serum alanine aminotransferase (ALT) and aspartate aminotransferase (AST) are significantly elevated several days before the onset of jaundice in acute viral hepatitis. ALT is considered to be more specific for the liver than AST, as the latter may be elevated in cases of cardiac or skeletal muscle injury while the former is not. Serum alkaline phosphatase (ALP) activity is elevated in obstructive jaundice. A high activity of serum ALP may also be seen in bone diseases.
The liver is also the primary site of detoxification of ammonia (in the urea cycle). Elevation of blood ammonia levels is an important sign of liver failure and plays an important role in the pathogenesis of hepatic encephalopathy in patients with liver cirrhosis and portal hypertension. Blood ammonia levels are also elevated in disorders of the urea cycle.
The albumin:globulin ratio (A:G ratio) often provides useful clinical information. The normal ratio varies from 1.2:1 to 1.6:1. A reversal of the A:G ratio may be seen in conditions where the albumin levels are low (hypoalbuminemia) or where globulins are abnormally high, eg, multiple myeloma. Reversal of the A:G ratio is often the first investigation that raises suspicion of multiple myeloma.
Renal Function Tests
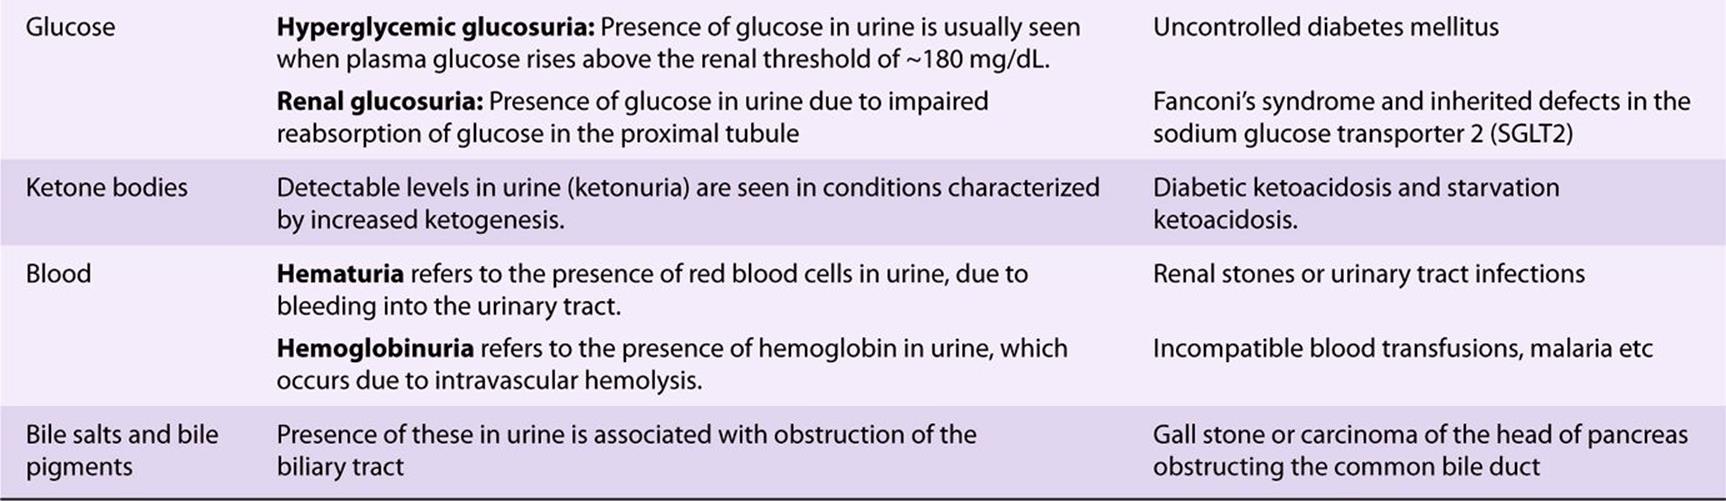
The major renal function tests are listed in Table 56-5. A complete urine analysis (urinalysis) provides valuable information on renal function. It includes assessment of the physical and chemical characteristics of urine. The physical characteristics to be assessed include urine volume (this requires a timed urine sample, usually 24 h), odor, color, appearance (clear or turbid), specific gravity, and pH. Protein, glucose, blood, ketone bodies, bile salts, and bile pigments are abnormal constituents of urine, that appear in different disease conditions (Table 56-6). Most of these parameters can now be estimated semiquantitatively at the bedside using disposable “dipstick” strips.Dipsticks are plastic strips on which specific chemicals are impregnated. When the portion of the strip that contains the chemicals is dipped into a sample of urine, they react with specific constituents of urine to produce a color change that is proportional to the concentration of that substance in the sample of urine.
TABLE 56–5 Major Renal Function Tests
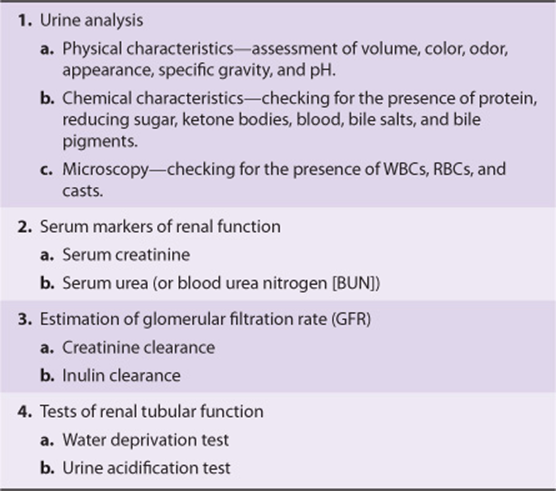
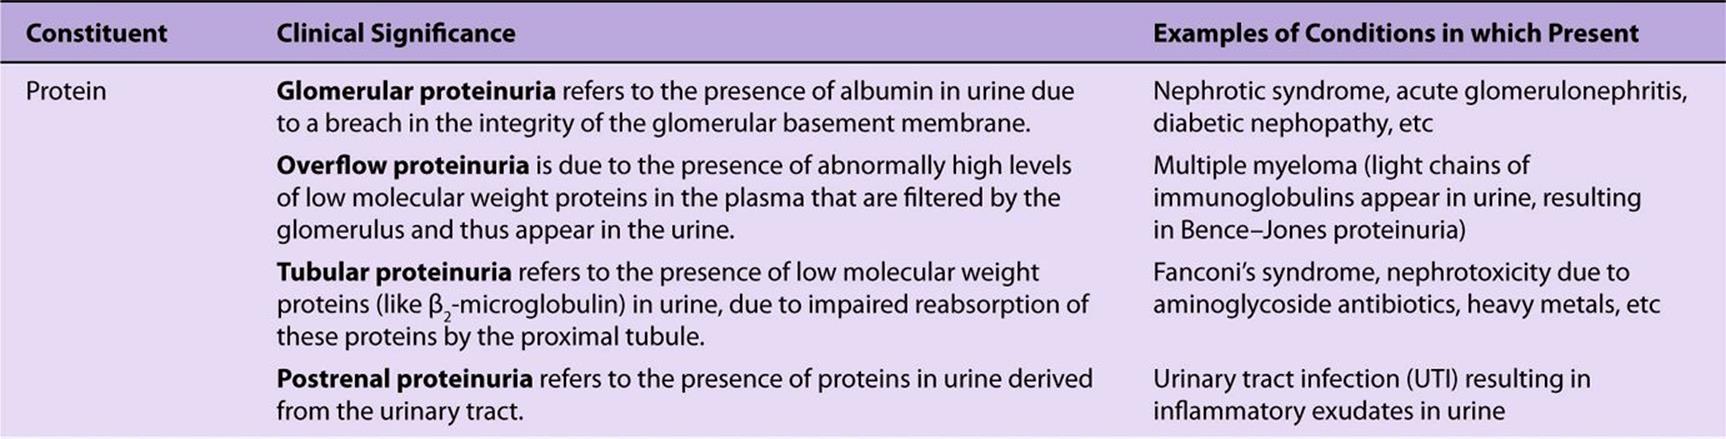
TABLE 56–6 Some Abnormal Constituents of Urine
Serum urea and creatinine are markers of renal function (see Table 56-5). Both these substances are primarily excreted in the urine. Deterioration of renal function is, therefore, associated with increases in the serum levels of these substances. Creatinine is considered a better marker of renal function than urea because its blood level is not significantly affected by non-renal factors, thus making it a specific indicator of renal function. A number of “pre-renal” factors (dietary protein intake, renal perfusion, etc) and “post-renal” factors significantly increase blood urea levels.
Normally, the total amount of protein excreted in urine over 24 h is less than 150 mg (and less than 30 mg of albumin) and is not detectable by routine tests. The presence of protein in urine in excess of this is referred to as proteinuria. Proteinuria is an important sign of renal disease. The most common cause of proteinuria is loss of integrity of the glomerular basement membrane (glomerular proteinuria), as seen in nephrotic syndrome and diabetic nephropathy. As listed in Table 56-6, other causes of proteinuria also occur (overflow, tubular and postrenal). The major protein found in glomerular proteinuria is albumin, which is the hallmark of this condition. Microalbuminuria is defined as the presence of 30-300 mg of albumin in a 24-h urine collection. It is considered to be an early and independent predictor of renal damage and cardiovascular mortality in diabetes mellitus.
Even though serum creatinine is considered a specific marker of renal function, a significant increase in its blood level is seen only after a ~50% decline in the glomerular filtration rate (GFR) has occurred. It is therefore a test of poor sensitivity. Measurement of creatinine clearance, on the other hand, which gives an estimate of the GFR, helps in early detection of renal failure. Clearance refers to the volume of plasma from which a particular substance is completely cleared by the kidney in unit time (usually a minute). It is calculated by the formula
![]()
where U = concentration of the measured analyte in a timed sample of urine (usually 24 h), P = plasma concentration of the analyte, and V = volume of urine produced per minute (calculated by dividing the value for the volume of urine collected over 24 h by 1440 [24 × 60]).
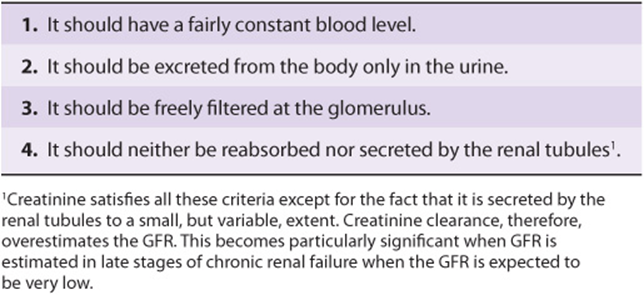
Inulin clearance is considered the gold standard method for measuring GFR, as it satisfies all the criteria essential for a substance to be used in clearance tests (Table 56-7). However, creatinine clearance is widely used due to the ease of estimation of creatinine (by Jaffe’s method) and the fact that it is an endogenous substance (as opposed to inulin, which is exogenous in origin and has to be infused intravenously at a constant rate).
TABLE 56–7 Characteristics of an Ideal Substance to be Used for Clearance Tests
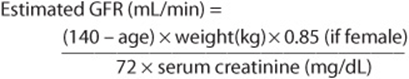
An important drawback associated with the use of clearance tests to estimate GFR is the need for an accurately timed urine sample. However, this problem can be overcome by employing formulae, which can be used to calculate an estimated value for GFR (EGFR), using serum creatinine values alone by correcting for age, sex, and body weight. One such formula is the Cockcroft-Gault formula, shown below.
Thyroid Function Tests
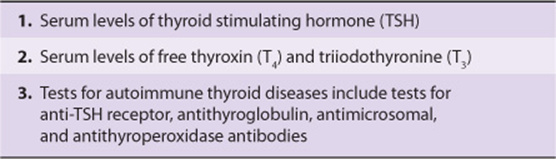
The thyroid gland secretes the thyroid hormones—thyroxine or tetraiodothyronine (T4) and triiodothyronine (T3). Clinical conditions associated with increased or decreased synthesis of thyroid hormones (hyperthyroidism and hypothyroidism respectively) occur commonly. A clinical diagnosis of a thyroid disorder is confirmed with the help of thyroid function tests. The main thyroid function tests commonly done in clinical practice are shown in Table 56-8.
TABLE 56-8 Major Thyroid Function Tests
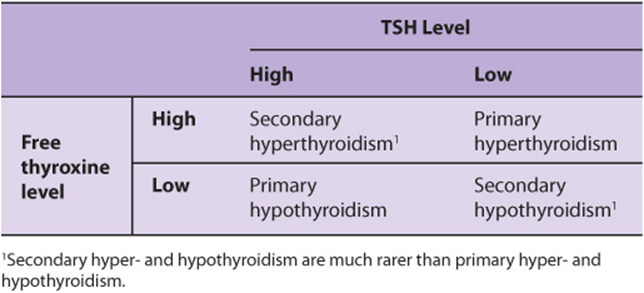
Measurement of thyroid stimulating hormone (TSH) is often the first test done in the assessment of thyroid function (also see Case 11, Chapter 57). The serum concentration of TSH is high in primary hypothyroidism and low or undetectable in primary hyperthyroidism. Measurement of free thyroxine levels will help establish the diagnosis in most cases where an abnormal TSH value is obtained (Table 56-9). This strategy has proven to be cost-effective and clinically efficient in the diagnosis of thyroid disorders.
TABLE 56–9 Lab Diagnoses of Thyroid Disorders
Serum levels of total thyroxine are seldom measured nowadays, as reliable assays to measure free thyroxine are now available commercially. Levels of total thyroxine are affected by changes in levels of thyroid-binding globulin (TBG), in the absence of thyroid disease. Additional tests such as measurement of thyroid auto-antibodies can be done to diagnose specific diseases related to the thyroid. For example, Graves’ disease is commonly associated with the presence of anti-TSH receptor antibodies, while autoimmune thyroiditis (Hashimoto’s thyroiditis) is associated with the presence of antithyroid peroxidase (antimicrosomal) antibodies.
Adrenal Function Tests
A clinical diagnosis of adrenal hyperfunction (Cushing’s syndrome) or hypofunction (Addison’s disease) is confirmed by adrenal function tests. The commonly used tests for this purpose are listed in Table 56-10.
TABLE 56–10 Commonly Used Adrenal Function Tests
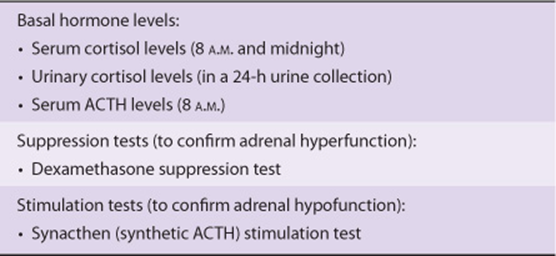
Secretion of cortisol from the adrenal gland shows a regular diurnal variation. Serum cortisol levels are highest during the early hours of morning and least at midnight. Loss of diurnal variation is one of the earliest signs of adrenal hyperfunction. Estimations of serum cortisol in blood samples drawn at 8 A.M. and at midnight are, therefore, useful as screening tests. A diagnosis of adrenal hyperfunction is confirmed by demonstration of failure of suppression of 8 A.M. cortisol levels following administration of 1 mg dexamethasone (a potent synthetic glucocorticoid) at midnight (dexamethasone suppression test). Measurement of adrenocorticotropic hormone (ACTH) can help differentiate hypercortisolism due excessive ACTH production (ACTH-dependent) from those where ACTH production is normal or suppressed (ACTH-independent). Failure to increase serum cortisol levels following a single dose of synacthen (a synthetic analogue of ACTH) is diagnostic of adrenal hypofunction (Synacthen stimulation test). Additional biochemical tests and imaging techniques (CT or MRI scan) may be required to diagnose the exact cause of adrenal hyper-or hypo-function.
Table 56-11 lists the principal biochemical laboratory tests that are performed in many hospitals.
TABLE 56–11 Reference Values for Selected Biochemical Laboratory Tests1
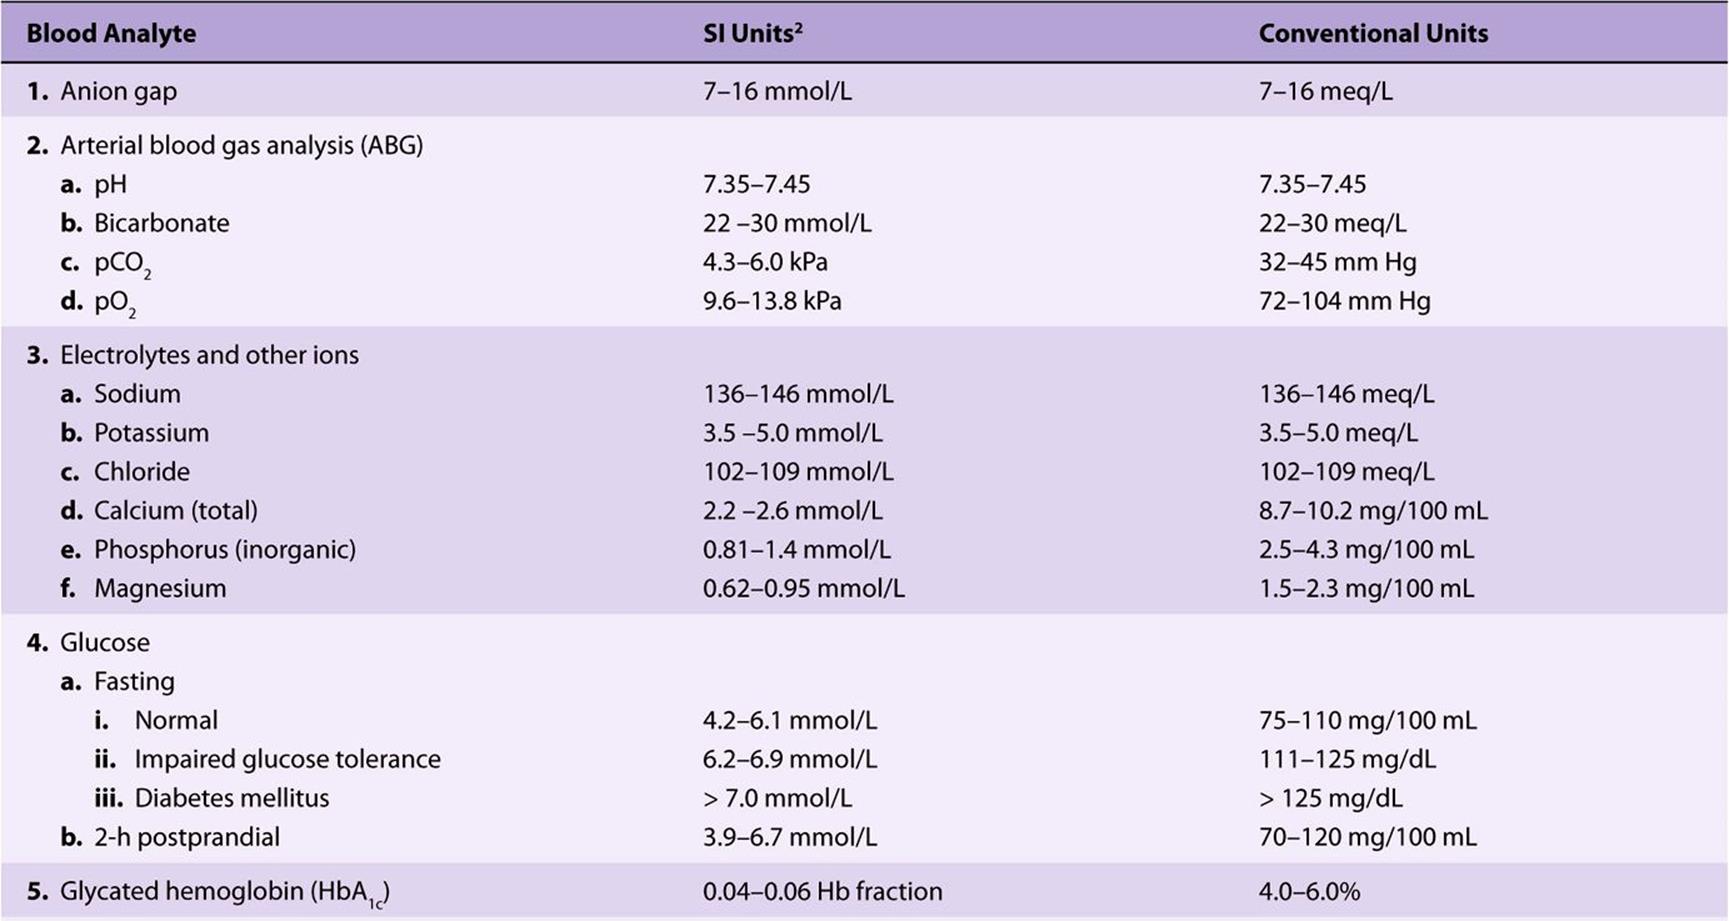
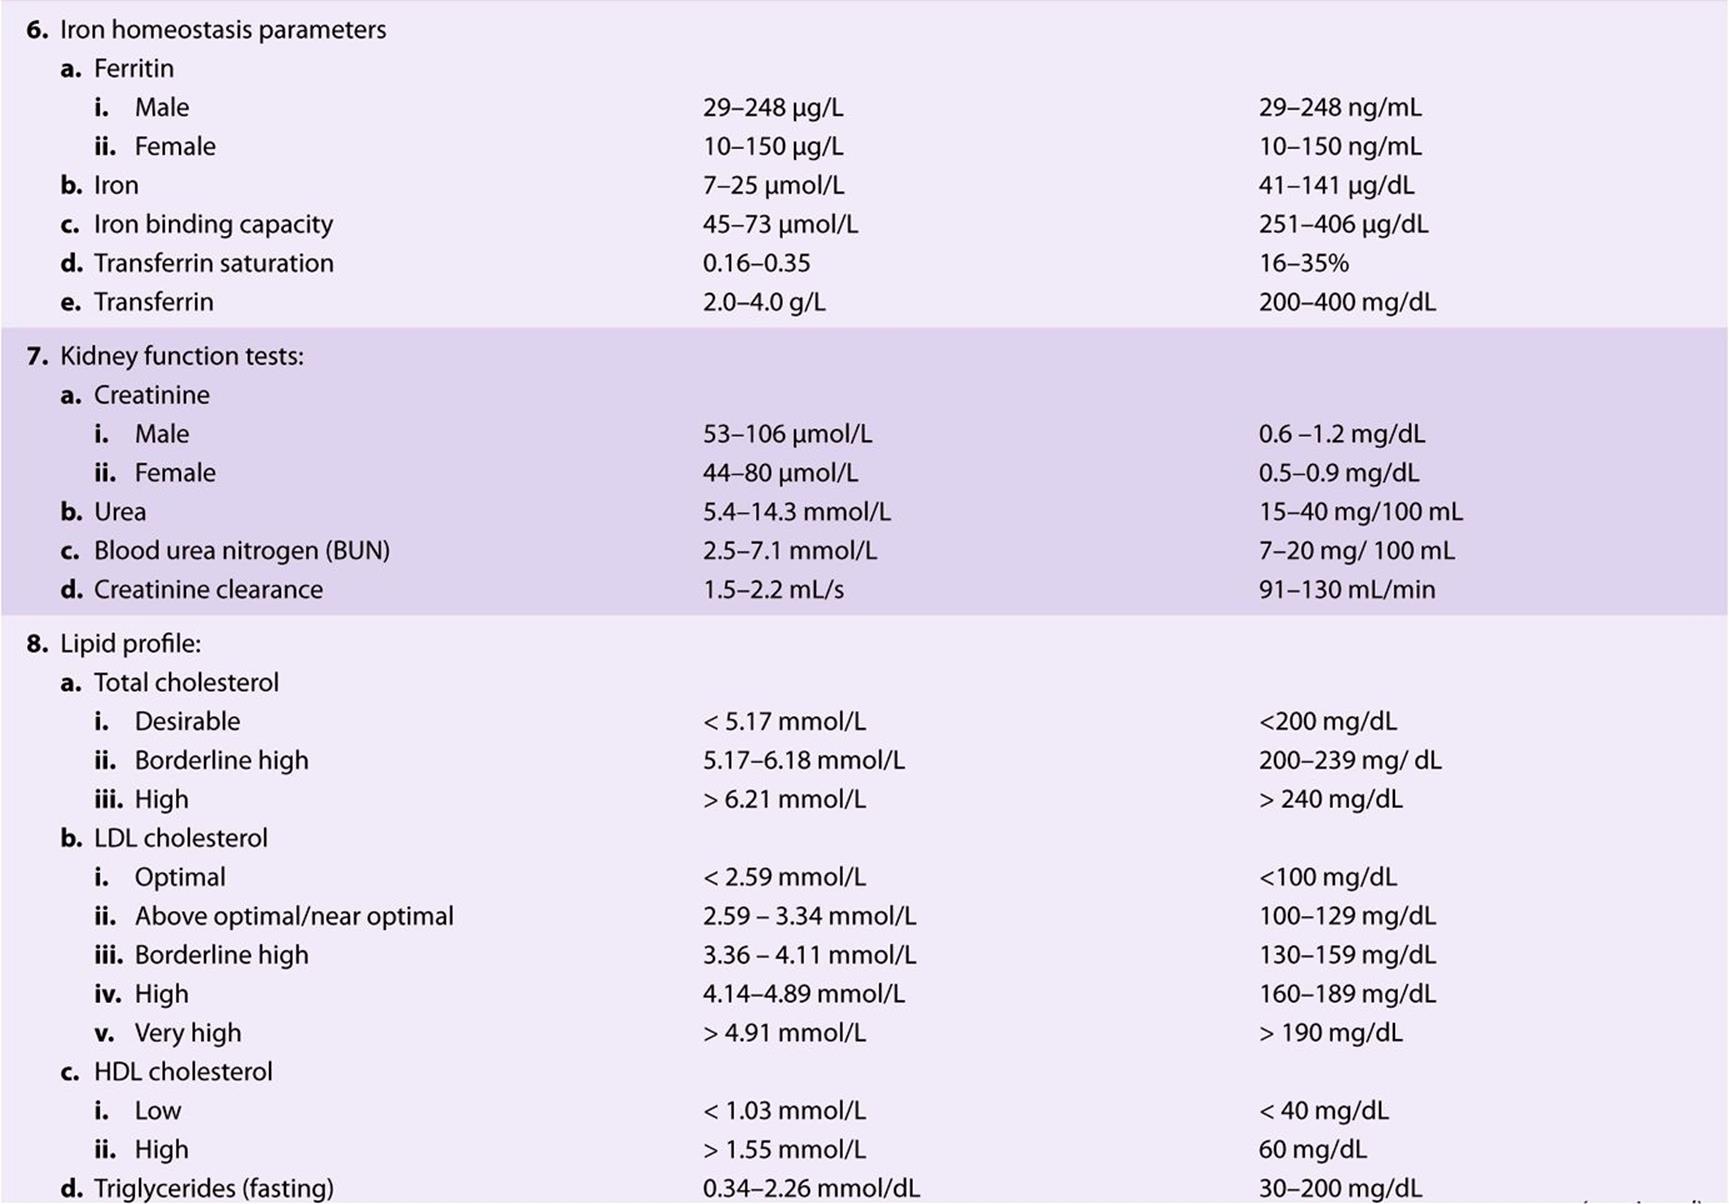
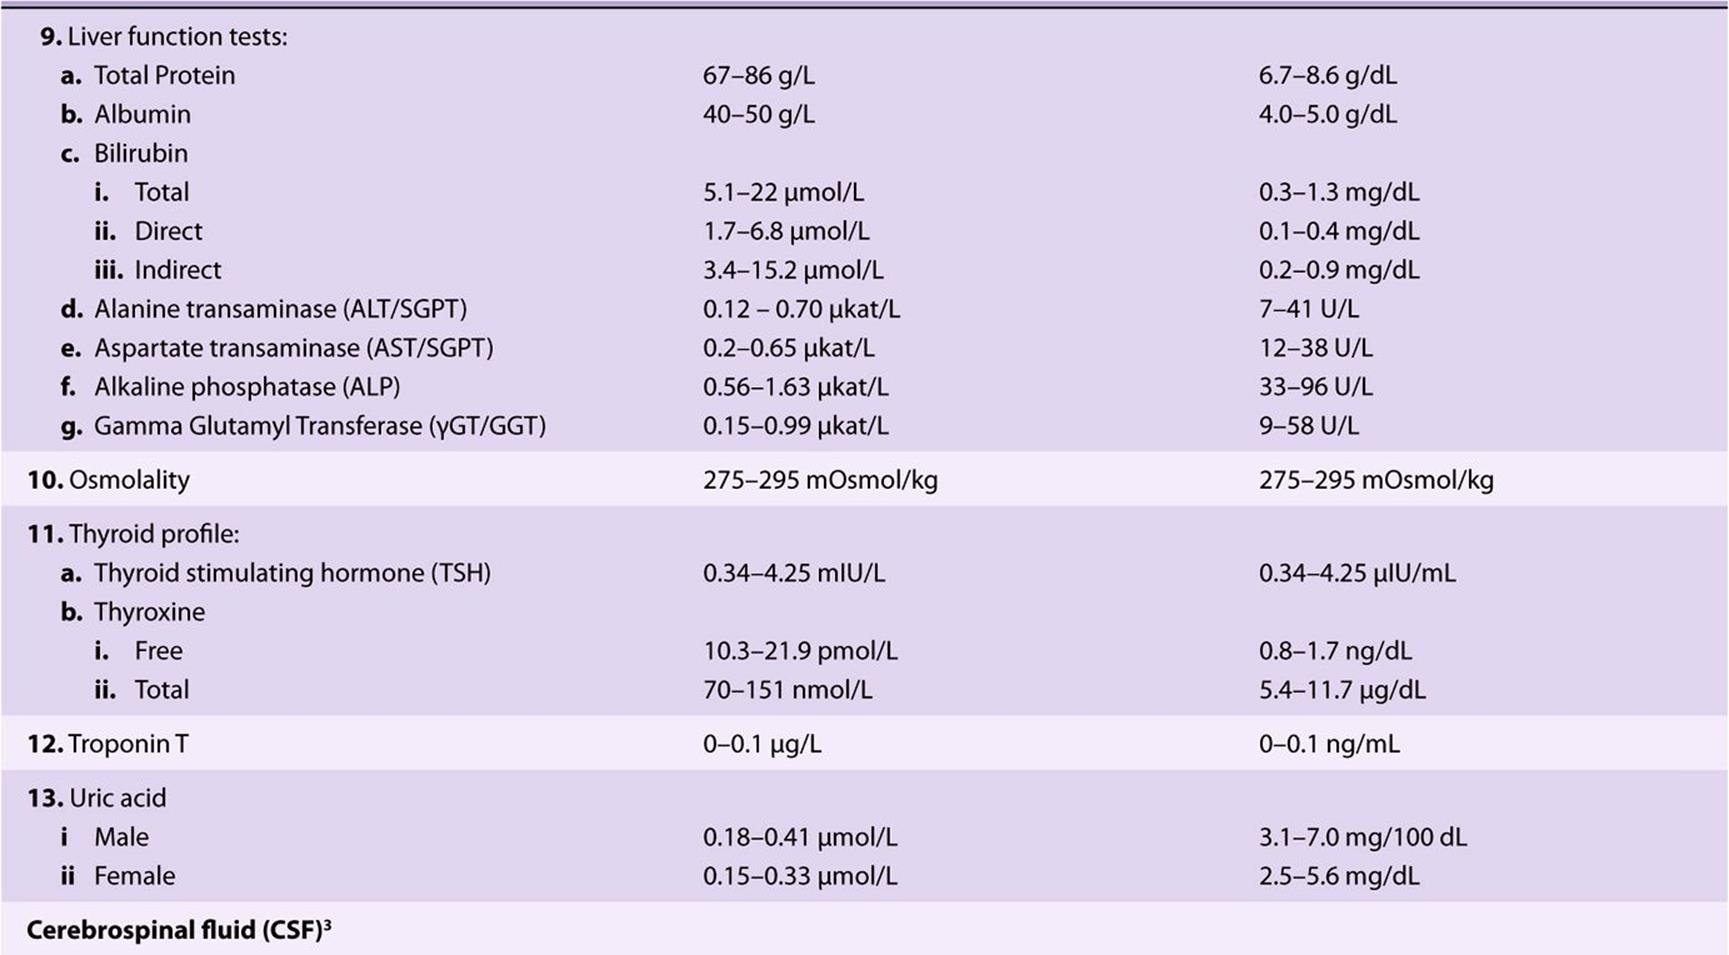
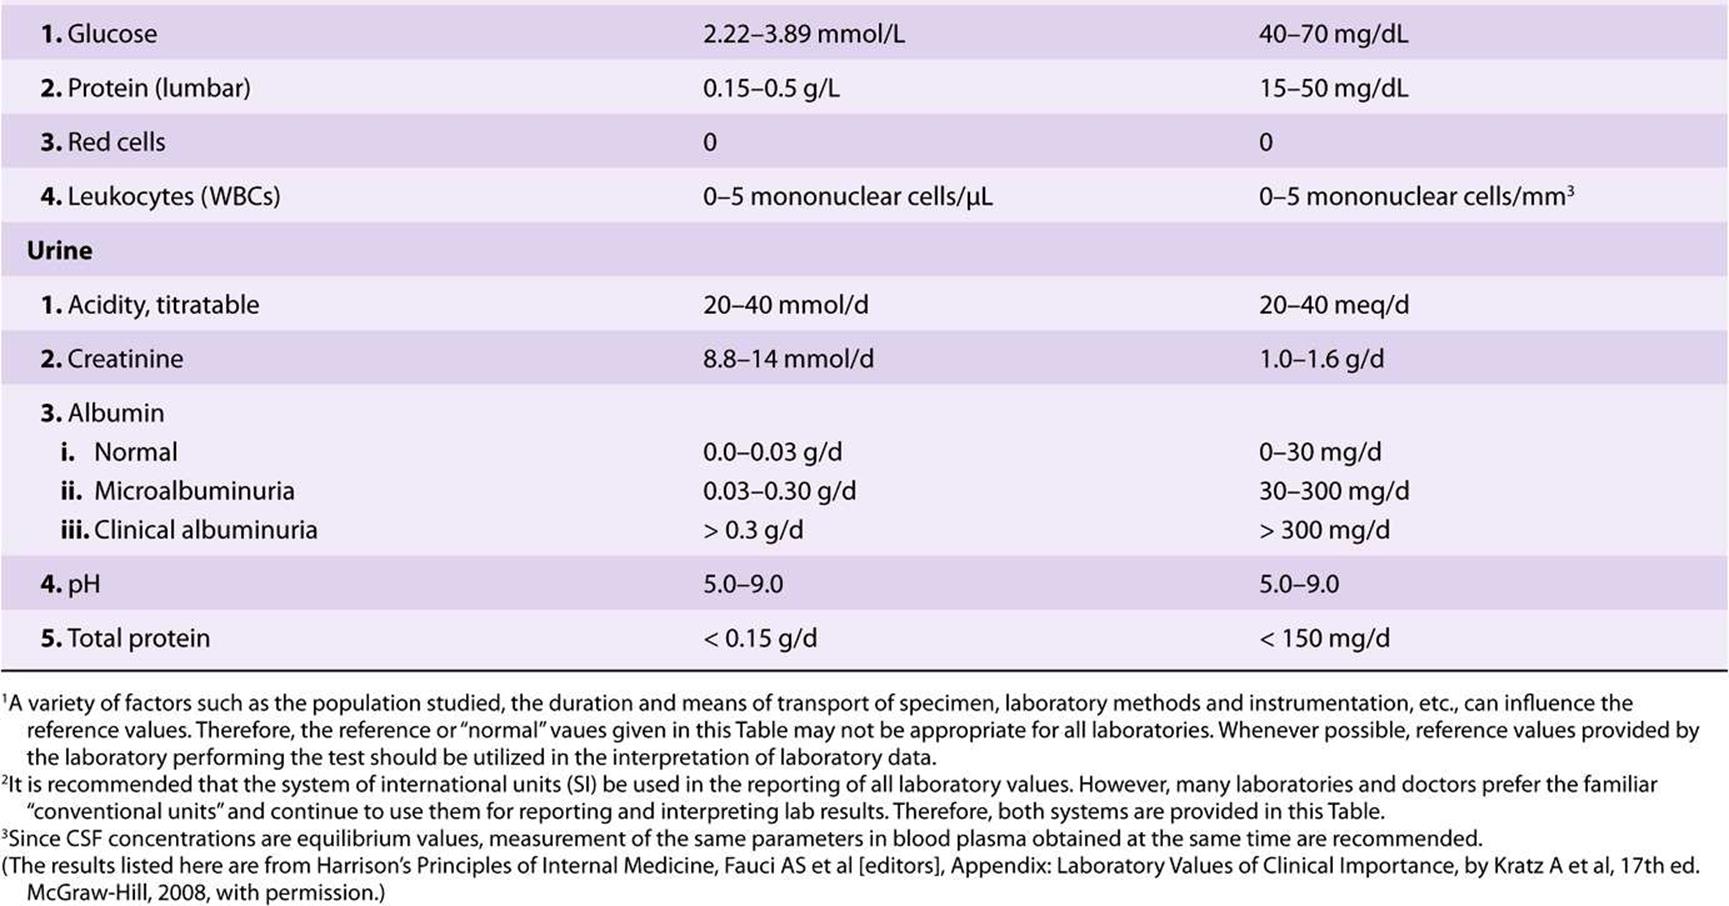
There are numerous other biochemical tests that have been developed, but many of them are only available in large regional hospital laboratories
SUMMARY
![]() Any laboratory investigation that is ordered should provide useful information for the diagnosis, prognosis, and management of the patient and should be directly beneficial to the patient.
Any laboratory investigation that is ordered should provide useful information for the diagnosis, prognosis, and management of the patient and should be directly beneficial to the patient.
![]() A good lab test should be accurate and precise. Accuracy refers to the degree of agreement with the “true” value. Precision refers to the reproducibility of the analysis.
A good lab test should be accurate and precise. Accuracy refers to the degree of agreement with the “true” value. Precision refers to the reproducibility of the analysis.
![]() While interpreting results of a test, one should be aware of the sensitivity, specificity and predictive value of the test. Sensitivity refers to the percentage of positive results in patients with the disease. Specificity is the percentage of negative results among people who do not have the disease. Positive predictive value refers to the percentage of positive results that are true positives. Diagnostic tests should be highly sensitive and specific.
While interpreting results of a test, one should be aware of the sensitivity, specificity and predictive value of the test. Sensitivity refers to the percentage of positive results in patients with the disease. Specificity is the percentage of negative results among people who do not have the disease. Positive predictive value refers to the percentage of positive results that are true positives. Diagnostic tests should be highly sensitive and specific.
![]() Several preanalytical variables can significantly affect the results of measurement of biochemical analytes. These factors need to be kept in mind while ordering and interpreting the results of a test.
Several preanalytical variables can significantly affect the results of measurement of biochemical analytes. These factors need to be kept in mind while ordering and interpreting the results of a test.
![]() A high degree of automation is employed in most clinical laboratories for the analysis of routine tests.
A high degree of automation is employed in most clinical laboratories for the analysis of routine tests.
![]() Tests that provide information on the functioning of particular organs are often grouped together as organ function tests
Tests that provide information on the functioning of particular organs are often grouped together as organ function tests
![]() Creatinine clearance provides useful information on the glomerular filtration rate and is therefore an important renal function test.
Creatinine clearance provides useful information on the glomerular filtration rate and is therefore an important renal function test.
![]() Measurement of TSH, using an accurate and sensitive immunoassay, is often the first test done in the assessment of thyroid function. High levels are seen in primary hypothyroidism and low levels in primary hyperthyroidism.
Measurement of TSH, using an accurate and sensitive immunoassay, is often the first test done in the assessment of thyroid function. High levels are seen in primary hypothyroidism and low levels in primary hyperthyroidism.
REFERENCES
Beckett G, Walker S, Rae P, Ashby P: Clinical Biochemistry. 8th ed. Wiley-Blackwell, 2010.
Bishop ML, Fody EP, Schoeff LE: Clinical Chemistry Techniques, Principles, Correlations. 6th ed. Wolters Kluwer, Lippincott Williams & Wilkins, 2010.
Burtis CA, Ashwood ER, Bruns DE (editors): Tietz Textbook of Clinical Chemistry and Molecular Diagnostics. 4th ed. Elsevier Saunders, 2006.
Gaw A, Murphy MJ, Cowan RA, et al: Clinical Biochemistry. 4th ed. Churchill Livingstone, 2008.
Kratz A, Pesce MA, Fink DJ: Appendix: Laboratory Values of Clinical Importance. Harrison’s Principles of Internal Medicine. 17th ed. Fauci AS et al (editors). McGraw-Hill, 2008.
Krieg AF, Gambino R, Galen RS: Why are clinical laboratory tests performed? When are they valid? JAMA 1975;233:76.
Lab Tests Online: www.labtestsonline.org (A comprehensive web site provided by the American Association of Clinical Chemists that provides accurate information on most if not all the lab tests mentioned in this text).
Laposaka M: Laboratory Medicine. McGraw-Hill Lange, 2010.
MedlinePlus: http://www.nlm.nih.gov/medlineplus/encyclopedia.html (The A.D.A.M. Medical Encyclopedia includes over 4000 articles about diseases, lab tests and other matters)