Harper’s Illustrated Biochemistry, 29th Edition (2012)
SECTION I. Structures & Functions of Proteins & Enzymes
Chapter 8. Enzymes: Kinetics
Peter J. Kennelly, PhD & Victor W. Rodwell, PhD
OBJECTIVES
After studying this chapter, you should be able to:
![]() Describe the scope and overall purposes of the study of enzyme kinetics.
Describe the scope and overall purposes of the study of enzyme kinetics.
![]() Indicate whether ΔG, the overall change in free energy for a reaction, is dependent on reaction mechanism.
Indicate whether ΔG, the overall change in free energy for a reaction, is dependent on reaction mechanism.
![]() Indicate whether ΔG is a function of the rates of reactions.
Indicate whether ΔG is a function of the rates of reactions.
![]() Explain the relationship between Keq, concentrations of substrates and products at equilibrium, and the ratio of the rate constants k1/k–1.
Explain the relationship between Keq, concentrations of substrates and products at equilibrium, and the ratio of the rate constants k1/k–1.
![]() Outline how temperature and the concentration of hydrogen ions, enzyme, and substrate affect the rate of an enzyme-catalyzed reaction.
Outline how temperature and the concentration of hydrogen ions, enzyme, and substrate affect the rate of an enzyme-catalyzed reaction.
![]() Indicate why laboratory measurement of the rate of an enzyme-catalyzed reaction typically employs initial rate conditions.
Indicate why laboratory measurement of the rate of an enzyme-catalyzed reaction typically employs initial rate conditions.
![]() Describe the application of linear forms of the Michaelis–Menten equation to the determination of Km and Vmax.
Describe the application of linear forms of the Michaelis–Menten equation to the determination of Km and Vmax.
![]() Give one reason why a linear form of the Hill equation is used to evaluate the substrate-binding kinetics exhibited by some multimeric enzymes.
Give one reason why a linear form of the Hill equation is used to evaluate the substrate-binding kinetics exhibited by some multimeric enzymes.
![]() Contrast the effects of an increasing concentration of substrate on the kinetics of simple competitive and noncompetitive inhibition.
Contrast the effects of an increasing concentration of substrate on the kinetics of simple competitive and noncompetitive inhibition.
![]() Describe the ways in which substrates add to, and products depart from, an enzyme that follows a ping–pong mechanism and do the same for an enzyme that follows a rapid-equilibrium mechanism.
Describe the ways in which substrates add to, and products depart from, an enzyme that follows a ping–pong mechanism and do the same for an enzyme that follows a rapid-equilibrium mechanism.
![]() Illustrate the utility of enzyme kinetics in ascertaining the mode of action of drugs.
Illustrate the utility of enzyme kinetics in ascertaining the mode of action of drugs.
BIOMEDICAL IMPORTANCE
Enzyme kinetics is the field of biochemistry concerned with the quantitative measurement of the rates of enzyme-catalyzed reactions and the systematic study of factors that affect these rates. Kinetic analysis can reveal the number and order of the individual steps by which enzymes transform substrates into products. Together with site-directed mutagenesis and other techniques that probe the protein structure, kinetic analyses can reveal details of the catalytic mechanism of a given enzyme.
A complete, balanced set of enzyme activities is of fundamental importance for maintaining homeostasis. An understanding of enzyme kinetics thus is important to understanding how physiologic stresses such as anoxia, metabolic acidosis or alkalosis, toxins, and pharmacologic agents affect that balance. The involvement of enzymes in virtually all physiologic processes makes them the targets of choice for drugs that cure or ameliorate human disease. Applied enzyme kinetics represents the principal tool by which scientists identify and characterize therapeutic agents that selectively inhibit the rates of specific enzyme-catalyzed processes. Enzyme kinetics thus plays a central and critical role in drug discovery and comparative pharmacodynamics, as well as in elucidating the mode of action of drugs.
CHEMICAL REACTIONS ARE DESCRIBED USING BALANCED EQUATIONS
A balanced chemical equation lists the initial chemical species (substrates) present and the new chemical species (products) formed for a particular chemical reaction, all in their correct proportions or stoichiometry. For example, balanced equation (1) describes the reaction of one molecule each of substrates A and B to form one molecule each of products P and Q:
![]()
The double arrows indicate reversibility, an intrinsic property of all chemical reactions. Thus, for reaction (1), if A and B can form P and Q, then P and Q can also form A and B. Designation of a particular reactant as a “substrate” or “product” is therefore somewhat arbitrary since the products for a reaction written in one direction are the substrates for the reverse reaction. The term “products” is, however, often used to designate the reactants whose formation is thermodynamically favored. Reactions for which thermodynamic factors strongly favor formation of the products to which the arrow points often are represented with a single arrow as if they were “irreversible”:
![]()
Unidirectional arrows are also used to describe reactions in living cells where the products of reaction (2) are immediately consumed by a subsequent enzyme-catalyzed reaction. The rapid removal of product P or Q therefore effectively precludes occurrence of the reverse reaction, rendering equation (2) functionally irreversible under physiologic conditions.
CHANGES IN FREE ENERGY DETERMINE THE DIRECTION & EQUILIBRIUM STATE OF CHEMICAL REACTIONS
The Gibbs free energy change ΔG (also called either free energy or Gibbs energy) describes both the direction in which a chemical reaction will tend to proceed and the concentrations of reactants and products that will be present at equilibrium. ΔG for a chemical reaction equals the sum of the free energies of formation of the reaction products ΔGp minus the sum of the free energies of formation of the substrates ΔGs. ΔG0 denotes the change in free energy that accompanies transition from the standard state, one-molar concentrations of substrates and products, to equilibrium. A more useful biochemical term is ΔG0’, which defines ΔG0 at a standard state of 10–7 M protons, pH 7.0 (Chapter 11). If the free energy of formation of the products is lower than that of the substrates, the signs of ΔG0 and ΔG0’ will be negative, indicating that the reaction as written is favored in the direction left to right. Such reactions are referred to as spontaneous. The sign and the magnitude of the free energy change determine how far the reaction will proceed. Equation (3) illustrates the relationship between the equilibrium constant Keq and ΔG0:
![]()
where R is the gas constant (1.98 cal/mol°K or 8.31 J/mol°K) and T is the absolute temperature in degrees Kelvin. Keq is equal to the product of the concentrations of the reaction products, each raised to the power of their stoichiometry, divided by the product of the substrates, each raised to the power of their stoichiometry:
For the reaction ![]()
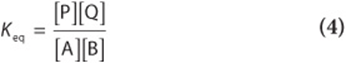
and for reaction (5)
![]()
ΔG0 may be calculated from equation (3) if the molar concentrations of substrates and products present at equilibrium are known. If ΔG0 is a negative number, Keq will be greater than unity, and the concentration of products at equilibrium will exceed that of the substrates. If ΔG0 is positive, Keq will be less than unity, and the formation of substrates will be favored.
Note that, since ΔG0 is a function exclusively of the initial and final states of the reacting species, it can provide information only about the direction and equilibrium state of the reaction. ΔG0 is independent of the mechanism of the reaction and therefore provides no information concerning rates of reactions. Consequently—and as explained below—although a reaction may have a large negative ΔG0 or ΔG0’, it may nevertheless take place at a negligible rate.
THE RATES OF REACTIONS ARE DETERMINED BY THEIR ACTIVATION ENERGY
Reactions Proceed via Transition States
The concept of the transition state is fundamental to understanding the chemical and thermodynamic basis of catalysis. Equation (7) depicts a group transfer reaction in which an entering group E displaces a leaving group L, attached initially to R:
![]()
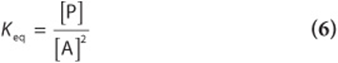
The net result of this process is to transfer group R from L to E. Midway through the displacement, the bond between R and L has weakened but has not yet been completely severed, and the new bond between E and R is yet incompletely formed. This transient intermediate—in which neither free substrate nor product exists—is termed the transition state, E···R···L. Dotted lines represent the “partial” bonds that are undergoing formation and rupture. Figure 8–1 provides a more detailed illustration of the transition state intermediate formed during the transfer of a phosphoryl group.
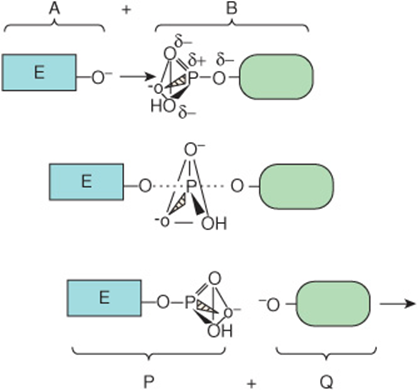
FIGURE 8–1 Formation of a transition state intermediate during a simple chemical reaction, ![]() Shown are three stages of a chemical reaction in which a phosphoryl group is transferred from leaving group L to entering group E. Top: entering group E (A) approaches the other reactant, L-phosphate (B). Notice how the three oxygen atoms linked by the triangular lines and the phosphorus atom of the phosphoryl group form a pyramid. Center: as E approaches L-phosphate, the new bond between E and the phosphate group begins to form (dotted line) as that linking L to the phosphate group weakens. These partially formed bonds are indicated by dotted lines. Bottom: formation of the new product, E-phosphate (P), is now complete as the leaving group L (Q) exits. Notice how the geometry of the phosphoryl group differs between the transition state and the substrate or product. Notice how the phosphorus and three oxygen atoms that occupy the four corners of a pyramid in the substrate and product become coplanar, as emphasized by the triangle, in the transition state.
Shown are three stages of a chemical reaction in which a phosphoryl group is transferred from leaving group L to entering group E. Top: entering group E (A) approaches the other reactant, L-phosphate (B). Notice how the three oxygen atoms linked by the triangular lines and the phosphorus atom of the phosphoryl group form a pyramid. Center: as E approaches L-phosphate, the new bond between E and the phosphate group begins to form (dotted line) as that linking L to the phosphate group weakens. These partially formed bonds are indicated by dotted lines. Bottom: formation of the new product, E-phosphate (P), is now complete as the leaving group L (Q) exits. Notice how the geometry of the phosphoryl group differs between the transition state and the substrate or product. Notice how the phosphorus and three oxygen atoms that occupy the four corners of a pyramid in the substrate and product become coplanar, as emphasized by the triangle, in the transition state.
Reaction (7) can be thought of as consisting of two “partial reactions,” the first corresponding to the formation (F) and the second to the subsequent decay (D) of the transition state intermediate. As for all reactions, characteristic changes in free energy, ΔGF and ΔGD are associated with each partial reaction:
![]()
![]()
![]()
For the overall reaction (10), ΔG is the sum of ΔGF and ΔGD. As for any equation of two terms, it is not possible to infer from ΔG either the sign or the magnitude of ΔGF or ΔGD.
Many reactions involve multiple transition states, each with an associated change in free energy. For these reactions, the overall ΔG represents the sum of all of the free energy changes associated with the formation and decay of all of the transition states. Therefore, it is not possible to infer from the overall ΔG the number or type of transition states through which the reaction proceeds. Stated another way, overall thermodynamics tells us nothing about kinetics.
Δ GF Defines the Activation Energy
Regardless of the sign or magnitude of ΔG, ΔGF for the overwhelming majority of chemical reactions has a positive sign. The formation of transition state intermediates therefore requires surmounting energy barriers. For this reason, ΔGF for reaching a transition state is often termed the activation energy, Eact. The ease—and hence the frequency—with which this barrier is overcome is inversely related to Eact. The thermodynamic parameters that determine how fast a reaction proceeds thus are the ΔGF values for formation of the transition states through which the reaction proceeds. For a simple reaction, where ∝ means “proportionate to,”
![]()
The activation energy for the reaction proceeding in the opposite direction to that drawn is equal to –ΔGD.
NUMEROUS FACTORS AFFECT THE REACTION RATE
The kinetic theory—also called the collision theory—of chemical kinetics states that for two molecules to react they (1) must approach within bond-forming distance of one another, or “collide,” and (2) must possess sufficient kinetic energy to overcome the energy barrier for reaching the transition state. It therefore follows that anything that increases the frequency or energy of collision between substrates will increase the rate of the reaction in which they participate.
Temperature
Raising the temperature increases the kinetic energy of molecules. As illustrated in Figure 8–2, the total number of molecules whose kinetic energy exceeds the energy barrier Eact (vertical bar) for formation of products increases from low (A) through intermediate (B) to high (C) temperatures. Increasing the kinetic energy of molecules also increases their rapidity of motion and therefore the frequency with which they collide. This combination of more frequent and more highly energetic, and hence productive, collisions increases the reaction rate.
FIGURE 8–2 The energy barrier for chemical reactions. (See text for discussion.)
Reactant Concentration
The frequency with which molecules collide is directly proportionate to their concentrations. For two different molecules A and B, the frequency with which they collide will double if the concentration of either A or B is doubled. If the concentrations of both A and B are doubled, the probability of collision will increase fourfold.
For a chemical reaction proceeding at constant temperature that involves one molecule each of A and B,
![]()
the number of the molecules that possess kinetic energy sufficient to overcome the activation energy barrier will be a constant. The number of collisions with sufficient energy to produce product P therefore will be directly proportionate to the number of collisions between A and B, and thus to their molar concentrations, denoted by the square brackets:
![]()
Similarly, for the reaction represented by
![]()
which can also be written as
![]()
The corresponding rate expression is
![]()
or
![]()
For the general case, when n molecules of A react with m molecules of B,
![]()
the rate expression is
![]()
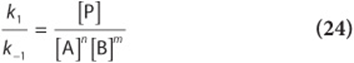
Replacing the proportionality sign with an equals sign by introducing a rate constant k characteristic of the reaction under study gives equations (20) and (21), in which the subscripts 1 and –1 refer to the forward and reverse reactions, respectively:
![]()
![]()
The sum of the molar ratios of the reactants defines the kinetic order of the reaction. Consider reaction (5). The stoichiometric coefficient for the sole reactant, A, is 2. Therefore, the rate of production of P is proportional to the square of [A] and the reaction is said to be second order with respect to reactant A. In this instance, the overall reaction is also second order. Therefore, k1 is referred to as a second-order rate constant.
Reaction (12) describes a simple second-order reaction between two different reactants, A and B. The stoichiometric coefficient for each reactant is 1. Therefore, while the overall order of the reaction is 2, it is said to be first order with respect to A and first order with respect to B. In the laboratory, the kinetic order of a reaction with respect to a particular reactant, referred to as the variable reactant or substrate, can be determined by maintaining the concentration of the other reactants at a constant, or fixed, concentration in large excess over the variable reactant. Under these pseudo-first-order conditions, the concentration of the fixed reactant(s) remains virtually constant. Thus, the rate of reaction will depend exclusively on the concentration of the variable reactant, sometimes also called the limiting reactant. The concepts of reaction order and pseudo-first-order conditions apply not only to simple chemical reactions but also to enzyme-catalyzed reactions.
Keq Is a Ratio of Rate Constants
While all chemical reactions are to some extent reversible, at equilibrium the overall concentrations of reactants and products remain constant. At equilibrium, the rate of conversion of substrates to products therefore equals the rate at which products are converted to substrates:
![]()
Therefore,
![]()
and
The ratio of k1 to k–1 is termed the equilibrium constant, Keq. The following important properties of a system at equilibrium must be kept in mind.
1. The equilibrium constant is a ratio of the reaction rate constants (not the reaction rates).
2. At equilibrium, the reaction rates (not the rate constants) of the forward and back reactions are equal.
3. Equilibrium is a dynamic state. Although there is no net change in the concentration of substrates or products, individual substrate and product molecules are continually being interconverted.
4. The numeric value of the equilibrium constant Keq can be calculated either from the concentrations of substrates and products at equilibrium or from the ratio k1/k–1.
THE KINETICS OF ENZYMATIC CATALYSIS
Enzymes Lower the Activation Energy Barrier for a Reaction
All enzymes accelerate reaction rates by lowering ΔGF for the formation of transition states. However, they may differ in the way this is achieved. Where the mechanism or the sequence of chemical steps at the active site is essentially equivalent to those for the same reaction proceeding in the absence of a catalyst, the environment of the active site lowers ΔGF by stabilizing the transition state intermediates. To put it another way, the enzyme can be envisioned as binding to the transition state intermediate (Figure 8–1) more tightly than it does to either substrates or products. As discussed in Chapter 7, stabilization can involve (1) acid–base groups suitably positioned to transfer protons to or from the developing transition state intermediate, (2) suitably positioned charged groups or metal ions that stabilize developing charges, or (3) the imposition of steric strain on substrates so that their geometry approaches that of the transition state. HIV protease (see Figure 7–6) illustrates catalysis by an enzyme that lowers the activation barrier by stabilizing a transition state intermediate.
Catalysis by enzymes that proceeds via a unique reaction mechanism typically occurs when the transition state intermediate forms a covalent bond with the enzyme (covalent catalysis). The catalytic mechanism of the serine protease chy-motrypsin (see Figure 7–7) illustrates how an enzyme utilizes covalent catalysis to provide a unique reaction pathway.
ENZYMES DO NOT AFFECTKeq
While enzymes undergo transient modifications during the process of catalysis, they always emerge unchanged at the completion of the reaction. The presence of an enzyme therefore has no effect on ΔG0 for the overallreaction, which is a function solely of the initial and final states of the reactants. Equation (25) shows the relationship between the equilibrium constant for a reaction and the standard free energy change for that reaction:
![]()
This principle is perhaps most readily illustrated by including the presence of the enzyme (Enz) in the calculation of the equilibrium constant for an enzyme-catalyzed reaction:
![]()
Since the enzyme on both sides of the double arrows is present in equal quantity and identical form, the expression for the equilibrium constant,
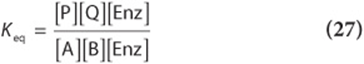
reduces to one identical to that for the reaction in the absence of the enzyme:
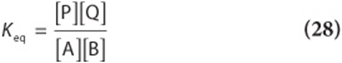
Enzymes therefore have no effect on Keq.
MULTIPLE FACTORS AFFECT THE RATES OF ENZYME-CATALYZED REACTIONS
Temperature
Raising the temperature increases the rate of both uncatalyzed and enzyme-catalyzed reactions by increasing the kinetic energy and the collision frequency of the reacting molecules. However, heat energy can also increase the kinetic energy of the enzyme to a point that exceeds the energy barrier for disrupting the noncovalent interactions that maintain its three-dimensional structure. The polypeptide chain then begins to unfold, or denature, with an accompanying loss of the catalytic activity. The temperature range over which an enzyme maintains a stable, catalytically competent conformation depends upon—and typically moderately exceeds—the normal temperature of the cells in which it resides. Enzymes from humans generally exhibit stability at temperatures up to 45–55°C. By contrast, enzymes from the thermophilic microorganisms that reside in volcanic hot springs or undersea hydrothermal vents may be stable at temperatures up to or even above 100°C.
The temperature coefficient (Q10) is the factor by which the rate of a biologic process increases for a 10°C increase in temperature. For the temperatures over which enzymes are stable, the rates of most biological processes typically double for a 10°C rise in temperature ![]() . Changes in the rates of enzyme-catalyzed reactions that accompany a rise or fall in body temperature constitute a prominent survival feature for “cold-blooded” life forms such as lizards or fish, whose body temperatures are dictated by the external environment. However, for mammals and other homeothermic organisms, changes in enzyme reaction rates with temperature assume physiologic importance only in circumstances such as fever or hypothermia.
. Changes in the rates of enzyme-catalyzed reactions that accompany a rise or fall in body temperature constitute a prominent survival feature for “cold-blooded” life forms such as lizards or fish, whose body temperatures are dictated by the external environment. However, for mammals and other homeothermic organisms, changes in enzyme reaction rates with temperature assume physiologic importance only in circumstances such as fever or hypothermia.
Hydrogen Ion Concentration
The rate of almost all enzyme-catalyzed reactions exhibits a significant dependence on hydrogen ion concentration. Most intracellular enzymes exhibit optimal activity at pH values between 5 and 9. The relationship of activity to hydrogen ion concentration (Figure 8–3) reflects the balance between enzyme denaturation at high or low pH and effects on the charged state of the enzyme, the substrates, or both. For enzymes whose mechanism involves acid–base catalysis, the residues involved must be in the appropriate state of protonation for the reaction to proceed. The binding and recognition of substrate molecules with dissociable groups also typically involves the formation of salt bridges with the enzyme. The most common charged groups are carboxylate groups (negative) and protonated amines (positive). Gain or loss of critical charged groups adversely affects substrate binding and thus will retard or abolish catalysis.
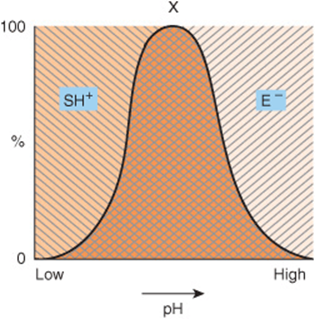
FIGURE 8–3 Effect of pH on enzyme activity. Consider, for example, a negatively charged enzyme (E–) that binds a positively charged substrate (SH+). Shown is the proportion (%) of SH+ [\\\] and of E– [///] as a function of pH. Only in the cross-hatched area do both the enzyme and the substrate bear an appropriate charge.
ASSAYS OF ENZYME-CATALYZED REACTIONS TYPICALLY MEASURE THE INITIAL VELOCITY
Most measurements of the rates of enzyme-catalyzed reactions employ relatively short time periods, conditions that approximate initial rate conditions. Under these conditions, only traces of product accumulate, rendering the rate of the reverse reaction negligible. The initial velocity (vi) of the reaction thus is essentially that of the rate of the forward reaction. Assays of enzyme activity almost always employ a large (103–107) molar excess of substrate over enzyme. Under these conditions, v1. is proportionate to the concentration of enzyme. Measuring the initial velocity therefore permits one to estimate the quantity of enzyme present in a biologic sample.
SUBSTRATE CONCENTRATION AFFECTS THE REACTION RATE
In what follows, enzyme reactions are treated as if they had only a single substrate and a single product. For enzymes with multiple substrates, the principles discussed below apply with equal validity. Moreover, by employing pseudo-first-order conditions (see above), scientists can study the dependence of reaction rate upon an individual reactant through the appropriate choice of fixed and variable substrates. In other words, under pseudo-first-order conditions the behavior of a multisubstrate enzyme will imitate one having a single substrate. In this instance, however, the observed rate constant will be a function of the rate constant k1 for the reaction as well as the concentration of the fixed substrate(s).
For a typical enzyme, as substrate concentration is increased, vi. increases until it reaches a maximum value Vmax (Figure 8–4). When further increases in substrate concentration do not further increase vi, the enzyme is said to be “saturated” with the substrate. Note that the shape of the curve that relates activity to substrate concentration (Figure 8–4) is hyperbolic. At any given instant, only substrate molecules that are combined with the enzyme as an enzyme-substrate (ES) complex can be transformed into a product. Since the equilibrium constant for the formation of the enzyme-substrate complex is not infinitely large, only a fraction of the enzyme may be present as an ES complex even when the substrate is present in excess (points A and B of Figure 8–5). At points A or B, increasing or decreasing [S] therefore will increase or decrease the number of ES complexes with a corresponding change in vi. At point C (Figure 8–5), however, essentially all the enzyme is present as the ES complex. Since no free enzyme remains available for forming ES, further increases in [S] cannot increase the rate of the reaction. Under these saturating conditions, vi. depends solely on—and thus is limited by—the rapidity with which product dissociates from the enzyme so that it may combine with more substrate.
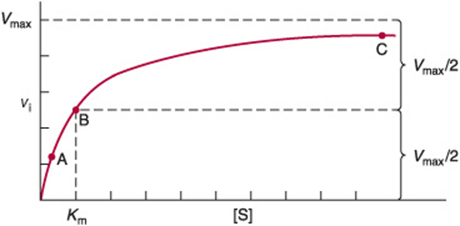
FIGURE 8–4 Effect of substrate concentration on the initial velocity of an enzyme-catalyzed reaction.
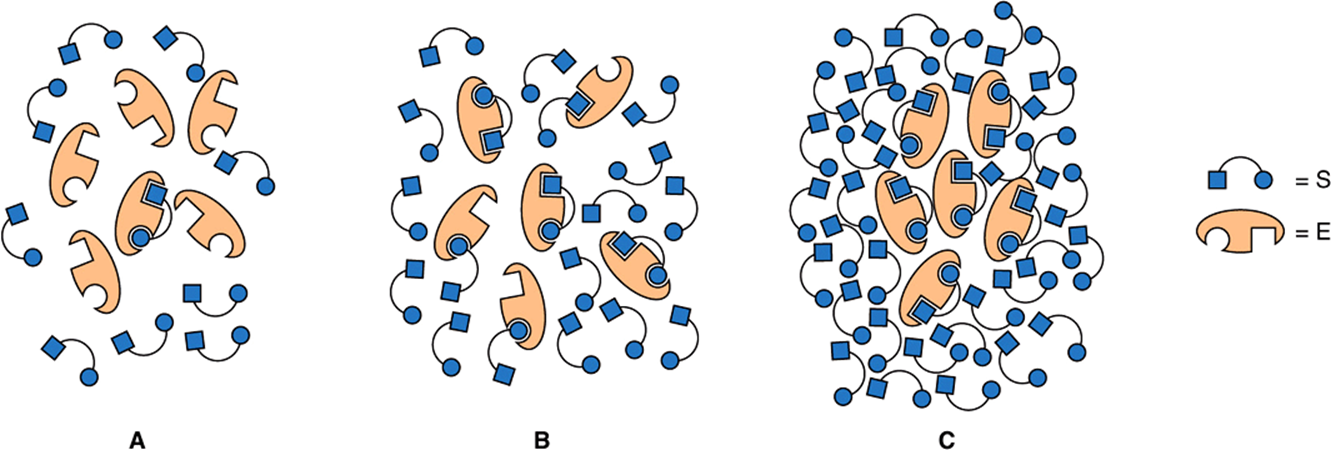
FIGURE 8–5 Representation of an enzyme in the presence of a concentration of substrate that is below Km (A), at a concentration equal to Km (B), and at a concentration well above Km(C). Points A, B, and C correspond to those points in Figure 8–4.
THE MICHAELIS–MENTEN & HILL EQUATIONS MODEL THE EFFECTS OF SUBSTRATE CONCENTRATION
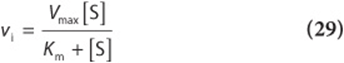
The Michaelis–Menten Equation
The Michaelis–Menten equation (29) illustrates in mathematical terms the relationship between initial reaction velocity vi and substrate concentration [S], shown graphically in Figure 8–4:

The Michaelis constant Km is the substrate concentration at which vi is half the maximal velocity (Vmax/2) attainable at a particular concentration of the enzyme. Km thus has the dimensions of substrate concentration. The dependence of initial reaction velocity on [S] and Km may be illustrated by evaluating the Michaelis–Menten equation under three conditions.
1. When [S] is much less than Km (point A in Figures 8-4 and 8-5), the term Km + [S] is essentially equal to Km. Replacing Km + [S] with Km reduces equation (29) to
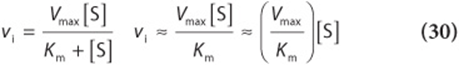
where ≈ means “approximately equal to.” Since Vmax and Km are both constants, their ratio is a constant. In other words, when [S] is considerably below Km, vi is proportionate to k[S]. The initial reaction velocity therefore is directly proportional to [S].
2. When [S] is much greater than Km (point C in Figures 8–4 and 8–5), the term Km + [S] is essentially equal to [S]. Replacing Km + [S] with [S] reduces equation (29) to
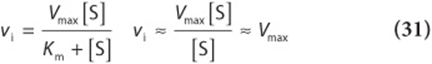
Thus, when [S] greatly exceeds Km, the reaction velocity is maximal (Vmax) and unaffected by further increases in the substrate concentration.
3. When ![]() (point B in Figures 8–4 and 8–5):
(point B in Figures 8–4 and 8–5):
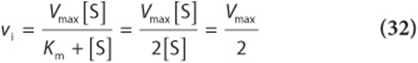
Equation (32) states that when [S] equals Km, the initial velocity is half-maximal. Equation (32) also reveals that Km is—and may be determined experimentally from—the substrate concentration at which the initial velocity is half-maximal.
A Linear Form of the Michaelis–Menten Equation Is Used to Determine Km & Vmax
The direct measurement of the numeric value of Vmax, and therefore the calculation of Km, often requires impractically high concentrations of substrate to achieve saturating conditions. A linear form of the Michaelis–Menten equation circumvents this difficulty and permits Vmax and Km to be extrapolated from initial velocity data obtained at less than saturating concentrations of the substrate. Start with equation (29),
invert
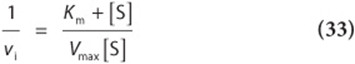
factor
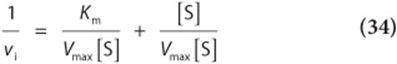
and simplify
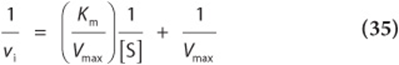
Equation (35) is the equation for a straight line, ![]() , where
, where ![]() and
and ![]() . A plot of 1/vi. as y as a function of 1/[S] as x therefore gives a straight line whose y intercept is 1/Vmax and whose slope is Km/Vmax. Such a plot is called a double reciprocal or Lineweaver–Burk plot (Figure 8–6). Setting the y term of equation (36) equal to zero and solving for x reveals that the x intercept is –1/Km:
. A plot of 1/vi. as y as a function of 1/[S] as x therefore gives a straight line whose y intercept is 1/Vmax and whose slope is Km/Vmax. Such a plot is called a double reciprocal or Lineweaver–Burk plot (Figure 8–6). Setting the y term of equation (36) equal to zero and solving for x reveals that the x intercept is –1/Km:
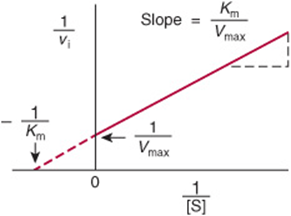
FIGURE 8–6 Double-reciprocal or Lineweaver–Burk plot of 1/v1 versus 1/[S] used to evaluate Km and Vmax.
![]()
Km is thus most readily calculated from the negative x intercept.
The greatest virtue of the Lineweaver–Burk plot resides in the facility with which it can be used to determine the kinetic mechanisms of enzyme inhibitors (see below). However, in using a double-reciprocal plot to determine kinetic constants it is important to avoid the introduction of bias through the clustering of data at low values of 1/[S]. To avoid this bias, prepare a solution of substrate whose dilution into an assay will produce the maximum desired concentration of the substrate. Now use the same volume of solutions prepared by diluting the stock solution by factors of 1:2, 1:3, 1:4, 1:5, etc. The data will then fall on the 1/[S] axis at intervals of 1, 2, 3, 4, 5, etc. Alternatively, a single-reciprocal plot such as the Eadie–Hofstee (vi versus vi/[S]) or Hanes–Woolf ([S]/vi versus [S]) plot can be used to minimize clustering.
The Catalytic Constant, kcat
Several parameters may be used to compare the relative activity of different enzymes or of different preparations of the same enzyme. The activity of impure enzyme preparations typically is expressed as a specific activity (Vmaxdivided by the protein concentration). For a homogeneous enzyme, one may calculate its turnover number (Vmax divided by the moles of enzyme present). But if the number of active sites present is known, the catalytic activity of a homogeneous enzyme is best expressed as its catalytic constant, kcat (Vmax divided by the number of active sites, St):
![]()
Since the units of concentration cancel out, the units of kcat are reciprocal time.
Catalytic Efficiency, kcat/Km
By what measure should the efficiency of different enzymes, different substrates for a given enzyme, and the efficiency with which an enzyme catalyzes a reaction in the forward and reverse directions be quantified and compared? While the maximum capacity of a given enzyme to convert substrate to product is important, the benefits of a high kcat can only be realized if Km is sufficiently low. Thus, catalytic efficiency of enzymes is best expressed in terms of the ratio of these two kinetic constants, kcat/Km.
For certain enzymes, once substrate binds to the active site, it is converted to product and released so rapidly as to render these events effectively instantaneous. For these exceptionally efficient catalysts, the rate-limiting step in catalysis is the formation of the ES complex. Such enzymes are said to be diffusion-limited, or catalytically perfect, since the fastest possible rate of catalysis is determined by the rate at which molecules move or diffuse through the solution. Examples of enzymes for which kcat/Km approaches the diffusion limit of 108–109 M–1s–1 include triosephosphate isomerase, carbonic anhydrase, acetylcholinesterase, and adenosine deaminase.
In living cells, the assembly of enzymes that catalyze successive reactions into multimeric complexes can circumvent the limitations imposed by diffusion. The geometric relationships of the enzymes in these complexes are such that the substrates and products do not diffuse into the bulk solution until the last step in the sequence of catalytic steps is complete. Fatty acid synthetase extends this concept one step further by covalently attaching the growing substrate fatty acid chain to a biotin tether that rotates from active site to active site within the complex until synthesis of a palmitic acid molecule is complete (Chapter 23).
Km May Approximate a Binding Constant
The affinity of an enzyme for its substrate is the inverse of the dissociation constant Kd for dissociation of the enzyme-substrate complex ES:
![]()
![]()
Stated another way, the smaller the tendency of the enzyme and its substrate to dissociate, the greater the affinity of the enzyme for its substrate. While the Michaelis constant Km often approximates the dissociation constant Kd, this is by no means always the case. For a typical enzyme-catalyzed reaction:
![]()
The value of [S] that gives ![]() is
is
![]()
When ![]() , then
, then
![]()
and
![]()
Hence, 1/Km only approximates 1/Kd under conditions where the association and dissociation of the ES complex are rapid relative to catalysis. For the many enzyme-catalyzed reactions for which k–1 + k2 is not approximately equal to k–1, 1/Km will underestimate 1 /Kd.
The Hill Equation Describes the Behavior of Enzymes That Exhibit Cooperative Binding of Substrate
While most enzymes display the simple saturation kinetics depicted in Figure 8–4 and are adequately described by the Michaelis–Menten expression, some enzymes bind their substrates in a cooperative fashion analogous to the binding of oxygen by hemoglobin (Chapter 6). Cooperative behavior is an exclusive property of multimeric enzymes that bind substrate at multiple sites.
For enzymes that display positive cooperativity in binding the substrate, the shape of the curve that relates changes in vi to changes in [S] is sigmoidal (Figure 8–7). Neither the Michaelis–Menten expression nor its derived plots can be used to evaluate cooperative kinetics. Enzymologists therefore employ a graphic representation of the Hill equation originally derived to describe the cooperative binding of O2 by hemoglobin. Equation (44) represents the Hill equation arranged in a form that predicts a straight line, where k’ is a complex constant:
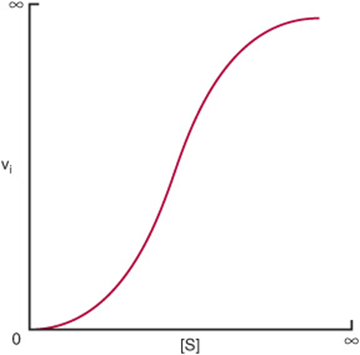
FIGURE 8–7 Representation of sigmoid substrate saturation kinetics.
![]()
Equation (44) states that when [S] is low relative to k’, the initial reaction velocity increases as the nth power of [S].
A graph of log vi/(Vmax – vi) versus log[S] gives a straight line (Figure 8–8), where the slope of the line n is the Hill coefficient, an empirical parameter whose value is a function of the number, kind, and strength of the interactions of the multiple substrate-binding sites on the enzyme. When ![]() , all binding sites behave independently and simple Michaelis–Menten kinetic behavior is observed. If n is greater than 1, the enzyme is said to exhibit positive cooperativity. Binding of substrate to one site then enhances the affinity of the remaining sites to bind additional substrate. The greater the value for n, the higher the degree of cooperativity and the more markedly sigmoidal will be the plot of vi. versus [S]. A perpendicular dropped from the point where the y term log vi/(Vmax – vi) is zero intersects the x-axis at a substrate concentration termed S50, the substrate concentration that results in half-maximal velocity. S50 thus is analogous to the P50 for oxygen binding to hemoglobin (Chapter 6).
, all binding sites behave independently and simple Michaelis–Menten kinetic behavior is observed. If n is greater than 1, the enzyme is said to exhibit positive cooperativity. Binding of substrate to one site then enhances the affinity of the remaining sites to bind additional substrate. The greater the value for n, the higher the degree of cooperativity and the more markedly sigmoidal will be the plot of vi. versus [S]. A perpendicular dropped from the point where the y term log vi/(Vmax – vi) is zero intersects the x-axis at a substrate concentration termed S50, the substrate concentration that results in half-maximal velocity. S50 thus is analogous to the P50 for oxygen binding to hemoglobin (Chapter 6).
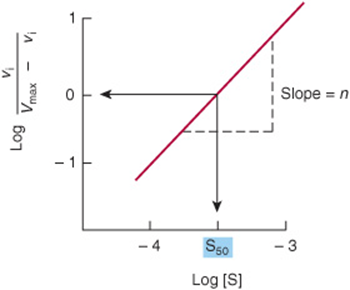
FIGURE 8–8 A graphical representation of a linear form of the Hill equation is used to evaluate S50, the substrate concentration that produces half-maximal velocity, and the degree of cooperativity n.
KINETIC ANALYSIS DISTINGUISHES COMPETITIVE FROM NONCOMPETITIVE INHIBITION
Inhibitors of the catalytic activities of enzymes provide both pharmacologic agents and research tools for the study of the mechanism of enzyme action. The strength of the interaction between an inhibitor and an enzyme depends on forces important in protein structure and ligand binding (hydrogen bonds, electrostatic interactions, hydrophobic interactions, and van der Waals forces; see Chapter 5). Inhibitors can be classified on the basis of their site of action on the enzyme, on whether they chemically modify the enzyme, or on the kinetic parameters they influence. Compounds that mimic the transition state of an enzyme-catalyzed reaction (transition state analogs) or that take advantage of the catalytic machinery of an enzyme (mechanism-based inhibitors) can be particularly potent inhibitors. Kinetically, we distinguish two classes of inhibitors based upon whether raising the substrate concentration does or does not overcome the inhibition.
Competitive Inhibitors Typically Resemble Substrates
The effects of competitive inhibitors can be overcome by raising the concentration of substrate. Most frequently, in competitive inhibition the inhibitor (I) binds to the substrate-binding portion of the active site thereby blocking access by the substrate. The structures of most classic competitive inhibitors therefore tend to resemble the structures of a substrate, and thus are termed substrate analogs. Inhibition of the enzyme succinate dehydrogenase by malonate illustrates competitive inhibition by a substrate analog. Succinate dehydrogenase catalyzes the removal of one hydrogen atom from each of the two-methyl-ene carbons of succinate (Figure 8–9). Both succinate and its structural analog malonate (–OOC—CH2—COO–) can bind to the active site of succinate dehydrogenase, forming an ES or an EI complex, respectively. However, since malonate contains only one methylene carbon, it cannot undergo dehydrogenation.
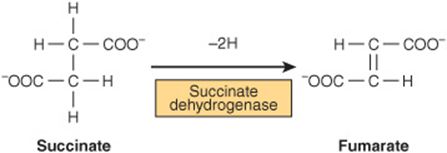
FIGURE 8–9 The succinate dehydrogenase reaction.
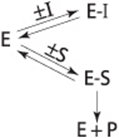
The formation and dissociation of the EI complex is a dynamic process described by
![]()
for which the equilibrium constant Ki is
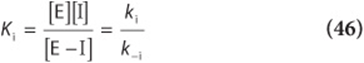
In effect, a competitive inhibitor acts by decreasing the number of free enzyme molecules available to bind substrate, ie, to form ES, and thus eventually to form product, as described below.
A competitive inhibitor and substrate exert reciprocal effects on the concentration of the EI and ES complexes. Since the formation of ES complexes removes free enzyme available to combine with the inhibitor, increasing [S] decreases the concentration of the EI complex and raises the reaction velocity. The extent to which [S] must be increased to completely overcome the inhibition depends upon the concentration of the inhibitor present, its affinity for the enzyme, Ki, and the affinity, Km, of the enzyme for its substrate.
Double-Reciprocal Plots Facilitate the Evaluation of Inhibitors
Double-reciprocal plots distinguish between competitive and noncompetitive inhibitors and simplify evaluation of inhibition constants. vi is determined at several substrate concentrations both in the presence and in the absence of the inhibitor. For classic competitive inhibition, the lines that connect the experimental data points converge at the y-axis (Figure 8–10). Since the y intercept is equal to 1/Vmax, this pattern indicates that when 1/[S] approaches 0, viis independent of the presence of inhibitor. Note, however, that the intercept on the x-axis does vary with inhibitor concentration—and that since –1/K’m is smaller than 1/Km, K’m (the “apparent Km”) becomes larger in the presence of increasing concentrations of the inhibitor. Thus, a competitive inhibitor has no effect on Vmax but raises K’m, the apparent Km for the substrate. For a simple competitive inhibition, the intercept on the x-axis is
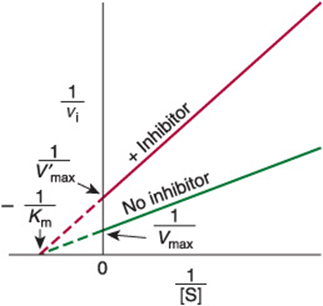
FIGURE 8–10 Lineweaver–Burk plot of simple competitive inhibition. Note the complete relief of inhibition at high [S] (ie, low 1/[S]).
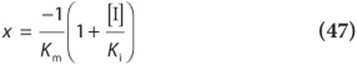
Once Km has been determined in the absence of inhibitor, Ki can be calculated from equation (47). Ki values are used to compare different inhibitors of the same enzyme. The lower the value for Ki, the more effective the inhibitor. For example, the statin drugs that act as competitive inhibitors of HMG-CoA reductase (Chapter 26) have Ki values several orders of magnitude lower than the Km for the substrate HMG-CoA.
Simple Noncompetitive Inhibitors Lower Vmax But Do Not Affect Km
In strict noncompetitive inhibition, binding of the inhibitor does not affect binding of the substrate. Formation of both EI and EIS complexes is therefore possible. However, while the enzyme-inhibitor complex can still bind the substrate, its efficiency at transforming substrate to product, reflected by Vmax, is decreased. Noncompetitive inhibitors bind enzymes at sites distinct from the substrate-binding site and generally bear little or no structural resemblance to the substrate.
For simple noncompetitive inhibition, E and EI possess identical affinity for the substrate, and the EIS complex generates product at a negligible rate (Figure 8–11). More complex noncompetitive inhibition occurs when binding of the inhibitor does affect the apparent affinity of the enzyme for the substrate, causing the lines to intercept in either the third or fourth quadrants of a double-reciprocal plot (not shown). While certain inhibitors exhibit characteristics of a mixture of competitive and noncompetitive inhibition, the evaluation of these inhibitors exceeds the scope of this chapter.
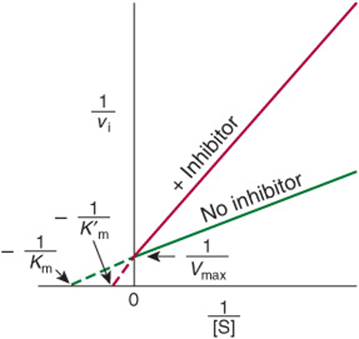
FIGURE 8–11 Lineweaver–Burk plot for simple noncompetitive inhibition.
Dixon Plot
A Dixon plot is sometimes employed as an alternative to the Lineweaver–Burk plot for determining inhibition constants. The initial velocity (vi) is measured at several concentrations of inhibitor, but at a fixed concentration of the substrate (S). For a simple competitive or noncompetitive inhibitor, a plot of 1/vi versus inhibitor concentration [I] yields a straight line. The experiment is repeated at different fixed concentrations of the substrate. The resulting set of lines intersects to the left of the y-axis. For competitive inhibition, a perpendicular dropped to the x-axis from the point of intersection of the lines gives –Ki (Figure 8–12, top). For noncompetitive inhibition the intercept on the x-axis is –Ki (Figure 8–12, bottom). Pharmaceutical publications frequently employ Dixon plots to illustrate the comparative potency of competitive inhibitors.
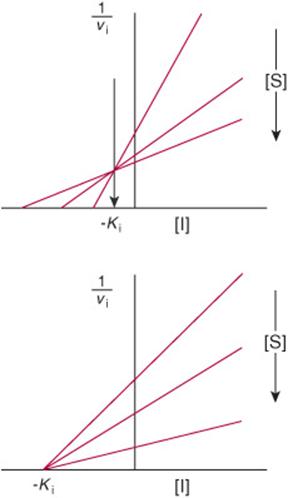
FIGURE 8–12 Applications of Dixon plots. Top: competitive inhibition, estimation of Ki. Bottom: noncompetitive inhibition, estimation of Ki.
IC50
A less rigorous alternative to Ki as a measure of inhibitory potency is the concentration of inhibitor that produces 50% inhibition, IC50. Unlike the equilibrium dissociation constant Ki, the numeric value of IC50 varies as a function of the specific circumstances of substrate concentration, etc, under which it is determined.
Tightly Bound Inhibitors
Some inhibitors bind to enzymes with such high affinity, ![]() M, that the concentration of inhibitor required to measure Ki falls below the concentration of enzyme typically present in an assay. Under these circumstances, a significant fraction of the total inhibitor may be present as an EI complex. If so, this violates the assumption, implicit in classical steady-state kinetics, that the concentration of free inhibitor is independent of the concentration of enzyme. The kinetic analysis of these tightly bound inhibitors requires specialized kinetic equations that incorporate the concentration of enzyme to estimate Ki or IC50 and to distinguish competitive from noncompetitive tightly bound inhibitors.
M, that the concentration of inhibitor required to measure Ki falls below the concentration of enzyme typically present in an assay. Under these circumstances, a significant fraction of the total inhibitor may be present as an EI complex. If so, this violates the assumption, implicit in classical steady-state kinetics, that the concentration of free inhibitor is independent of the concentration of enzyme. The kinetic analysis of these tightly bound inhibitors requires specialized kinetic equations that incorporate the concentration of enzyme to estimate Ki or IC50 and to distinguish competitive from noncompetitive tightly bound inhibitors.
Irreversible Inhibitors “Poison” Enzymes
In the above examples, the inhibitors form a dissociable, dynamic complex with the enzyme. Fully active enzyme can therefore be recovered simply by removing the inhibitor from the surrounding medium. However, a variety of other inhibitors act irreversibly by chemically modifying the enzyme. These modifications generally involve making or breaking covalent bonds with aminoacyl residues essential for substrate binding, catalysis, or maintenance of the enzyme’s functional conformation. Since these covalent changes are relatively stable, an enzyme that has been “poisoned” by an irreversible inhibitor such as a heavy metal atom or an acylating reagent remains inhibited even after the removal of the remaining inhibitor from the surrounding medium.
Mechanism-Based Inhibition
“Mechanism-based” or “suicide” inhibitors are specialized substrate analogs that contain a chemical group that can be transformed by the catalytic machinery of the target enzyme. After binding to the active site, catalysis by the enzyme generates a highly reactive group that forms a covalent bond to, and blocks the function of a catalytically essential residue. The specificity and persistence of suicide inhibitors, which are both enzyme-specific and unreactive outside the confines of the enzyme’s active site, render them promising leads for the development of enzyme-specific drugs. The kinetic analysis of suicide inhibitors lies beyond the scope of this chapter. Neither the Lineweaver–Burk nor the Dixon approach is applicable since suicide inhibitors violate a key boundary condition common to both approaches, namely that the activity of the enzyme does not decrease during the course of the assay.
MOST ENZYME-CATALYZED REACTIONS INVOLVE TWO OR MORE SUBSTRATES
While several enzymes have a single substrate, many others have two—and sometimes more—substrates and products. The fundamental principles discussed above, while illustrated for single-substrate enzymes, apply also to multisubstrate enzymes. The mathematical expressions used to evaluate multisubstrate reactions are, however, complex. While a detailed analysis of the full range of multisubstrate reactions exceeds the scope of this chapter, some common types of kinetic behavior for two-substrate, two-product reactions (termed “BiBi” reactions) are considered below.
Sequential or Single-Displacement Reactions
In sequential reactions, both substrates must combine with the enzyme to form a ternary complex before catalysis can proceed (Figure 8–13, top). Sequential reactions are sometimes referred to as single-displacement reactions because the group undergoing transfer is usually passed directly, in a single step, from one substrate to the other. Sequential Bi–Bi reactions can be further distinguished on the basis of whether the two substrates add in a random or in a compulsory order. For random-order reactions, either substrate A or substrate B may combine first with the enzyme to form an EA or an EB complex (Figure 8–13, center). For compulsory-order reactions, A must first combine with E before B can combine with the EA complex. One explanation for why some enzymes employ compulsory-order mechanisms can be found in Koshland’s induced fit hypothesis: the addition of A induces a conformational change in the enzyme that aligns residues that recognize and bind B.
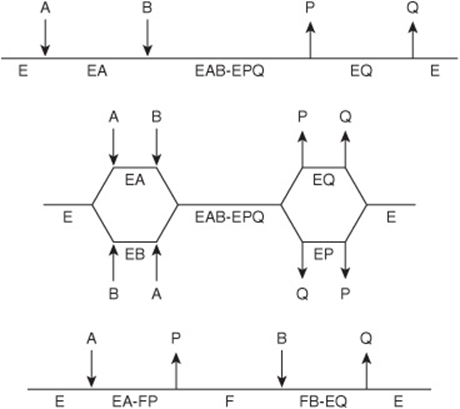
FIGURE 8–13 Representations of three classes of Bi–Bi reaction mechanisms. Horizontal lines represent the enzyme. Arrows indicate the addition of substrates and departure of products. Top: an ordered Bi–Bi reaction, characteristic of many NAD(P)H-dependent oxidoreductases. Center: a random Bi–Bi reaction, characteristic of many kinases and some dehydrogenases. Bottom: a ping–pong reaction, characteristic of aminotransferases and serine proteases.
Ping–Pong Reactions
The term “ping–pong” applies to mechanisms in which one or more products are released from the enzyme before all the substrates have been added. Ping–pong reactions involve covalent catalysis and a transient, modified form of the enzyme (see Figure 7–4). Ping–pong Bi–Bi reactions are often referred to as double displacement reactions. The group undergoing transfer is first displaced from substrate A by the enzyme to form product P and a modified form of the enzyme (F). The subsequent group transfer from F to the second substrate B, forming product Q and regenerating E, constitutes the second displacement (Figure 8–13, bottom).
Most Bi–Bi Reactions Conform to Michaelis–Menten Kinetics
Most Bi–Bi reactions conform to a somewhat more complex form of Michaelis–Menten kinetics in which Vmax refers to the reaction rate attained when both substrates are present at saturating levels. Each substrate has its own characteristic Km value, which corresponds to the concentration that yields half-maximal velocity when the second substrate is present at saturating levels. As for single-substrate reactions, double-reciprocal plots can be used to determine Vmax and Km. vi is measured as a function of the concentration of one substrate (the variable substrate) while the concentration of the other substrate (the fixed substrate) is maintained constant. If the lines obtained for several fixed-substrate concentrations are plotted on the same graph, it is possible to distinguish a ping–pong mechanism, which yields parallel lines (Figure 8–14), from a sequential mechanism, which yields a pattern of intersecting lines (not shown).
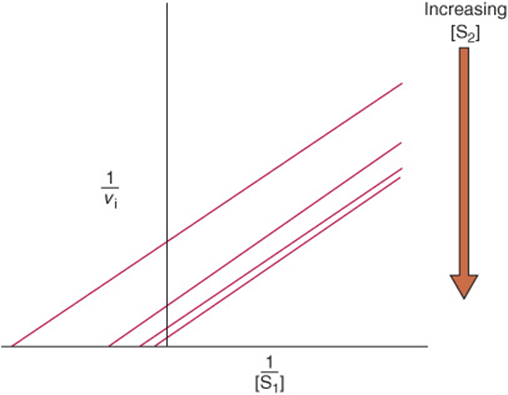
FIGURE 8–14 Lineweaver–Burk plot for a two-substrate ping–pong reaction. An increase in concentration of one substrate (S1) while that of the other substrate (S2) is maintained constant for changes both the x and yintercepts, but not the slope.
Product inhibition studies are used to complement kinetic analyses and to distinguish between ordered and random Bi–Bi reactions. For example, in a random-order Bi–Bi reaction, each product will act as a competitive inhibitor in the absence of its coproducts regardless of which substrate is designated the variable substrate. However, for a sequential mechanism (Figure 8–13, top), only product Q will give the pattern indicative of competitive inhibition when A is the variable substrate, while only product P will produce this pattern with B as the variable substrate. The other combinations of product inhibitor and variable substrate will produce forms of complex noncompetitive inhibition.
KNOWLEDGE OF ENZYME KINETICS, MECHANISM, AND INHIBITION AIDS DRUG DEVELOPMENT
Many Drugs Act as Enzyme Inhibitors
The goal of pharmacology is to identify agents that can
1. Destroy or impair the growth, invasiveness, or development of invading pathogens.
2. Stimulate endogenous defense mechanisms.
3. Halt or impede aberrant molecular processes triggered by genetic, environmental, or biologic stimuli with minimal perturbation of the host’s normal cellular functions.
By virtue of their diverse physiologic roles and high degree of substrate selectivity, enzymes constitute natural targets for the development of pharmacologic agents that are both potent and specific. Statin drugs, for example, lower cholesterol production by inhibiting 3-hydroxy-3-methylglutaryl coenzyme A reductase (Chapter 26), while emtricitabine and tenofovir disoproxil fumarate block replication of the human immunodeficiency virus by inhibiting the viral reverse transcriptase (Chapter 34). Pharmacologic treatment of hypertension often includes the administration of an inhibitor of angiotensin-converting enzyme, thus lowering the level of angiotensin II, a vasoconstrictor (Chapter 42).
Enzyme Kinetics Defines Appropriate Screening Conditions
Enzyme kinetics plays a crucial role in drug discovery. Knowledge of the kinetic behavior of the enzyme of interest is necessary, first and foremost, to select appropriate assay conditions for detecting the presence of an inhibitor. The concentration of substrate, for example, must be adjusted such that sufficient product is generated to permit facile detection of the enzyme’s activity without being so high that it masks the presence of an inhibitor. Second, enzyme kinetics provides the means for quantifying and comparing the potency of different inhibitors and defining their mode of action. Noncompetitive inhibitors are particularly desirable, because—by contrast to competitive inhibitors—their effects can never be completely overcome by increases in substrate concentration.
Most Drugs Are Metabolized In Vivo
Drug development often involves more than the kinetic evaluation of the interaction of inhibitors with the target enzyme. Drugs may be acted upon by enzymes present in the patient or pathogen, a process termed drug metabolism.For example, penicillin and other β-lactam antibiotics block cell wall synthesis in bacteria by irreversibly poisoning the enzyme alanyl alanine carboxypeptidase-transpeptidase. Many bacteria, however, produce β-lactamases that hydrolyze the critical β-lactam function in penicillin and related drugs. One strategy for overcoming the resulting antibiotic resistance is to simultaneously administer a β-lactamase inhibitor with a β-lactam antibiotic.
Metabolic transformation is sometimes required to convert an inactive drug precursor, or prodrug, into its biologically active form (Chapter 53). 2′-Deoxy-5-fluorouridylic acid, a potent inhibitor of thymidylate synthase, a common target of cancer chemotherapy, is produced from 5-fluorouracil via a series of enzymatic transformations catalyzed by a phospho-ribosyl transferase and the enzymes of the deoxyribonucleo-side salvage pathway (Chapter 33). The effective design and administration of prodrugs requires knowledge of the kinetics and mechanisms of the enzymes responsible for transforming them into their biologically active forms.
SUMMARY
![]() The study of enzyme kinetics—the factors that affect the rates of enzyme-catalyzed reactions—reveals the individual steps by which enzymes transform substrates into products.
The study of enzyme kinetics—the factors that affect the rates of enzyme-catalyzed reactions—reveals the individual steps by which enzymes transform substrates into products.
![]() ΔG, the overall change in free energy for a reaction, is independent of reaction mechanism and provides no information concerning rates of reactions.
ΔG, the overall change in free energy for a reaction, is independent of reaction mechanism and provides no information concerning rates of reactions.
![]() Keq, a ratio of reaction rate constants, may be calculated from the concentrations of substrates and products at equilibrium or from the ratio k1/k–1. Enzymes do not affect Keq.
Keq, a ratio of reaction rate constants, may be calculated from the concentrations of substrates and products at equilibrium or from the ratio k1/k–1. Enzymes do not affect Keq.
![]() Reactions proceed via transition states for which ΔGF is the activation energy. Temperature, hydrogen ion concentration, enzyme concentration, substrate concentration, and inhibitors all affect the rates of enzyme-catalyzed reactions.
Reactions proceed via transition states for which ΔGF is the activation energy. Temperature, hydrogen ion concentration, enzyme concentration, substrate concentration, and inhibitors all affect the rates of enzyme-catalyzed reactions.
![]() Measurement of the rate of an enzyme-catalyzed reaction generally employs initial rate conditions, for which the virtual absence of product precludes the reverse reaction.
Measurement of the rate of an enzyme-catalyzed reaction generally employs initial rate conditions, for which the virtual absence of product precludes the reverse reaction.
![]() Linear forms of the Michaelis–Menten equation simplify determination of Km and Vmax.
Linear forms of the Michaelis–Menten equation simplify determination of Km and Vmax.
![]() A linear form of the Hill equation is used to evaluate the cooperative substrate-binding kinetics exhibited by some multimeric enzymes. The slope n, the Hill coefficient, reflects the number, nature, and strength of the interactions of the substrate-binding sites. A value of n greater than 1 indicates positive cooperativity.
A linear form of the Hill equation is used to evaluate the cooperative substrate-binding kinetics exhibited by some multimeric enzymes. The slope n, the Hill coefficient, reflects the number, nature, and strength of the interactions of the substrate-binding sites. A value of n greater than 1 indicates positive cooperativity.
![]() The effects of simple competitive inhibitors, which typically resemble substrates, are overcome by raising the concentration of the substrate. Simple noncompetitive inhibitors lower Vmax but do not affect Km.
The effects of simple competitive inhibitors, which typically resemble substrates, are overcome by raising the concentration of the substrate. Simple noncompetitive inhibitors lower Vmax but do not affect Km.
![]() For simple competitive and noncompetitive inhibitors, the inhibitory constant Ki is equal to the equilibrium dissociation constant for the relevant enzyme-inhibitor complex. A simpler and less rigorous term for evaluating the effectiveness of an inhibitor is IC50, the concentration of inhibitor that produces 50% inhibition under the particular circumstances of the experiment.
For simple competitive and noncompetitive inhibitors, the inhibitory constant Ki is equal to the equilibrium dissociation constant for the relevant enzyme-inhibitor complex. A simpler and less rigorous term for evaluating the effectiveness of an inhibitor is IC50, the concentration of inhibitor that produces 50% inhibition under the particular circumstances of the experiment.
![]() Substrates may add in a random order (either substrate may combine first with the enzyme) or in a compulsory order (substrate A must bind before substrate B).
Substrates may add in a random order (either substrate may combine first with the enzyme) or in a compulsory order (substrate A must bind before substrate B).
![]() In ping–pong reactions, one or more products are released from the enzyme before all the substrates have been added.
In ping–pong reactions, one or more products are released from the enzyme before all the substrates have been added.
![]() Applied enzyme kinetics facilitates the identification and characterization of drugs that selectively inhibit specific enzymes. Enzyme kinetics thus plays a central and critical role in drug discovery, in comparative pharmacodynamics, and in determining the mode of action of drugs.
Applied enzyme kinetics facilitates the identification and characterization of drugs that selectively inhibit specific enzymes. Enzyme kinetics thus plays a central and critical role in drug discovery, in comparative pharmacodynamics, and in determining the mode of action of drugs.
REFERENCES
Cook PF, Cleland WW: Enzyme Kinetics and Mechanism. Garland Science, 2007.
Copeland RA: Evaluation of Enzyme Inhibitors in Drug Discovery. John Wiley & Sons, 2005.
Cornish-Bowden A: Fundamentals of Enzyme Kinetics. Portland Press Ltd, 2004.
Dixon M: The determination of enzyme inhibitor constants. Biochem J 1953;55:170.
Dixon M: The graphical determination of Km and Ki. Biochem J 1972;129:197.
Fersht A: Structure and Mechanism in Protein Science: A Guide to Enzyme Catalysis and Protein Folding. Freeman, 1999.
Fraser CM, Rappuoli R: Application of microbial genomic science to advanced therapeutics. Annu Rev Med 2005;56:459.
Henderson PJF: A linear equation that describes the steady-state kinetics of enzymes and subcellular particles interacting with tightly bound inhibitors. Biochem J 1972;127:321.
Schramm, VL: Enzymatic transition-state theory and transition-state analogue design. J Biol Chem 2007;282:28297.
Schultz AR: Enzyme Kinetics: From Diastase to Multi-enzyme Systems. Cambridge University Press, 1994.
Segel IH: Enzyme Kinetics. Wiley Interscience, 1975.
Wlodawer A: Rational approach to AIDS drug design through structural biology. Annu Rev Med 2002;53:595.