CHEMISTRY THE CENTRAL SCIENCE
14 CHEMICAL KINETICS
14.5 TEMPERATURE AND RATE
The rates of most chemical reactions increase as the temperature rises. For example, dough rises faster at room temperature than when refrigerated, and plants grow more rapidly in warm weather than in cold. We can see the effect of temperature on reaction rate by observing a chemiluminescence reaction (one that produces light). The characteristic glow of fireflies is a familiar example of chemiluminescence. Another is the light produced by Cyalume® light sticks, which contain chemicals that produce chemiluminescence when mixed. As seen in ![]() FIGURE 14.13, these light sticks produce a brighter light at higher temperature. The amount of light produced is greater because the rate of the reaction is faster at the higher temperature. Although the light stick glows more brightly initially, its luminescence also dies out more rapidly at the higher temperature.
FIGURE 14.13, these light sticks produce a brighter light at higher temperature. The amount of light produced is greater because the rate of the reaction is faster at the higher temperature. Although the light stick glows more brightly initially, its luminescence also dies out more rapidly at the higher temperature.
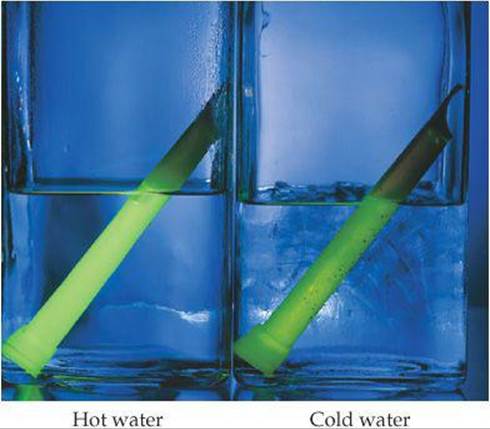
![]() FIGURE 14.13 Temperature affects the rate of the chemiluminescence reaction in light sticks.
FIGURE 14.13 Temperature affects the rate of the chemiluminescence reaction in light sticks.
How is this experimentally observed temperature effect reflected in the rate law? The faster rate at higher temperature is due to an increase in the rate constant with increasing temperature. For example, let's reconsider the first-order reaction CH3NC → CH3CN. ![]() FIGURE 14.14 shows the rate constant for this reaction as a function of temperature. The rate constant and, hence, the rate of the reaction increase rapidly with temperature, approximately doubling for each 10 °C rise.
FIGURE 14.14 shows the rate constant for this reaction as a function of temperature. The rate constant and, hence, the rate of the reaction increase rapidly with temperature, approximately doubling for each 10 °C rise.
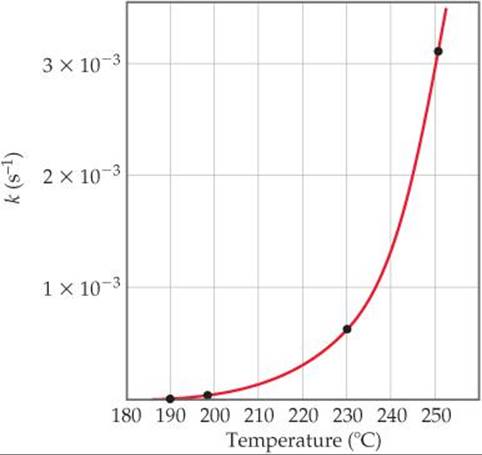
![]() FIGURE 14.14 Temperature dependence of the rate constant for methyl isonitrile conversion to acetonitrile. The four points indicated are used in Sample Exercise 14.11.
FIGURE 14.14 Temperature dependence of the rate constant for methyl isonitrile conversion to acetonitrile. The four points indicated are used in Sample Exercise 14.11.
The Collision Model
Reaction rates are affected both by reactant concentrations and by temperature. The collision model, based on the kinetic-molecular theory ![]() (Section 10.7), accounts for both of these effects at the molecular level. The central idea of the collision model is that molecules must collide to react. The greater the number of collisions per second, the greater the reaction rate. As reactant concentration increases, therefore, the number of collisions increases, leading to an increase in reaction rate. According to the kinetic-molecular theory of gases, increasing the temperature increases molecular speeds. As molecules move faster, they collide more forcefully (with more energy) and more frequently, increasing reaction rates.
(Section 10.7), accounts for both of these effects at the molecular level. The central idea of the collision model is that molecules must collide to react. The greater the number of collisions per second, the greater the reaction rate. As reactant concentration increases, therefore, the number of collisions increases, leading to an increase in reaction rate. According to the kinetic-molecular theory of gases, increasing the temperature increases molecular speeds. As molecules move faster, they collide more forcefully (with more energy) and more frequently, increasing reaction rates.
For a reaction to occur, though, more is required than simply a collision. For most reactions, only a tiny fraction of collisions leads to a reaction. For example, in a mixture of H2 and I2 at ordinary temperatures and pressures, each molecule undergoes about 1010 collisions per second. If every collision between H2 and I2 resulted in the formation of HI, the reaction would be over in much less than a second. Instead, at room temperature the reaction proceeds very slowly because only about one in every 1013 collisions produces a reaction. What keeps the reaction from occurring more rapidly?
The Orientation Factor
In most reactions, molecules must be oriented in a certain way during collision for a reaction to occur. The relative orientations of the molecules during collision determine whether the atoms are suitably positioned to form new bonds. For example, consider the reaction
Cl + NOCl → NO + Cl2
which takes place if the collision brings Cl atoms together to form Cl2, as shown at the top in ![]() FIGURE 14.15. In contrast, the collision shown at the bottom in this figure is ineffective and does not yield products.
FIGURE 14.15. In contrast, the collision shown at the bottom in this figure is ineffective and does not yield products.
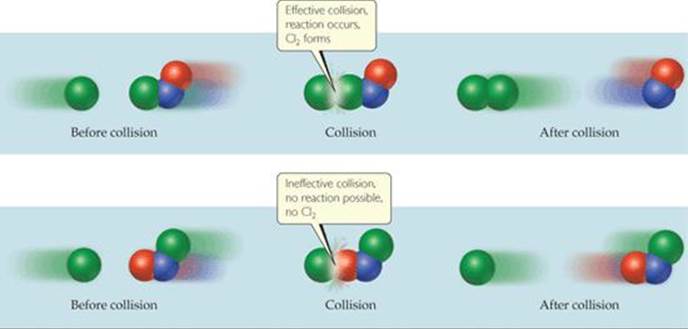
![]() FIGURE 14.15 Molecular collisions may or may not lead to a chemical reaction between Cl and NOCl.
FIGURE 14.15 Molecular collisions may or may not lead to a chemical reaction between Cl and NOCl.
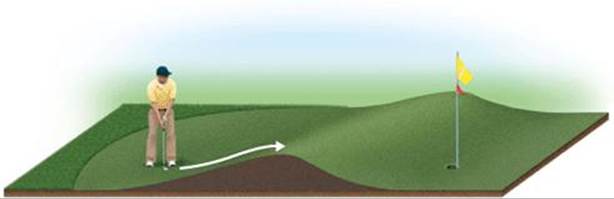
![]() FIGURE 14.16 Energy is needed to overcome a barrier between initial and final states.
FIGURE 14.16 Energy is needed to overcome a barrier between initial and final states.
Activation Energy
In addition to molecular orientation during collisions, another factor is usually even more important in determining whether a particular collision results in reaction. In 1888 the Swedish chemist Svante Arrhenius suggested that molecules must possess a certain minimum amount of energy to react. According to the collision model, this energy comes from the kinetic energies of the colliding molecules. Upon collision, the kinetic energy of the molecules can be used to stretch, bend, and ultimately break bonds, leading to chemical reactions. That is, the kinetic energy is used to change the potential energy of the molecule. If molecules are moving too slowly—in other words, with too little kinetic energy—they merely bounce off one another without changing. The minimum energy required to initiate a chemical reaction is called the activation energy, Ea, and its value varies from reaction to reaction.
The situation during reactions is analogous to that shown in ![]() FIGURE 14.16. The player needs to move his ball over the hill in the direction of the cup. The hill is a barrier between ball and cup. To reach the cup, the player must impart enough kinetic energy with the putter to move the ball to the top of the barrier. If he does not impart enough energy, the ball will roll partway up the hill and then back down toward him. In the same way, molecules require a certain minimum energy to break existing bonds during a chemical reaction. We can think of this minimum energy as an energy barrier. In the rearrangement of methyl isonitrile to acetonitrile, for example, we might imagine the reaction passing through an intermediate state in which the N≡C portion of the methyl isonitrile molecule is sideways:
FIGURE 14.16. The player needs to move his ball over the hill in the direction of the cup. The hill is a barrier between ball and cup. To reach the cup, the player must impart enough kinetic energy with the putter to move the ball to the top of the barrier. If he does not impart enough energy, the ball will roll partway up the hill and then back down toward him. In the same way, molecules require a certain minimum energy to break existing bonds during a chemical reaction. We can think of this minimum energy as an energy barrier. In the rearrangement of methyl isonitrile to acetonitrile, for example, we might imagine the reaction passing through an intermediate state in which the N≡C portion of the methyl isonitrile molecule is sideways:
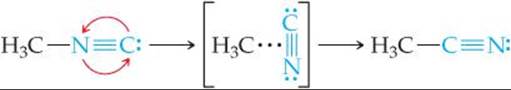
![]() FIGURE 14.17 shows that energy must be supplied to stretch the bond between the H3C group and the N≡C group to allow the N≡C group to rotate. After the N≡C group has twisted sufficiently, the C—C bond begins to form, and the energy of the molecule drops. Thus, the barrier to formation of acetonitrile represents the energy necessary to force the molecule through the relatively unstable intermediate state, analogous to forcing the ball in Figure 14.16 over the hill. The difference between the energy of the starting molecule and the highest energy along the reaction pathway is the activation energy, Ea. The molecule having the arrangement of atoms shown at the top of the barrier is called either the activated complex or the transition state.
FIGURE 14.17 shows that energy must be supplied to stretch the bond between the H3C group and the N≡C group to allow the N≡C group to rotate. After the N≡C group has twisted sufficiently, the C—C bond begins to form, and the energy of the molecule drops. Thus, the barrier to formation of acetonitrile represents the energy necessary to force the molecule through the relatively unstable intermediate state, analogous to forcing the ball in Figure 14.16 over the hill. The difference between the energy of the starting molecule and the highest energy along the reaction pathway is the activation energy, Ea. The molecule having the arrangement of atoms shown at the top of the barrier is called either the activated complex or the transition state.
![]() GO FIGURE
GO FIGURE
How does the energy needed to overcome the energy barrier compare with the overall change in energy for this reaction?
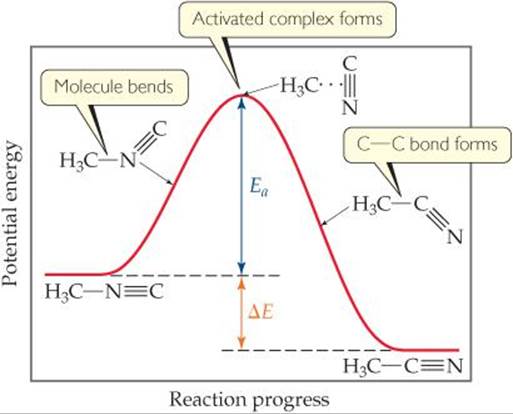
![]() FIGURE 14.17 Energy profile for conversion of methyl isonitrile (H3CNC) to its isomer acetonitrile (H3CCN).
FIGURE 14.17 Energy profile for conversion of methyl isonitrile (H3CNC) to its isomer acetonitrile (H3CCN).
The conversion of H3C—N≡C to H3C—C≡N is exothermic. Figure 14.17 therefore shows the product as having a lower energy than the reactant. The energy change for the reaction, ΔE, has no effect on reaction rate, however. The rate depends on the magnitude of Ea; generally, the lower the value of Ea is, the faster the reaction.
Notice that the reverse reaction is endothermic. The activation energy for the reverse reaction is equal to the energy that must be overcome if approaching the barrier from the right: ΔE + Ea.
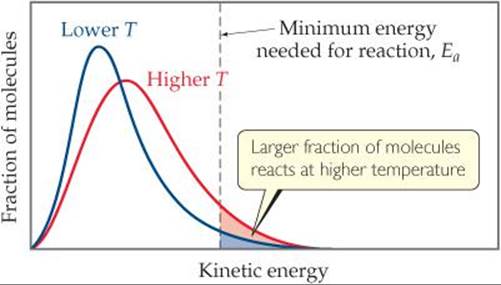
![]() FIGURE 14.18 The effect of temperature on the distribution of kinetic energies of molecules in a sample.
FIGURE 14.18 The effect of temperature on the distribution of kinetic energies of molecules in a sample.
Any particular methyl isonitrile molecule acquires sufficient energy to overcome the energy barrier through collisions with other molecules. Recall from the kinetic-molecular theory of gases that, at any instant, gas molecules are distributed in energy over a wide range. ![]() (Section 10.7)
(Section 10.7) ![]() FIGURE 14.18 shows the distribution of kinetic energies for two temperatures, comparing them with the minimum energy needed for reaction, Ea. At the higher temperature a much greater fraction of the molecules have kinetic energy greater than Ea, which leads to a greater rate of reaction.
FIGURE 14.18 shows the distribution of kinetic energies for two temperatures, comparing them with the minimum energy needed for reaction, Ea. At the higher temperature a much greater fraction of the molecules have kinetic energy greater than Ea, which leads to a greater rate of reaction.
![]() GIVE IT SOME THOUGHT
GIVE IT SOME THOUGHT
Suppose we have two reactions, A → B and B → C. You can isolate B, and it is stable. Is B the transition state for the reaction A → C?
The fraction of molecules that have an energy equal to or greater than Ea is given by the expression
![]()
In this equation R is the gas constant (8.314 J/mol-K) and T is the absolute temperature. To get an idea of the magnitude of f, let's suppose that Ea is 100 kJ/mol, a value typical of many reactions, and that T is 300 K. The calculated value of f is 3.9 × 10⁻¹⁸, an extremely small number! At 310 K, f = 1.4 × 10⁻¹⁷. Thus, a 10-degree increase in temperature produces a 3.6-fold increase in the fraction of molecules possessing at least 100 kJ/mol of energy.
![]() GIVE IT SOME THOUGHT
GIVE IT SOME THOUGHT
In a chemical reaction, why does not every collision between reactant molecules result in formation of a product molecule?
The Arrhenius Equation
Arrhenius noted that for most reactions the increase in rate with increasing temperature is nonlinear (Figure 14.14). He found that most reaction-rate data obeyed an equation based on (a) the fraction of molecules possessing energy Ea or greater, (b) the number of collisions per second, and (c) the fraction of collisions that have the appropriate orientation. These three factors are incorporated into the Arrhenius equation:
![]()
In this equation k is the rate constant, Ea is the activation energy, R is the gas constant (8.314 J/mol-K), and T is the absolute temperature. The frequency factor, A, is constant, or nearly so, as temperature is varied. This factor is related to the frequency of collisions and the probability that the collisions are favorably oriented for reaction.* As the magnitude of Ea increases, k decreases because the fraction of molecules that possess the required energy is smaller. Thus, reaction rates decrease as Ea increases.
SAMPLE EXERCISE 14.10 Relating Energy Profiles to Activation Energies and Speeds of Reaction
Consider a series of reactions having these energy profiles:
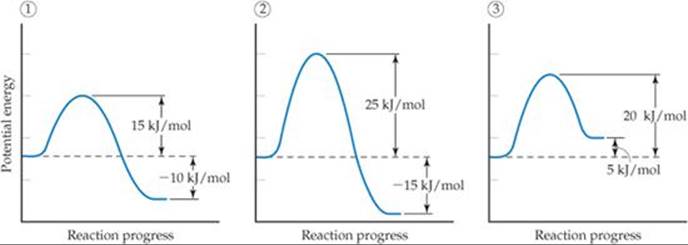
Rank the reactions from slowest to fastest assuming that they have nearly the same value for the frequency factor A.
SOLUTION
The lower the activation energy, the faster the reaction. The value of ΔE does not affect the rate. Hence, the order from slowest reaction to fastest is 2 < 3 < 1.
PRACTICE EXERCISE
Rank the reverse reactions from slowest to fastest.
Answer: 2 < 1 < 3 because, if you approach the barrier from the right, the Ea values are 40 kJ/mol for reverse reaction 2, 25 kJ/mol for reverse reaction 1, and 15 kJ/mol for reverse reaction 3.
Determining the Activation Energy
We can calculate the activation energy for a reaction by manipulating the Arrhenius equation. Taking the natural log of both sides of Equation 14.19, we obtain
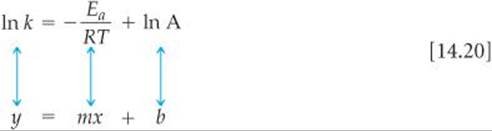
which has the form of the equation for a straight line. A graph of ln k versus 1/T is a line with a slope equal to –Ea/R and a y-intercept equal to ln A. Thus, the activation energy can be determined by measuring k at a series of temperatures, graphing ln k versus 1/T, and calculating Ea from the slope of the resultant line.
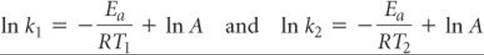
We can also use Equation 14.20 to evaluate Ea in a nongraphical way if we know the rate constant of a reaction at two or more temperatures. For example, suppose that at two different temperatures T1 and T2 a reaction has rate constants k1 and k2. For each condition, we have
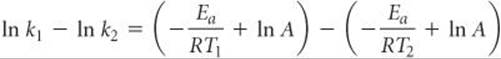
Subtracting ln k2 from ln k1 gives
Simplifying this equation and rearranging give
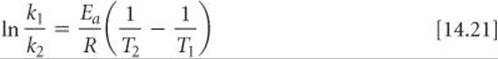
Equation 14.21 provides a convenient way to calculate a rate constant k1 at some temperature T1 when we know the activation energy and the rate constant k2 at some other temperature T2.
SAMPLE EXERCISE 14.11 Determining the Activation Energy
The following table shows the rate constants for the rearrangement of methyl isonitrile at various temperatures (these are the data points in Figure 14.14):
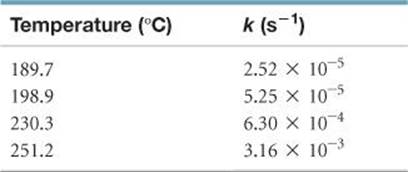
(a) From these data, calculate the activation energy for the reaction. (b) What is the value of the rate constant at 430.0 K?
SOLUTION
Analyze We are given rate constants, k, measured at several temperatures and asked to determine the activation energy, Ea, and the rate constant, k, at a particular temperature.
Plan We can obtain Ea from the slope of a graph of ln k versus 1/T. Once we know Ea, we can use Equation 14.21 together with the given rate data to calculate the rate constant at 430.0 K.
Solve
(a) We must first convert the temperatures from degrees Celsius to kelvins. We then take the inverse of each temperature, 1/T, and the natural log of each rate constant, ln k. This gives us the table shown at the right:
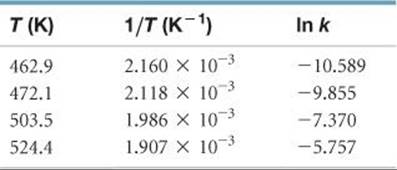
A graph of ln k versus 1/T is a straight line (![]() FIGURE 14.19).
FIGURE 14.19).

![]() FIGURE 14.19 Graphical determination of activation energy Ea.
FIGURE 14.19 Graphical determination of activation energy Ea.
The slope of the line is obtained by choosing any two well-separated points and using the coordinates of each:
![]()
Because logarithms have no units, the numerator in this equation is dimensionless. The denominator has the units of 1/T, namely, K–1. Thus, the overall units for the slope are K. The slope equals –Ea/R. We use the value for the gas constant R in units of J/mol-K (Table 10.2). We thus obtain
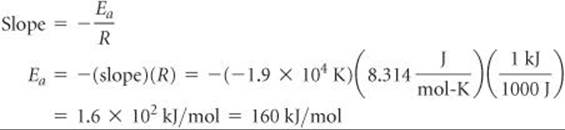
We report the activation energy to only two significant figures because we are limited by the precision with which we can read the graph in Figure 14.19.
(b) To determine the rate constant, k1, at T1 = 430.0 K, we can use Equation 14.21 with Ea = 160 kJ/mol and one of the rate constants and temperatures from the given data, such as k2 = 2.52 × 10⁻⁵ s–1 and T2 = 462.9 K:
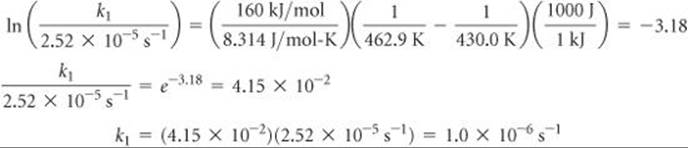
Thus,
Note that the units of k1 are the same as those of k2.
PRACTICE EXERCISE
Using the data in Sample Exercise 14.11, calculate the rate constant for the rearrangement of methyl isonitrile at 280 °C.
Answer: 2.2 × 10⁻² s–1