CHEMICAL BIOLOGY
Pharmacokinetics of Drug Candidates, Determination of
Ronald E. White, Schering-Plough Research Institute, Kenilworth, New Jersey
doi: 10.1002/9780470048672.wecb644
Pharmacokinetics is a mathematically based discipline that describes the time course of uptake, distribution, and elimination of a drug in an organism. This article explains the physiologic basis and clinical interpretation of the various pharmacokinetic parameters, such as half-life, clearance, and oral bioavailability. Because of the central importance of pharmacokinetics to the clinical use of drugs, the determination of pharmacokinetics is required at several points in the research and development cycle of new drug candidates. The rationale and methods of determination are discussed.
The therapeutic effectiveness of drugs generally can be related to the concentrations achieved at the physiologic site of action and to the length of time that effective concentrations are maintained (1, p. 1). For instance, molecules of an antibiotic must reach the site of infection (e.g., inner ear, lung, or bladder) to interact with the molecular target (typically an enzyme) in the infecting bacteria. Similarly, cough suppression or relief of clinical depression may require a medicine to penetrate the blood-brain barrier to access molecular targets (typically pharmacologic receptors) in the central nervous system. Therefore, an assessment of the effectiveness of the therapy partly depends on our ability to monitor concentrations of the drug in these organs. However, because often it is not feasible to measure intraorgan concentrations of drugs directly, we usually measure blood concentrations and then infer the corresponding tissue concentrations by using predetermined relationships for the particular drug and organ in question. In practice, we establish the blood concentration that corresponds to the actual tissue concentration necessary for therapeutic effectiveness for each clinical drug, which allows us to discuss therapy in terms of blood concentrations only without reference to tissue levels. A useful clinical drug must exhibit several practical characteristics (2): efficacy (the intrinsic ability of the compound to produce a desired pharmacologic effect), availability (the ability of the compound to reach the target organ), safety (the sufficient selectivity at the therapeutic dose so that undesirable pharmacologic actions are acceptably mild), and persistence (the sufficient residence time in the body to allow a clinically useful duration of action, usually expressed as the plasma elimination half-life).
Pharmacokinetics (PK) is a mathematically based scientific discipline that describes the time course of uptake, distribution, and elimination of a drug in an organism. A central goal of PK is to determine the length of time that target pharmaceutical receptors are exposed to pharmacologically effective concentrations of the drug molecules. Therefore, PK is of the utmost importance in understanding drug action, especially the duration of action, optimal dose size, individual variation in response, interactions between drugs, and developed resistance or tolerance to drugs.
Clinical Pharmacokinetics
The following discussion addresses only small-molecule drugs, chemical compounds with molecular weights less than 1,000 Daltons. Large-molecule drugs (biologics) such as vaccines, cytokines, antibodies, and genes also can be studied by the methods of pharmacokinetics, but they are distributed and cleared in fundamentally different ways than small molecules. (3, 4).
Dose and administration
Dose refers to the amount of the drug to be administered to the patient and may be expressed in several ways. The most common form is the amount (expressed in milligrams) taken in an oral formulation such as a tablet, capsule, or syrup. Often, the formulation is provided by the manufacturer in several dose strengths, such as 10, 25, and 50 mg. Some medicines are delivered by a parenteral route such as inhalation, topical, subcutaneous, or intravenous to deliver the medicine more directly to the target organ, to control the rate of delivery, or to substitute for when oral dosing is impractical. Depending on the rate of elimination of the drug from the body, additional doses are administered at intervals to maintain adequate therapeutic blood levels. Because the presence of food in the gastrointestinal tract may affect the absorption of some drugs, the patient may be instructed to take the drug either with or between meals. Thus, a dosing regimen refers to a particular dose strength in a particular formulation given at a particular interval or time-of day in relation to meals, such as a 10-mg tablet taken once a day after dinner.
Meaning and interpretation of pharmacokinetic parameters
Plasma, the fluid component of blood left after the separation of cells, commonly is used for pharmacokinetic determinations. Figure 1 illustrates the time course of drug concentrations in plasma following either an intravenous (iv) or an oral (po) dose of a hypothetical drug. In the case of the iv bolus dose, the drug is delivered completely to the bloodstream essentially instantaneously and then concentrations immediately begin to decline as the drug distributes within and is eliminated from the body (see the dashed curve in Fig. 1). The solid curve shows the drug concentration profile for the same dose given orally. In this case, because the drug first must be absorbed from the gastrointestinal tract to reach the blood, concentrations initially rise (absorption phase); however, when the rate of absorption equals the rate of elimination, the input and output processes reach a balance and the peak concentration (Cmax) is seen. Thereafter, when absorption is complete and only the elimination process is left, the elimination phase is reached and concentrations decline as the body acts to remove the drug.

Figure 1. Plasma concentration time profiles for a single 42-mg dose of a hypothetical drug with a half-life of 8 hours, Vd 42 liters, and oral bioavailability of 80%. Dashed curve: intravenous bolus dose. Solid curve: oral dose. Dotted horizontal lines represent plasma concentrations required for efficacy (green) and for the onset of adverse events (red).
During the absorption phase, the plasma concentration attains the minimum therapeutic threshold accompanied by onset of the efficacious effect. A desirable medicine has a large window between the efficacious concentration and a concentration that produces undesirable side effects (adverse event threshold). As concentrations fall after Cmax, the duration of effect is determined by the time above the therapeutic threshold. Thus, the illustrated drug loses effect after about 12 hours and requires a second dose by that time.
PK usually is expressed in several quantitative, clinically meaningful parameters, including half-life (T1/2), area under the plasma concentration versus time curve (AUC), oral bioavailability (F), volume of distribution (Vd), clearance (CL), maximum observed plasma concentration (Cmax), time after dose administration that Cmax occurs (Tmax), and minimum concentration between successive doses (Cmin).
T1/2 describes the persistence of the drug in the body. An ideal drug follows first-order kinetics for elimination from the body (1, p. 21) so that a constant fraction is eliminated in fixed time intervals. It is convenient to select 50% as the constant fraction eliminated and to express the time required as T1/2. Thus, at one half-life after dosing, half of the drug has been eliminated; at two half-lives, 75% has been eliminated; at three half-lives, 87.5% has been eliminated, and so forth. A property of first-order declines is that a plot of the natural logarithm of the amount remaining versus time is linear with the slope equal to -0.693/T1/2, providing a straightforward means to determine half-life (Fig. 2). For many therapeutic indications, a half-life long enough (12-24 hours) to allow once-a-day dosing is desirable for the obvious reasons of patient convenience and compliance. Because many drugs do not exhibit ideal kinetics and do not follow a simple log-linear decline, we may use an operational parameter called effective half-life, which usefully approximates the decline in blood concentrations over most of the elimination curve (5).

Figure 2. Plasma concentration time profiles for the drug in Fig. 1 displayed with a logarithmic scale for plasma concentration. Dashed curve: intravenous dose. Solid curve: oral dose. The half-life may be calculated from the slope. Note that the concentration values first must be converted to the natural logarithms. T1/2 = 0.693 / [(ln 100 - ln 12) / 24 hour] = 8 hours.
Most drugs are given multiple times in a course of therapy so that when the second dose is taken a portion of the first dose still exists in the body and the Cmax achieved by the second dose will be that much higher than the first. A similar carryover will occur between the second and third doses, which makes the third Cmax even higher. However, as blood concentrations rise, the rate of elimination rises proportionally (a direct consequence of first-order kinetics). Thus, the tendency of the drug level to rise because of the incomplete elimination from sequential doses is compensated for by a rising elimination rate, which results after several doses in a balanced situation called steady state in which the same Cmax and Cmin values are observed after each successive dose (Fig. 3). The time-weighted average of plasma concentrations over a single dosing interval at steady state (Cave, SS) is higher than that on the first dose, and the ratio of these two is called the Accumulation Index (R) (1, p. 87). A successful dosing regimen will keep Cmin, SS well above the therapeutic threshold at all times while never allowing Cmax, SS to approach the adverse event threshold.

Figure 3. Plasma concentration time profiles for repeated oral doses of the drug given every 8 hours, which illustrates the approach of the plasma concentrations to steady state.

Figure 4. Estimation of the total AUC for an oral dose of the drug by use of the Trapezoidal Rule. Vertical lines from measured concentration time points define a family of trapezoids; the sum of the areas of these trapezoids approximates the area under the curve. The area beyond the last time point (24 hour) is estimated by multiplying the last measured concentration by the factor T1/2 / 0.693; Area (24-infinity) = Cfinal time x T1/2 / 0.693.
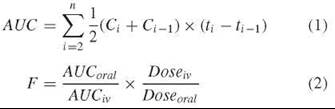
AUC is a measure of the total exposure of the body to the drug and can be estimated as the sum of the areas of a series of trapezoids formed between successive measured concentration time points (Fig. 4 and Equation 1) (1, p. 469). Because a drug may not necessarily be completely absorbed or may undergo presystemic metabolism or other elimination during the absorption process, the related parameter F indicates the fraction of an orally administered dose that actually reaches the systemic circulation. As a practical matter, F, which usually is expressed as a percentage, is calculated as the ratio of the AUC measured from an oral dose to the AUC from an equivalent intravenous dose that is delivered completely to the bloodstream (Equation 2) (1, p. 42). Because two different drugs generally have different Cmax values, bioavailabilities, and half-lives, the observed exposures (i.e., AUCs) will be different even though equal doses of the drugs may have been given.
Vd measures the volume of plasma in which the drug appears to be dissolved and is calculated by dividing the amount of drug in the body by the observed concentration in plasma at that time (Equation 3) (1, p. 20). For a drug that is confined to the plasma compartment, Vd is the volume of plasma in the body [ca. 3 liters (L) in humans] (6). A drug that freely passes into and out of the cells of tissues will have a Vd value of about 42 L (i.e., nominal total body water for an adult human) (6). However, many drugs show Vd values that are much greater than 42 L, which cannot correspond to any physiologic compartment. In these cases, the drug must be sequestered significantly outside of the plasma compartment into organs and tissues. For this reason, Vd sometimes is called the apparent volume of distribution. Because it is difficult to know at any moment the exact amount of drug in the body because of continuous elimination, we usually cannot apply Equation 3 directly to determine Vdand we must use an indirect method (see below).
![]()
Finally, CL describes how quickly the drug is eliminated completely from plasma or blood and has the units of volume per unit time. CL is calculated easily from the plasma AUC observed for a given dose (Equation 4) (1, p. 37). For an intravenous dose F = 1, Equation 4 simplifies to CL = Dose/AUC. For an oral dose, if the bioavailability is not known, then the Dose/AUC calculation yields CL/F rather than the true clearance.
![]()
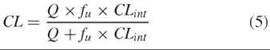
CL is a useful working concept because it is related to the passage of drug-containing blood through a clearance organ such as liver or kidney. A drug that is cleared only by the liver (by liver metabolism, for instance) can be cleared only as fast as blood flows to the liver. This mass transport limitation is expressed in Equation 5 (1, p. 166), where Q is the total blood flow to the liver [about 1.4 L per minute (min)] (1, p. 138), CLint is the intrinsic ability of the liver to clear the drug if blood flow were not a limitation, and fu is the fraction of the drug not bound to proteins in plasma (7). We can see from Equation 5 that in the two extreme cases, CL is equal to CLint when CLint is small compared with Q, and CL is equal to Q when CLint is large compared with Q.
Similarly, renal clearance is limited ultimately by kidney blood flow (ca. 1,100 mL/min) (1, p. 138). Clearance by kidneys comprises three processes: glomerular filtration, the rate at which the kidneys filter plasma (ca. 120 mL/min) (1, p. 169); direct secretion of drugs into urine; and reabsorption of drugs from urine back into blood. A final useful characteristic of clearance is that it is additive. In other words, the total systemic clearance is the sum of the individual organ clearances. For instance, for a drug that has both hepatic and renal routes of elimination, CLtot = CLh + CLr. Such a drug still can be cleared, albeit more slowly, in patients with either liver or kidney failure.
For an ideal, so-called one-compartment drug (i.e., one that is in rapid equilibrium with all tissues), the parameters half-life, clearance, and volume of distribution are interrelated by Equation 6 (1, p. 24). Because half-life and clearance can be determined independently, it is possible to calculate Vd. Equation 6 shows that two drugs that have the same volume of distribution but different clearances will have different half-lives, which means that one drug will maintain plasma concentrations longer than the other and may need less frequent dosing.
![]()
As mentioned above, many drugs do not conform to the simple one-compartment model. These cases may require a two- or three-compartment model characterized by a bi- or tri-exponential decline (8). Alternatively, a simpler, commonly used approach is noncompartmental analysis, in which the concentration time profile is treated descriptively by the method of statistical moments (9). Whereas CL has exactly the same definition in noncompartmental analysis, persistence in the body is described by a new parameter, mean residence time (MRT, the average time that an drug molecule resides in the body) rather than terminal elimination half-life. For many drugs, MRT is a better indicator of the clinically effective duration. The difference between MRT values for oral and intravenous doses gives a descriptor of the rate of intestinal absorption called the mean absorption time (MAT). Noncompartmental analysis also defines a new volume parameter, Vdss, the volume of distribution at steady state, which is useful for calculations of plasma levels after multiple dosing or during intravenous infusion. A second descriptor of volume, Vz, represents the volume of distribution during the terminal elimination phase and is calculated exactly the same as Vd in the one-compartment model (see Equation 6). Vz usually is different from Vdss and seldom is used in clinical dosing regimen considerations.
Role of PK in the Drug Discovery and Development Process
Basic research elucidates the complex biochemical events that comprise a biologic process, such as the regulation of blood glucose, and identifies key control points that are mediated by enzymes or receptors. Most drugs exert their pharmacologic action by modulating the activity of one of these enzymes or receptors within cells of the abnormally functioning organ. So, the next step in the drug discovery process is lead generation, the design or discovery of a small molecule that will bind to the molecular target to modulate its activity. Once a lead has been generated, medicinal chemists typically synthesize thousands of analogs by systematically varying the structure to create a compound that has been optimized with respect to potency and selectivity toward the molecular target, PK characteristics, and safety. This compound then is designated as a clinical candidate, and it enters the development process (10).
Given the importance of PK in the clinical use of drugs, a suitable human PK profile is an important criterion in the selection from many discovery compounds of a single candidate for advancement to clinical development. Therefore, contemporary drug discovery screening of compounds includes pharmacologic potency, selectivity, and PK properties in the acceptable range for the medical indication (11). Because drug discovery normally takes place before the clinical phase, the human PK characteristics of a drug candidate must be inferred from in vivo animal models or from various human-derived in vitro systems (12).
PK screening
In vitro studies
Because clearance at the whole-body level often is determined by metabolism at the cellular level, it is possible to use a variety of human-derived in vitro systems to determine rates of metabolism. These systems include pure human enzymes (such as cytochrome P450 enzymes) (13) and human liver subcellular fractions (S 9 and microsomes) (14). However, with enzymes and subcellular fractions, some information is lost because the whole-cell integration of subcellular processes has been disrupted. The use of cultured human hepatocytes retains the whole-cell integration at the expense of greater experimental complexity (15). Each system provides a different window on the metabolic processes, is relatively easy to use, and can be obtained from commercial sources. Rates and pathways of metabolism may be compared with a series of discovery compounds to identify those with the greatest relative metabolic stability or with a benchmark compound of known human PK characteristics to provide a more absolute estimate of hepatic metabolic clearance.
In vivo studies
PK studies in typical laboratory animals (typically mice, rats, dogs, or monkeys) are useful because they directly determine the various PK parameters discussed above, which affords an understanding of the whole-body characteristics of absorption, distribution, metabolism, and elimination. Because these translate with some fidelity to humans, animal PK commonly is used to assess the PK acceptability of discovery compounds. Unfortunately, these studies tend to be too slow to permit rapid evaluation of dozens or hundreds of discovery compounds. Therefore, two modifications have been introduced that provide whole-body relevance with rates of screening that are sufficient to keep pace with the production of favorable discovery drug candidates (16).
The first modification, cassette dosing, is based on the simultaneous dosing of several compounds to the animals, which thereby provides in vivo PK information of the several candidates in parallel (17). Unfortunately, cassette dosing has a limitation of potential drug-drug interactions, which possibly distorts the PK parameters (18). The second modification, Rapid Rat Assay, uses a highly regimented process of single-compound dosing of several discovery compounds to several rats in parallel (19). Because each animal receives only one compound, drug-drug interactions are avoided. The Rapid PK procedure can be applied to dogs and monkeys as well but with lower throughput than with rats. The combination of human in vitro and animal in vivo assessment of PK works well to screen out compounds with unsuitable PK properties.
Clinical candidate nomination
Once a discovery compound has been identified with overall “drug-like” characteristics (good potency, selectivity, safety, and PK), that compound will be selected for advancement into clinical development. The next important PK activity is the quantitative projection of the human PK (20, pp. 207-228). Such information is useful for the planning of the preclinical and clinical development programs. Equation 6 can be used to estimate the clinical half-life if we can estimate CL and Vd. Two approaches can be used to estimate CL.
First, if the compound was cleared mainly by hepatic metabolism in the animal species tested and if human hepatocytes in vitro suggest the same will be true in humans, then the measured hepatocyte clearance may be used in a process called in vitro/in vivo scaling (20, pp. 207-228) to provide an estimate of the human intrinsic clearance. The application of Equation 5 then gives an estimate of the human systemic clearance. Second, the animal PK parameters of CL and Vd can be subjected to allometric scaling (20, pp. 207-228) whereby the PK parameter is related to a measurable allometric variable such as body mass, body surface area, heart rate, and so forth. (21) by fitting these parameter-variable pairs for several species to an empirical power equation of the form
![]()
where α and β are adjustable constants. A common application is to scale CL according to body mass.
![]()
Both CL and Vd from the animal PK studies may be scaled allometrically to provide the estimates of human CL and Vd needed to project the human half-life. In addition to calculating the half-life, one also can estimate the human therapeutic dose if the blood levels that correspond to efficacy in a relevant animal pharmacologic model have been measured. The AUC measured in the animal model can be equated with the AUC needed for efficacy in humans, and then the application of Equation 4 with the estimated human CL gives an estimated human dose. For drugs intended for oral administration, the bioavailability F often is assumed to lie in the range between the lowest and highest values observed in the animal species tested. These projected human PK parameters need not be extremely accurate to be useful for planning.
Preclinical development
Before a new chemical entity can be tested in humans, its safety in various in vitro and in vivo pharmacologic and toxicity tests must be assessed (22). This assessment includes an administration of high doses to animals (typically mice or rats and larger animals such as dogs or monkeys) and in vitro tests of genotoxic potential (such as the Ames test). PK normally will be determined in the animal species to be used for safety testing to assess the relationship between the oral dose and the exposure for dose selection and to select time points for the monitoring of exposure during the safety studies. In parallel with the safety testing, a large-scale chemical synthetic process must be developed to produce tens of kilograms of the drug candidate to enable clinical trials. Finally, a clinical formulation must be devised to allow adequate and reproducible exposure in the clinical trials, and animal PK studies are helpful in the selection process. These studies usually examine Cmax, Tmax, and AUC for several possible formulations to allow matching to the desired clinical delivery profile. Data from the discovery and preclinical activities form the basis of a petition to government health authorities for permission to begin testing in humans. Once this dossier, called the Investigational New Drug Application (IND) in the United States, is approved, clinical trials may proceed (23). Information about the IND and other regulatory guidelines and documentation is available through the web link to the United States Food and Drug Administration at the end of this article.
Clinical development
Clinical trials are divided formally into four distinct but temporally overlapping phases, defined by the objectives of each phase (24). Phase I tests the safety and tolerability of the drug candidate in normal healthy volunteer subjects. An important goal is to determine the maximum dose that may be safely given to people. An additional goal is the determination of the pharmacokinetic parameters, which are needed to plan the next phases. Phase II investigates whether the candidate modulates the pharmacologic target in ten to twenty patients (proof of activity) and whether this activity actually results in the desired therapeutic benefit (proof of concept). Also, the optimum dose is determined based on balancing benefit and safety. With an optimized dose identified, Phase III tests the drug in much larger groups of patients to establish the comprehensive clinical profile of the candidate, including confirming the therapeutic benefit with adequate statistics and investigating the variation of therapeutic response and the safety in various severities of the disease and in special populations such as ethnic groups or comorbidities. Phase IV usually occurs after the drug has been approved and is on the market and involves testing even larger populations for longer periods of time and testing against additional disease indications.
Phase I
Human PK is determined for the first time in Phase I, initially as a series of single doses escalated through several dose levels to establish the dose-exposure relationship and also the half-life. Because an oral dose may have an extended period of absorption, it is not possible to get the true clearance or volume of distribution from an oral dose; a confounding with bioavailability may occur. Furthermore, sometimes absorption is slower than elimination and a phenomenon known as “flip-flop kinetics” occurs in which the observed half-life really is a reflection of absorption and not elimination. Thus, when feasible, an intravenous dose is given to allow absolute oral bioavailability and the true values of total clearance, renal clearance, volume of distribution, and half-life to be determined. Administration of an intravenous dose requires the development of a sterile solution formulation and acute intravenous animal safety studies and may not be possible always with poorly soluble drugs. The next step is multiple dosing at several dose levels within the range determined to be safe from the single-dose study. In addition to more investigation of clinical safety, the main PK purpose of multiple dosing is to establish how many doses are required to reach steady state and what steady state Cmax and Cmin values are reached. A well-behaved drug will reach steady state in about five doses (see Fig. 3), and a general rule is that if doses are given at intervals of one half-life, then the steady state Cmax will be about twice that following a single dose (25, p. 123). Dosing more frequently than the half-life results in a more than twofold accumulation, and dosing less frequently than the half-life results in a less than twofold accumulation. The average plasma level to be expected at steady state can be calculated by Equation 9 where T is the dosing interval (1, p. 85),
![]()
or can be determined from a numerical simulation using the Principle of Superposition (25, pp. 451-457). Importantly, a significant deviation of the accumulation index R-value from that predicted by the single-dose PK indicates a time-dependent alteration of clearance. For example, continuing exposure of the body to some drugs causes an adaptive response called autoinduction in which drug-metabolizing enzymes are upregulated to allow the body to eliminate the drug more rapidly (26). Such a drug would then show an R-value of less than one, which means that subsequent doses would lead to lower Cmax and AUC values. It is possible for autoinduction to be so severe that the drug becomes ineffective after a few doses. The opposite situation, although it is rare, also can occur; that is, R values can be much larger than expected, which means that when multiple dosing, the body becomes less able to clear the drug and plasma levels continue to rise. Greater-than-expected accumulation usually indicates some form of toxicity, such as organ toxicity or irreversible inhibition of clearance enzymes. The cytochrome P450 enzyme designated CYP3A4 is especially susceptible to irreversible inhibition (27), so the discovery process usually includes a screen for this type of behavior to prevent such compounds from reaching the clinic. Again, this type of nonideal PK behavior could be enough to cause the drug candidate to be clinically unusable.
Additional Phase I PK studies include the determination of the effect of food on orally administered drugs (28), formulation testing (29), detection of circulating metabolites of the drug (30), and checking for PK interactions between coadministered drugs (31). The most common form of drug-drug PK interaction is the competition of the two drugs for the same clearance mechanism, especially the CYP-family of drug-metabolizing enzymes, which results in a limitation on which drugs ultimately can be used clinically with the new agent (32). All clinical PK studies rely on some method of quantitation of drug levels in blood or plasma, and the major bioanalytic technique in use today for this purpose is liquid chromatography coupled to tandemmass spectrometry (LC-MS/MS) (33, 34). Current technology permits the determination of picogram-per-mL levels of a drug in the presence of many interfering substances, with sample-to-sample cycle times less than 2 minutes. Because of individual biologic variability and inevitable experimental error, the measured drug concentrations at each time point will show variation among a group of subjects, which results in the need to express derived pharmacokinetic parameters as a mean value with an associated coefficient of variation (1, p. 203).
In addition to the conventional first-in-human approach described above, another available approach allows rapid access to the clinic to answer specific questions addressable by a single dose in humans. The U.S. Food and Drug Administration allows a sponsor to proceed to limited clinical dosing with an Exploratory IND (35), which has more moderate requirements than the standard IND. Determination of human PK is the most common use of the new approach, which can be thought of as an extension of the discovery process to check human PK before the decision is made to commit full development resources to pursue the conventional IND. One option within the Exploratory IND is microdosing, which has even lower requirements (36, 37). A microdose is defined as no more than 1/100 of the expected therapeutic dose but not exceeding 100 micrograms. The advantages of a microdose are that minimal safety testing is required because only minute quantities of the drug candidate are administered and that large-scale chemical synthesis can be postponed until acceptable clinical PK is confirmed.
Phase II
Although the main goal of Phase II clinical trials is the determination of efficacy toward the disease indication, PK is a fundamental part of this determination because to understand the clinical use of the new drug candidate, it is necessary to determine the temporal relationship between the plasma levels and the pharmacodynamics of the beneficial effect (PK/PD). A secondary PK goal in Phase II is to determine if the disease state affects the PK of the candidate drug compared with the PK observed in healthy subjects.
During the dose range-finding portion of Phase II, several doses are assessed for efficacy in patients with the disease to be treated. The PK sampling at these doses is critical because it allows the construction of a pharmacokinetic/pharmacodynamic (PK/PD) model whereby the observed drug concentrations are used to predict the effect of the drug (20, pp. 189-205; 38). The simplest PK/PD model is the direct or Emax model in which a direct relationship exists between the concentration and the effect; changes in plasma levels are reflected immediately in the pharmacologic response. Often, however, as concentrations increase, eventually the pharmacologic responses reach a peak or nadir and greater increases in concentration result in only a small change in effect. Ideally, the drug candidate is safe enough to dose to the maximal effect. However, it is more common to strike a balance between the magnitude of response and the incidence of adverse side effects. Some drugs follow a more complex PK/PD relationship called the indirect model in which the pharmacologic response temporally lags behind changes in plasma levels (hysteresis). In this model, the response seen from a particular plasma concentration in the declining phase of the PK curve may be much greater than it was for the same plasma concentration during the rising phase of the curve. Hysteresis occurs when the initial stimulus of the drug binding to the receptor is uncoupled in time to the observed clinical response because a biologic cascade of several biochemical or physiologic events must occur for the clinical response to become manifest. After it is determined which type of relationship applies, a theoretical PK/PD model can be fit to the concentration-response data, which thereby generates a quantitative understanding of the action of the drug and the ability to predict the response to be expected in any situation.
With the availability of a PK/PD model, clinical trial simulation (39, 40) can be performed to explore alternative dosing regimens and to help achieve the optimal design of the Phase III program. The inputs for simulation include the number of patients to be tested, the duration of the testing, the potential clinical end points, and most importantly, the dose(s) to be tested. With Monte Carlo methods to simulate the variability in PK and response observed in Phases I and II, hundreds of computer simulations are conducted for each design and dose level to estimate the statistical probability of a successful outcome (i.e., one that meets predetermined end points of efficacy and safety). The goal is to find a design and dose that balances a high likelihood of a successful trial with a low incidence of adverse events. Ideally, this simulation activity is done in collaboration with government health authorities to minimize the approval time for the Phase III design and the chance of a failed Phase III study (41).
Phase III
In Phase III, large-scale trials are mounted with the goal of showing statistically significant benefit against either placebo or, more usually, standard-of-care therapy. The use of many patients affords the opportunity to create a Population PK model for the drug, which is a statistical means to account for individual variation in PK by means of clinically measurable covariates such as age, gender, race, ethnicity, body weight, kidney function, and so forth (42). In this way, the PK characteristics of a particular patient can be estimated before dosing, which allows a rational means to select the dose most likely to provide good benefit while minimizing risk. After Phase III is complete, the sponsor of the drug candidate may submit an application (called the New Drug Application in the United States) for approval to government health authorities of all countries in which marketing is desired (43).
Summary
Pharmacokinetics studies the relationships for a given drug between blood concentrations, uptake, distribution, elimination, pharmacologic effect, and time. Because drugs that require large doses must be dosed frequently; cannot be dosed orally; must be timed in relation to food intake or have strong interactions with other drugs; may have issues of patient compliance, variable response, or toxicity, the pharmacokinetic aspects of the behavior of a drug are critical to its successful clinical use. Accordingly, the scientists who design drugs must use preclinical pharmacokinetic screening methods to maximize the likelihood that a drug candidate is acceptable pharmacokinetically. Correspondingly, the researchers who test the drug in clinical trials must ensure that all aspects of pharmacokinetic behavior have been characterized thoroughly before submitting the drug for approval to regulatory authorities.
References
1. Rowland M, Tozer TN. Clinical Pharmacokinetics. Concepts and Applications. 3rd edition. 1995. Lippincott Williams & Wilkins, Philadelphia, PA.
2. White RE. High-throughput screening in drug metabolism and pharmacokinetic support of drug discovery. Ann. Rev. Pharmacol. Toxicol. 2000; 40:133-157.
3. Lobo ED, Hansen RJ, Balthasar JP. Antibody pharmacokinetics and pharmacodynamics. J. Pharm. Sci. 2004; 93:2645-2668.
4. Ho RJY, Gibaldi M. Biotechnology and Biopharmaceuticals. Transforming Proteins and Genes into Drugs. 2003. John Wiley & Sons, Hoboken, NY.
5. Boxenbaum H, Battle M. Effective half-life in clinical pharmacology. J. Clin. Pharmacol. 1995; 35:763-766.
6. Wilkinson GR. Pharmacokinetics. The dynamics of drug absorption, distribution, and elimination. In: The Pharmacological Basis of Therapeutics. 10 edition. Hardman JG, Limbird LE, Gilman AG, eds. 2001. McGraw-Hill, New York. pp. 3-29.
7. Benet LZ, Hoener B. Changes in Plasma Protein Binding Have Little Clinical Relevance. J. Clin. Pharmacol. Ther. 2002; 71:115-121.
8. Bonate PL. Compartmental models. In: Pharmacokinetics in Drug Development, Volume 1: Clinical Study Design and Analysis. Bonate PL, Howard DR, eds. 2004. AAPS Press, Arlington, VA. pp. 291-320.
9. Muir KT, Gomeni RO. Non-compartmental analysis. In: Pharmacokinetics in Drug Development. Volume 1: Clinical Study Design and Analysis. Bonate PL, Howard DR, eds. 2004. AAPS Press, Arlington, VA. pp. 235-265.
10. Natarajan C, Rohatagi S. Role of preclinical pharmacokinetics in drug development. In: Pharmacokinetics in Drug Development. Volume 2: Regulatory and Development Paradigms. Bonate PL, Howard DR, eds. 2004. AAPS Press, Arlington, VA. pp. 127-161.
11. White RE, A Comprehensive Strategy for ADME Screening in Drug Discovery. pp. 431-450 in Borchardt, Ronald T. Edward H. Kerns Christopher A. Lipinski Dhiren R. Thakker, and Binghe Wang, eds. Pharmaceutical Profiling in Drug Discovery for Lead Selection. 2004. AAPS Press, Arlington, VA, USA.
12. Lin JH. Challenges in drug discovery: lead optimization and prediction of human pharmacokinetics. In: Pharmaceutical Profiling in Drug Discovery for Lead Selection. Borchardt RT, Kerns EH, Lipinski CA, Thakker DR, Wang B, eds. 2004. AAPS Press, Arlington, VA. pp. 293-325.
13. Rodrigues AD. Applications of heterologous expressed and purified human drug-metabolizing enzymes: an industrial perspective. In: Handbook of Drug Metabolism. Woolf TF, ed. 1999. Marcel Dekker, Inc., New York. pp. 279-320.
14. Ekins S, Maenpaa J, Wrighton SA. In Vitro metabolism: subcellular fractions. In: Handbook of Drug Metabolism. Woolf TF, ed. 1999. Marcel Dekker, Inc., New York. pp. 363-399.
15. Sinz MW. In vitro metabolism: hepatocytes. In: Handbook of Drug Metabolism. Woolf TF, ed. 1999. Marcel Dekker, Inc., New York. pp. 401-424.
16. Cox KA, White RE, Korfmacher WA. Rapid determination of pharmacokinetic properties of new chemical entities: in vivo approaches. Comb. Chem. High Throughput Screen. 2002; 5:29-37.
17. Manitpisitkul P, White RE. Whatever happened to cassette-dosing pharmacokinetics? Drug Discov.Today. 2004; 9:652-658.
18. White RE, Manitpisitkul P. Pharmacokinetic theory of cassette dosing in drug discovery screening. Drug Metab. Dispos. 2001; 29:957-966.
19. Korfmacher WA, Cox KA, Ng KJ, Veals J, Hsieh Y, Wainhaus S, Broske L, Prelusky D, Nomeir A, White RE. Cassette-accelerated rapid rat assay: a systematic procedure for the dosing and liquid chromatography/atmospheric pressure ionization tandem mass spectrometric analysis of new chemical entities as part of new drug discovery. Rapid Communicat. Mass Spectrom. 2001; 15:335-340.
20. Kwon Y. Handbook of Essential Pharmacokinetics, Pharmacodynamics and Drug Metabolism for Industrial Scientists. 2001. Kluwer Academic/Plenum Publishers, New York.
21. Davies B, Morris T. Physiological parameters in laboratory animals and humans. Pharmaceut. Res. 1993; 10:1093-1095.
22. Lathia CD, Shah A. First-time-in-man studies. In: Pharmacokinetics in Drug Development. Volume 1: Clinical Study Design and Analysis. Bonate PL, Howard DR, eds. 2004. AAPS Press, Arlington, VA. pp. 3-30.
23. Troetel WM. The investigational new drug application and the investigator’s brochure. In: New Drug Approval Process. 4th edition. Accelerating Global Registrations. Guarino RA, ed. 2004. Marcel Dekker, Inc., New York. pp. 63-100.
24. Coburn WA, Heath G. Efficient and effective drug development. In: Applications of Pharmacokinetic Principles in Drug Development. Krishna R, ed. 2004. Kluwer Academic/Plenum Publishers, New York. pp. 1-20.
25. Gibaldi M, Perrier D. Pharmacokinetics. 2nd edition. 1982. Marcel Dekker, Inc., New York.
26. Greenblatt DJ, von Moltke LL. Drug-drug interactions: clinical perspective. pp. 565-584 in Rodrigues A. David, ed. Drug-Drug Interactions. 2002. Marcel Dekker, Inc. New York.
27. Jones DR, Hall SD. Mechanism-based inhibition of human cytochromes P450: in vitro kinetics and in vitro-in vivo correlations. In: Drug-Drug Interactions. Rodrigues AD, ed. 2002. Marcel Dekker, Inc. New York. pp. 387-413.
28. Fleisher D, Reynolds L. Food-drug interactions: drug development considerations. In: Applications of Pharmacokinetic Principles in Drug Development. Krishna R, ed. 2004. Kluwer Academic/Plenum Publishers, New York. pp. 195-223.
29. Barrett JS. Bioavailability and bioequivalence studies. In: Pharmacokinetics in Drug Development. Volume 1: Clinical Study Design and Analysis. Bonate PL, Howard DR, eds. 2004. AAPS Press, Arlington, VA. pp. 91-119.
30. Baillie TA, Cayen MN, Fouda H, Gerson RJ, Green JD, Grossman SJ, Klunk LJ, LeBlanc B, Perkins DG, Shipley LA. Drug metabolites in safety testing. Toxicol. Appl. Pharmacol. 2002; 182: 188-196.
31. Bjornsson TD, Callaghan JT, Einolf HJ, Fischer V, Gan L, Grimm S, Kao J, King SP, Miwa G, Ni L, Kumar G, McLeod J, Obach SR, Roberts S, Roe A, Shah A, Snikeris F, Sullivan JT, Tweedie D, Vega JM, Walsh J, Wrighton SA. The conduct of in vitro and in vivo drug-drug interaction studies: a PhRMA perspective. J. Clin. Pharmacol. 2003; 43:443-469.
32. Huang S-M. Drug-drug interactions. In: Applications of Pharmacokinetic Principles in Drug Development. Krishna R, ed. 2004. Kluwer Academic/Plenum Publishers, New York. pp. 307-331.
33. Hopfgartner G, Husser C, Zell M. High-throughput quantification of drugs and their metabolites in biosamples by LC-MS/MS and CE-MS/MS: possibilities and limitations. Ther. Drug Monit. 2002; 24:134-143.
34. Powell ML, Unger SE. Bioanalytical methods: challenges and opportunities in drug development. In: Applications of Pharmacokinetic Principles in Drug Development. Krishna R, ed. 2004. Kluwer Academic/Plenum Publishers, New York. pp. 21-52.
35. United States Food and Drug Administration. Exploratory IND Studies. Guidance for Industry, Investigators, and Reviewers. January 2006. http://www.fda.gov/cder/guidance/7086fnl.htm.
36. Lappin G, Kuhnz W, Jochemsen R, Kneer J, Chaudhary A, Oosterhuis B, Drijfhout WJ, Rowland M, Garner RC. Use of microdosing to predict pharmacokinetics at the therapeutic dose: experience with 5 drugs. Clin. Pharmacol. Ther. 2006; 80:203-215.
37. Sandhu P, Vogel JS, Rose MJ, Ubick EA, Brunner JE, Wallace MA, Adelsberger JK, Baker MP, Henderson PT, Pearson PG, Baillie TA. Evaluation of microdosing strategies for studies in preclinical drug development: demonstration of linear pharmacokinetics in dogs of a nucleoside analog over a 50-fold dose range. Drug Metab. Dispos. 2004; 32:1254-1259.
38. Rohatagi S, Martin NE, Barrett JS. Pharmacokinetic/Pharmaco-dynamic Modeling in Drug Development. pp. 333-372 in Krishna, Rajesh, ed. Applications of Pharmacokinetic Principles in Drug Development. 2004. Kluwer Academic/Plenum Publishers, New York.
39. Sale M. Clinical trial simulation. In: Pharmacokinetics in Drug Development. Volume 1: Clinical Study Design and Analysis. Bonate PL, Howard DR, eds. 2004. AAPS Press, Arlington, VA. pp. 531-550.
40. Bonate PL. Clinical trial simulation in drug development. Pharmaceut. Res. 2000; 17:252-256.
41. Lesko LJ. Paving the critical path: how can clinical pharmacology help achieve the vision? Clin. Pharmacol. Ther. 2007; 81:170-177.
42. Mould DR. Population pharmacokinetics: applications in industry. In:Pharmacokinetics in Drug Development. Volume 1: Clinical Study Design and Analysis. Bonate PL, Howard DR, eds. 2004. AAPS Press, Arlington, VA. pp. 501-529.
43. Guarino RA. The new drug application, content and format. In: New Drug Approval Process. 4th edition. Accelerating Global Registrations. Guarino RA, ed. 2004. Marcel Dekker, Inc., New York. pp. 113-172.
Further Reading
Cytochrome P450 Homepage. http://drnelson.utmem.edu/cytochromeP450.html.
Derendorf H, Lesko LJ, Chaikin P, Colburn WA, Lee P, Miller R, Powell R, Rhodes G, Stanski D, Venitz J. Pharmacokinetic/Pharmaco-dynamic Modeling in Drug Research and Development. J. Clin. Pharmacol. 2000;40:1399-1418.
Lee JS, Obach RS, Fisher MB, eds. Drug Metabolizing Enzymes. Cytochrome P450 and Other Enzymes in Drug Discovery and Development. 2003. Marcel Dekker’ Fontis Media, The Netherlands.
Holford NHG, Kimko HC, Monteleone JPR, Peck CC. Simulation of clinical trials. Annu. Rev. Pharmacol. Toxicol. 2000; 40:209-234.
International Society for the Study of Xenobiotics. http://www.issx.org/.
Mahmood I, ed. Clinical Pharmacology of Therapeutic Proteins. 2006. Pine House Publishers, Rockville, MD.
Pharmacokinetic and Pharmacodynamic Resources. http://www.boomer.org/pkin/.
U.S. Food and Drug Administration, Center for Drug Evaluation and Research. http://www.fda.gov/cder/.
Wilkinson GR. Pharmacokinetics. The dynamics of drug absorption, distribution, and elimination. In: The Pharmacological Basis of Therapeutics. 10th edition. Hardman JG, Limbird LE, Gilman AG, eds. 2001. McGraw-Hill, New York. pp. 3-29.