CHEMICAL BIOLOGY
Hydration Forces
Brian A. Todd, Nina Y. Sidorova and Donald C. Rau, NICHD, NIH, Bethesda, Maryland
Christopher Stanley, NIST, Gaithersburg, Maryland
doi: 10.1002/9780470048672.wecb230
Force measurements on a wide variety of biologic macromolecules indicate that the perturbation of water structuring as hydrated surfaces closely approach can dominate interaction energetics. Forces with remarkably similar characteristics are observed for the repulsive interactions of charged polymer surfaces, of uncharged polymer surfaces, of charged solutes with uncharged surfaces, and of uncharged solutes with charged surfaces stressing the universality of the hydration force in aqueous solution. Repulsive interactions are caused by a disruption of the hydrogen bonding network of the intervening water between surfaces. The available measurements of forces between macromolecules that spontaneously assemble are consistent with an attractive hydration interaction. A water-order parameter theory has been developed that is successful for predicting force curve behaviors. The direct involvement of water structuring in the interaction between macromolecules has important consequences for recognition, assembly, and conformational transitions that underlie biologic function.
In the simplest representation, hydration forces reflect the energetic consequences of perturbing the water structure as two hydrated surfaces approach. The concept developed as a result of direct measurements of interactions between macromolecules or surfaces in water that were unlike the forces commonly considered important (1-14). As is amply described elsewhere in previous articles, polar or charged surfaces bind and structure water strongly. Hydration contributes substantially to structure and stability. Water is a highly associative liquid because of its strong hydrogen-bonding ability; the structuring of water in direct contact with the macromolecular surface will alter the structure of subsequent water layers in solution. As two hydrated surfaces approach, the intervening water must accommodate both surfaces. Depending on the nature of the opposing surfaces, the hydrogen-bonding network of water can be disrupted, resulting in repulsion, or reinforced, causing attraction. Ample evidence from infrared or Raman spectroscopy, neutron scattering, and dielectric relaxation shows that the structuring of water in confined spaces, as in zeolites, inverse micelles, or very small droplets, can be different from bulk water (15-22) and references therein). In practice, hydration forces are observed between macromolecules only over the last 1-1.5-nm separation between surfaces, which corresponds to about the two last water layers on each surface. Although the energy perturbation per water molecule can be relatively small, the force can be large when summed over all the water molecules that must be reorganized. An order parameter theory has been developed to formalize the treatment of hydration forces and has been surprisingly insightful.
Force Measurements
We present the force measurements that led to the hypothesis of hydration forces, focusing on the osmotic stress measurements of several very different biologically important assemblies: lipid bilayers, DNA, collagen, and several different polysaccharides. The measurement of repulsive hydration forces between macromolecules at close approach has now been supplemented by similar measurements for the exclusion of small solutes from macromolecular surfaces. Attractive hydration interactions are more difficult to probe, but the available evidence indicates that the polycation-mediated assembly of DNA and the temperature-favored assemblies of collagen and hydrophobically modified cellulose are examples of attractive hydration forces. Lastly, the magnitude of the observed hydration forces means that polar surfaces will avidly cling to the hydration waters in the absence of a stringently complementary surface that can replace the favorable water interactions. This has profound consequences for recognition and assembly reactions in the cell that are typically characterized by both binding strength and specificity. Water structuring forces or energetics have been considered from several other points of view using different languages that are essentially equivalent (2). Ben-Naim (23, 24) has explicitly considered water-mediating attractive interactions. Cacace et al. (25) have outlined a hydration force scheme based on the electron accepting or donating properties of surface groups. Sorensen et al. (26) and Pertsemlidis et al. (27) have been active in translating the water structure around hydrophilic and hydrophobic amino acids into interactions. Solvent or hydration-induced forces have been observed in several simulations (28-31) Changes in water dielectric constant because of confinement (15, 32) and nonlocal dielectric responses (33, 34) are both consequences of water structuring that directly affect electrostatics and can be considered hydration forces.
Osmotic Stress Measurement of Forces
In the osmotic stress method for measuring forces (35), ordered arrays of biologic macromolecules are equilibrated against a bathing solution containing a polymer such as polyethylene glycol (PEG) that is excluded from the macromolecular phase and applies an osmotic pressure. The bathing solution can also contain salt and other small solutes that equilibrate between the polymer and the macromolecular phases. The distance between macromolecules can be determined by X-ray scattering. Since macromolecules are not held rigid, changes in configurational entropies also contribute to the measured interactions so the osmotic stress technique gives thermodynamic forces. For a free energy G of the macromolecular phase, the connection between the thermodynamic macromolecular force per macromolecule (assuming one macromolecule per unit cell) and the osmotic pressure n of the stressing polymer in the bathing solution is simply:
![]()
where D is the distance between macromolecules and V is the volume per macromolecule. For hexagonal packing of rodlike macromolecules, dV/dD = √3 Db, where b is a distance along the macromolecule. The partial derivatives in the above expression remind us that forces between macromolecules can be sensitive to salt, solutes, pH, temperature, and so on.
Hydration Repulsion
Figure 1 shows osmotic stress force curves, log(ПPEG) versus the surface separation between macromolecules, for several different macromolecular assemblies that are charged, zwitterionic, or completely uncharged. Unlike hard materials such as mica or clays that show oscillating forces as surfaces approach (36), biologic materials are much softer such that solvent packing constraints are secondary. At lower pressures than shown in Fig. 1, all systems begin showing a contribution from conformational fluctuation that limits the range the direct force can be observed to dominate. In the case of DNA in N(CH3)4Cl, the direct force has been separated from the fluctuation contribution (37). The striking feature of these force curves observed in Fig. 1 is the universality of their distance dependence. The forces for all these diverse systems can be well approximated by exponential functions with a 3.5-4-A decay length λ, П ~ A exp(-D/λ). Over the range of distances shown, calculated van der Waals interactions are comparatively small. At these close distances, force amplitudes between charged macromolecules such as DNA are surprisingly insensitive to salt concentration, but they depend strongly on the nature of the bound counterion. The same kind of force is observed for charged and uncharged macromolecules, which further indicates that the observed force is not caused by screened electrostatics. These force curves correspond to large energies. The integrated П-V work needed to push N(CH)3+ -DNA helices to touching, for example, is ~5.5-Kcal/mole base pair.
The common unifying theme is that all the macromolecular systems are hydrated. Within the hydration force framework, the 3-4-A exponential decay length λ reflects a water-water correlation length. Such a correlation has been observed by X-ray scattering for density fluctuations in pure water (38). The force amplitude or pre-exponential factor is caused by the structure of water in direct contact with apposing surfaces. In Fig. 1, the amplitudes of the forces observed for DNA with backbone phosphate neutralized by N(CH3)4+, for egg phosphatidyl choline that has a (CH3)3N+ (CH2)2-group covalently linked to the phosphate of the lipid head group and didodecylphosphate in N(CH3)4Cl is shown scaled to the same phosphate surface area. The surface hydration is dominated by the phosphate group with an additional weak contribution from the tetraalkylamine counterion. The macromolecular surfaces with the same hydrated chemical groups show similar force amplitudes.
The same kind of force has been observed to dominate the interactions of small solutes with macromolecular surfaces. The osmotic stress approach has also been used to map the distribution function for the exclusion of small nonpolar solutes from DNA and of polar solutes from hydrophobically modified hydroxypropyl cellulose (HPC) (39-41). Figure 2 shows four typical exclusion curves.Пexcess/П0 is directly related to the solute concentration gradient; a value of 1 signifies complete exclusion, whereas a value of o means no exclusion (or inclusion). In all cases exclusion is characterized by a 3.5-4-A decay length exponential. Small solutes are interacting with macromolecular surfaces through hydration forces. The pre-exponential factor for the exclusion of simple nonpolar alkyl alcohols from DNA varies linearly with the difference between the number of alkyl carbons and hydroxyl oxygens (41) in the solute, which further emphasizes the connection between molecular hydration and force magnitude.

Figure 1. Osmotic stress force curves are shown for several biological assemblies: schizophyllan (a triple helical polysaccharide composed only of glucose) in water (![]() ), i-carrageenan (a double helical charged polysaccharide) in 0.4-M NaCl (
), i-carrageenan (a double helical charged polysaccharide) in 0.4-M NaCl (![]() ), hydroxypropyl cellulose in water at 5° C (
), hydroxypropyl cellulose in water at 5° C (![]() ), DNA in 0.4-M NaCl (
), DNA in 0.4-M NaCl (![]() ), DNA in 0.4-M N(CH3)4Cl (
), DNA in 0.4-M N(CH3)4Cl (![]() ) (the low-pressure data have been corrected for configurational fluctuations), egg phosphatidyl choline (PC) bilayers in water (
) (the low-pressure data have been corrected for configurational fluctuations), egg phosphatidyl choline (PC) bilayers in water (![]() ), didodecylphosphate (DDP) bilayers in 0.5 M N(CH3)4Cl (
), didodecylphosphate (DDP) bilayers in 0.5 M N(CH3)4Cl (![]() ), and DNA in 0.25 M N(CH3)4Cl (
), and DNA in 0.25 M N(CH3)4Cl (![]() ) scaled to the same phosphate surface density as DDP and egg PC. Those biomacromolecular assemblies measured in water are net neutral, either zwitterionic (egg PC) or wholly uncharged (schizophyllan and HPC). Forces between charged surfaces are insensitive to salt concentration over the last 10-15 A, but they do depend significantly on the counterion identity. The X-ray spacings have been adjusted to give approximate surface separations from either gravimetric measurement of spacing as dependent on water content (the lipid bilayers), fiber dimensions determined by X-ray scattering (DNA, schizophyllan, and i-carrageenan), or the spacing between polymers when dried (HPC). Even though force amplitudes span a range of ~1000 in pressure, the decay lengths, X of the apparent exponential are similar for all these systems; the fits to the schizophyllan and DDP forces give 3.4 and 3.5 A, respectively. The overlap of the force data for egg PC, N(CH3)4+-DDP, and N(CH3)4+-DNA scaled to the same phosphate surface area indicates that force amplitudes are determined by the hydration of groups on the surface. Data for DDP and egg PC are from Leikin et al. [2].
) scaled to the same phosphate surface density as DDP and egg PC. Those biomacromolecular assemblies measured in water are net neutral, either zwitterionic (egg PC) or wholly uncharged (schizophyllan and HPC). Forces between charged surfaces are insensitive to salt concentration over the last 10-15 A, but they do depend significantly on the counterion identity. The X-ray spacings have been adjusted to give approximate surface separations from either gravimetric measurement of spacing as dependent on water content (the lipid bilayers), fiber dimensions determined by X-ray scattering (DNA, schizophyllan, and i-carrageenan), or the spacing between polymers when dried (HPC). Even though force amplitudes span a range of ~1000 in pressure, the decay lengths, X of the apparent exponential are similar for all these systems; the fits to the schizophyllan and DDP forces give 3.4 and 3.5 A, respectively. The overlap of the force data for egg PC, N(CH3)4+-DDP, and N(CH3)4+-DNA scaled to the same phosphate surface area indicates that force amplitudes are determined by the hydration of groups on the surface. Data for DDP and egg PC are from Leikin et al. [2].

Figure 2. The distance dependence characterizing exclusion of small solutes from macromolecular surfaces follows the same exponential behavior as the hydration force between macromolecules. The extent of exclusion can be extracted from the dependence of forces on solute concentration. Пеxcess is the effective osmotic pressure applied by the solute in the bulk solution on the macromolecular phase, and П0 is the maximal pressure from complete exclusion. Пexcess/П0 = 1 then corresponds to complete exclusion and Пexcess/П0 = 0 means no inclusion or exclusion. The distance dependent exclusion the polar polyols adonitol (![]() ) and glycerol (
) and glycerol (![]() ) from hydrophobically modified hydroxypropyl cellulose (HPC) and of the nonpolar alcohols i-propanol (
) from hydrophobically modified hydroxypropyl cellulose (HPC) and of the nonpolar alcohols i-propanol (![]() ) and methyl pentanediol (MPD) (
) and methyl pentanediol (MPD) (![]() ) from spermidine3+-DNA is shown. As in Fig. 1, interaxial spacings are converted to surface separations. The apparent exponential decay length varies between 3.5 and 4 A (solid lines indicate fits to the data).
) from spermidine3+-DNA is shown. As in Fig. 1, interaxial spacings are converted to surface separations. The apparent exponential decay length varies between 3.5 and 4 A (solid lines indicate fits to the data).
Order Parameter Theory for Hydration Forces
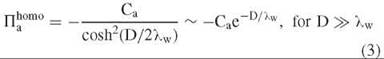
A phenomenologic theory has been developed to account for hydration forces (42-45). Water organized by surfaces is characterized by an order parameter. The linearized theory is mathematically equivalent to the Debye-Huckel formulism for electrostatic double-layer interactions. Homogenous surfaces that organize water symmetrically, as illustrated in Fig. 3a, are repulsive since the hydrogen-bonded network between surfaces will become increasingly disrupted as surfaces move closer. The order parameter theory gives for the osmotic pressure between two planar surfaces with a separation D and water-water correlation length λw,
![]()
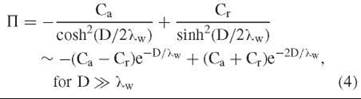
Similarly, two homogeneous surfaces with a complementary water structuring, as illustrated in Fig. 3b, will be attractive, as the hydrogen-bonding structure of the intervening water is strengthened,
The coefficients Ca and Cr are measures of the strength of water ordering on the surface.
Of course, biologic surfaces are not homogeneous. Real surfaces typically can have both opposing attractive and repulsive patches. In such a case, the osmotic pressure can be represented by (2, 9, 13, 46, 47),
In the case, Cr » Ca, repulsions dominate and the purely repulsive exponential form—П ~ Cr e-D/λw is recovered. If the attractive and repulsive patches are balanced, then the second-order term of the approximation dominates with an apparent decay length that is only half that of λw, or ~2 A. This second-order term is always repulsive and reflects the loss of favorable water-water interactions that are caused by the presence of the other surface. Its magnitude is only dependent on the overall surface water structuring whether attractive or repulsive.
Often decay lengths do not divide so neatly into two classes of values. Three complications can cause significant variability in observed decay lengths. Surface periodicities or the separation length scale of hydrated groups on the surface must necessarily contribute to decay lengths (2). This effect will decrease the apparent decay length from the fundamental water-water correlation length Xw. Second, the positions of hydrated groups on surfaces can adjust to minimize repulsion (48), which can be a continuous process as surfaces approach that increases the apparent decay length. Last, conformational fluctuations can contribute to interaction energies (37, 49, 50), particularly at lower pressures. Motions that are constrained by hydration interactions give rise to fluctuation-enhanced hydration forces that increase the apparent decay length.

Figure 3. A schematic representation of water structuring resulting in attractive or repulsive forces. Water is represented by the arrowhead figures, >, with the oxygen at the vertex. The decrease in water order from the surfaces caricatures the loss of surface water structuring through the water-water correlation length. The symmetric ordering of water on apposing surfaces shown in (A) disrupts the hydrogen bonding network or head-to-tail arrangement in the intervening water. Conversely, complementary water structuring (B) will reinforce the hydrogen bonding network in the confined space.
Hydration Attraction
If Ca > Cr in Equation 4, then attractive forces can result. Forces measurements on DNA double helices spontaneously assembled by polycations provide evidence for attractive hydration forces (12, 13). The binding of several polycations result in spontaneous condensation of DNA. Packaging of genetic material in vivo and compaction of DNA for use in nonviral gene therapy exploit this attraction. The equilibrium spacing between helix surfaces in the condensed state varies between 6-12 A depending on the nature of the condensing counterion indicative of both attractive and repulsive forces acting on DNA as implicit in Equation 4. Figure 4 contrasts the osmotic stress curves for DNA in the +3 alkyltriamine spermidine that results in spontaneous precipitation of DNA, in the +2 alkyldiamine putrescine, and in the +1 alkylamine tetramethy-lammonium, N(CH3)4+. Neither putrescine2+ nor N(CH3)4+ condenses DNA. The N(CH3)4+-DNA curve shows a 4-A single exponential characteristic of purely repulsive hydration forces dominated by the first-order term of Equation 4. The putrescine2+-DNA force curve also shows a single exponential force at high osmotic pressures but with ~2-A decay length indicative of a balance between attractive and repulsive patches that leaves the second-order term of Equation 4 dominant. The force curve in the presence of spermidine3+ is different. At П = 0, there is a balance between the attractive first-order term and the repulsive second-order term that results in a finite equilibrium spacing (arrow). This spacing leaves ~9.5 A of water-filled space between DNA molecules. The curve eventually merges with the single exponential, ~2-A decay length force observed with putrescine2+ as the interhelical spacing decreases, which aligns with the prediction of the order-parameter formalism for the emergence of a second-order repulsive term in the presence of hydration attractions. The merging of spermidine and putrescine forces at high osmotic pressures is expected for DNA surfaces with chemically homologous bound counterions. The second-order repulsion is simply determined by the overall water structuring on a single helix, not on the specific mixture of attractive and repulsive patches. Determining the decay length for attractions is more difficult because there are currently no experimental techniques to directly measure attractive forces between molecules. Combining single-molecule forces measurements of net attraction with the osmotic stress measurements of repulsion (unpublished results), however, provided an indirect estimate of 4.5-A decay length, very close to the expected 4-A decay length for hydration attractions.
Forces between self-assembled collagen fibrils also show the expected characteristics of hydration attraction. The analysis of the force curves is not so straightforward because the short repeat length of collagen predictably modifies the hydration decay length (2-4). The observed decay length of the residual force for assembled collagen of about 0.6 A is consistent with the λw/2 = 2-A intrinsic water decay length and the 9.6-A periodicity of the collagen triple helix. The decay length of the underlying attraction was estimated as ~1.2 A, which is once again consistent with a 4-A intrinsic decay and the collagen repeat distance.
The emergence of collagen offered an opportunity to investigate further the origin of these forces. The triple helix is remarkably stable in many solvents. Exponential forces are only observed, however, with solvents that can hydrogen bond (51). Raman spectra showed that the interstitial water in collagen fibers have an enhanced hydrogen-bonded network compared with bulk water. Similarly, the X-ray structures of collagen-like peptides directly show hydrogen-bonded water bridges that span regions between triple helices (52).
The temperature-favored assembly of hydrophobically modified cellulose, hydroxypropyl cellulose (HPC), has also been probed (1). At temperatures below ~40 °C, exponential repulsive forces are observed with an approximate 3-4-A decay length. At very close spacings (<2-A surface separation), the force amplitude increases rapidly, which is likely caused by steric interactions between hydroxylpropyl groups on the surface. The force amplitude of the 3-4-A decay length exponential decreases linearly with temperature extrapolating to 0 at ~40 °C very close to the temperature at which the polymer precipitates from dilute solution, ~42 °C. Above 40 °C, the equilibrium spacing between HPC polymers in the absence of applied osmotic pressure continuously decreases with increasing temperature. Since the very short-ranged steric force does not change observably with temperature, this change in equilibrium spacing must result from an attractive force with an amplitude that increases with temperature. Force data above 40 °C can be well fit by the sum of the rapidly changing short-ranged force and an attractive 4-A decay length exponential. Remarkably the temperature dependence of the fitted attractive force amplitude is a linear continuation of the repulsive force amplitudes directly observed at lower temperatures. Since hydrophobic forces have long been considered to be caused by the release of water structured around nonpolar surfaces, a connection with hydration forces should not be surprising. The strengthening of attraction or weakening of repulsion as the temperature increases is caused by a difference in the temperature dependence of water structuring around polar hydroxyl groups and nonpolar methyl groups. A confounding aspect, however, is that the 2-A second-order repulsion observed with condensed DNA is completely absent with HPC. This hydrophobic polymer simply acts as a homogeneous surface that smoothly transforms from repulsive to attractive as the temperature is increased.

Figure 4. A comparison of osmotic stress force curves for DNA in spermidine3+, putrescine2+, and N(CH3)4+. At these high osmotic pressures, force curves are relatively insensitive to ion concentration. N(CH3)4+-DNA (![]() ) illustrates hydration repulsion from a comparatively homogeneous repulsive surface, λ = 4 A, because of the domination by phosphate hydration, i.e., Ca « Cr. Putrescine2+-DNA (
) illustrates hydration repulsion from a comparatively homogeneous repulsive surface, λ = 4 A, because of the domination by phosphate hydration, i.e., Ca « Cr. Putrescine2+-DNA (![]() ) illustrates equation 4 with Ca~ Cr, which leaves a residual image charge-like repulsion with λ = 2/A. Spermidine3+ causes spontaneous DNA assembly to an interhelical spacing of 29.5 A (indicated by the arrow) with no applied osmotic pressure, Ca > Cr. The repulsive force opposing closer approach (
) illustrates equation 4 with Ca~ Cr, which leaves a residual image charge-like repulsion with λ = 2/A. Spermidine3+ causes spontaneous DNA assembly to an interhelical spacing of 29.5 A (indicated by the arrow) with no applied osmotic pressure, Ca > Cr. The repulsive force opposing closer approach (![]() ) merges with the putrescine2+-DNA data as expected for an image charge-like hydration repulsion. The underlying attraction is consistent with an exponential force with a 4.5 A decay length. The increased attraction as the charge of the alkylamine increases is from the decreased entropy of correlating charges on apposing helices to create attractive patches.
) merges with the putrescine2+-DNA data as expected for an image charge-like hydration repulsion. The underlying attraction is consistent with an exponential force with a 4.5 A decay length. The increased attraction as the charge of the alkylamine increases is from the decreased entropy of correlating charges on apposing helices to create attractive patches.
Hydration Linked to Recognition Reactions and Protein Transitions
The important lesson from the direct force measurements for biology is that polar or charged surfaces will avidly retain their hydration waters in preference to other surfaces if those surfaces are not closely complementary. A key difference, therefore, between specific and nonspecific binding of proteins, for example, should be in the water sequestered by the complexes (53, 54). Differences in water between specific and nonspecific recognition complexes can be readily determined from the dependence of the relative equilibrium constant or ligand binding constant on osmotic pressure or water activity. For osmotic pressures expressed as an osmolal concentration, a standard linkage relation is applied to water in a same way it is traditionally applied to salt, ligands, or pH is,
![]()
where Krel is the equilibrium constant between two complexes and ∆Nw is the difference in bound water between them. We have focused on differences in hydration among specific, noncognate, and nonspecific complexes of three sequence specific DNA binding proteins. DNA binding proteins will typically bind to nonspecific DNA or indeed to polyanions in general with binding constants in the range from 104 to 107 M-1 and to their recognition sequence with constants typically in the range 109-1012 M-1.
The water release accompanying the transfer of the type II restriction nuclease BamHI from a nonspecific sequence to the recognition sequence was measured in order to validate the osmotic stress approach (55). Crystal structures of both the specific (56) and the nonspecific (57) complexes are known. The nonspecific structure shows a gap between the protein and DNA surfaces that can accommodate ~150 waters. The two interfaces are in direct contact in the specific complex (Fig. 5). Relative nonspecific-specific binding constants can be determined from the loss of specific binding as the concentration of nonspecific competitor DNA is increased, using either a gel mobility shift or a self-cleavage assay (58). Relative binding constants vary significantly with the concentration of added osmolytes. The linear dependence of ln(Krel) on the osmotic pressure of the added solutes observed in Fig. 5 indicates that about 135 (±15) extra water molecules are retained in the nonspecific versus specific BamHI-DNA complex in good agreement with the structural data. The insensitivity of ∆Nw to the osmolyte used to set water activity indicates that this water is likely sequestered at the protein-DNA interface of the nonspecific complex. This number of waters corresponds to about one-two hydration layers at the interface.
EcoRI is another type II restriction endonuclease that recognizes the DNA sequence GAATTC. As is typical for these restriction nucleases, sequence recognition is exquisitely stringent. The change of even a single base pair is sufficient to reduce the binding constant by a factor of ~104 to a value more characteristic of completely nonspecific binding (59). The osmotic pressure dependence of the relative specific-nonspecific binding constant indicates that the nonspecific EcoRI-DNA complex sequesters ~110 more waters (60, 61). EcoRI complexes with DNA sequences that have even one wrong base pair (“star”-sites) also sequester ~110 more waters than the specific complex. This water, however, can be removed from complexes with a single wrong base pair by increasing the osmotic pressure (62). The osmotic work required to remove almost all of the water from a complex of EcoRI with the sequence TAACCT was estimated as 3-4-Kcal/mole complex. Water could not be removed from complexes with more than one wrong base pair even at the highest osmotic pressures examined. The loss of water from the “star” sequence complexes provides a natural link between enzymatic “star” activity of EcoRI and osmotic pressure.
The binding of the Cro repressor protein to DNA is more typical of specific DNA-protein interactions. Unlike BamHI and EcoRI, changes in the DNA recognition sequence result in graduated decreases in the binding free energy of Cro protein. This bacteriophage λ repressor recognizes two 6 base pair regions separated by a 5-bp spacer. An examination of a set of 5 binding sequences that span a range of ~1200 in relative binding constants shows that for every 10-fold decrease in binding constant about eight to nine more water molecules are incorporated by the complex (63). Water and binding energy are strongly coupled.
There are also marked differences in the extent of hydration between specific and nonspecific protein-protein interfaces. In a survey of crystal structures in the Protein Data Bank, the average number of crystallographically resolved waters in specific binding interfaces (for instance, between dimers) was compared with the number of waters in nonspecific “crystal contacts” (protein crystal contacts not normally involved in biologic interactions) (64, 65). With an average of 10 waters per 1000 A2, the biologically specific interfaces are 50% less hydrated than the crystal packing interfaces. These numbers represent waters sufficiently immobilized to be visible by X ray and underestimate the actual amount of water at protein-protein interfaces. Although neither interface is dry, the displacement of interfacial waters at the protein-protein interface was a distinguishing characteristic of specific binding.
Allosteric conformational changes are a hallmark of protein structure and function. Small changes in the structure of a binding pocket can often trigger large conformational changes elsewhere in the protein. Hydration forces are reasonable candidates for this amplification of small structural perturbations since small rearrangements of the chemical groups on surfaces can result in large changes in the hydration force between them. Once again a coupling between water and conformation should be expected if hydration forces underlie the structural change. The T-R transition of hemoglobin that accompanies oxygenation is the best known and most extensively studied allosteric reaction. The binding of 4 O2 molecules is linked to the binding of ~50-60 extra water molecules by the protein as surfaces that were complementary are slightly perturbed and now prefer interactions with water (66).

Figure 5. The nonspecific DNA complex of the restriction nuclease BamHI retains significant water at the protein-DNA interface compared with the specific complex. Neutral osmolytes (triethylene glycol, a-methyl glucoside, and glycine betaine) are added to the solution to change water activity. Increasing the osmotic pressure of the bulk solution increases the free energy difference between specific and nonspecific binding. The linear dependence corresponds to 135 more water molecules sequestered by the nonspecific complex compared with the specific complex. The insensitivity to the nature of the osmolyte indicates the water is sterically sequestered. The inset shows the structures of the nonspecific (pdb identification-1 esg) and specific (1 bhm) complexes of BamHI looking down the DNA axis. The DNA is in tan, and the BamHI protein in blue. The nonspecific complex has a gap at the DNA-protein interface large enough to accommodate ~150 water molecules that is not present in the specific complex.
Conclusions and Prospectives
Although it is almost universally acknowledged that water plays an important role in biologic assembly and recognition processes (67), defining its role quantitatively, however, has proven more difficult. It has long been known that the unfavorable interaction of water with nonpolar groups underlies the hydrophobic interaction. The observation of a common force at close separation among nonpolar, polar, and charged macromolecules that can be interpreted as resulting from water structuring greatly broadens the scope of hydration-driven interactions. The observed force is unlike that expected for double-layer electrostatics or van der Waals interactions that are more commonly considered important. Removing the last one or two layers of water between macromolecules is energetically costly if the apposing surfaces are not closely complementary. The force characteristics observed, particularly the observed decay lengths, seem remarkably simple and robust. The transmission of surface water structuring into the solution through correlated water-water interactions can account for the decay lengths. The order parameter theory provides a satisfactory initial framework for understanding and calculating hydration forces. The frustrating gap in our understanding is in connecting surface water structuring with the pre-exponential factors, Ca and Cr of Equation 4. Making this link is necessary to develop predictive tools for calculating hydration forces, but it will require the combined contributions of theory, careful characterization of surface water structuring, and further measurement of intermolecular forces.
References
1. Bonnet-Gonnet C, Leikin S, Chi S, Rau DC, Parsegian VA. Measurement of forces between hydroxypropylcellulose polymers: temperature favored assembly and salt exclusion. J. Phys. Chem. B 2001; 105:1877-1886.
2. Leikin S, Parsegian VA, Rau DC, Rand RP. Hydration forces. Annu. Rev. Phys. Chem. 1993; 44:369-395.
3. Leikin S, Rau DC, Parsegian VA. Direct measurement of forces between self-assembled proteins: temperature-dependent exponential forces between collagen triple helices. Proc. Natl. Acad. Sci. U.S.A. 1994; 91:276-280.
4. Leikin S, Rau DC, Parsegian VA. Temperature-favoured assembly of collagen is driven by hydrophilic not hydrophobic interactions. Nature Struct. Biol. 1995; 2:205-210.
5. McIntosh TJ. Short-range interactions between lipid bilayers measured by X-ray diffraction. Curr. Opin. Struct. Biol. 2000; 10:481-485.
6. McIntosh TJ, Simon SA. Hydration and steric pressures between phospholipid bilayers. Ann. Rev. Biophys. Biomol. Struct. 1994; 23:27-51.
7. Petrache H, Tristam-Nagle S, Gawrisch K, Harries D, Parsegian VA. Structure and fluctuations of charged phosphotidylserine bilayers in the absence of salt. Biophys. J. 2004; 86:1574-1586.
8. Petrache HI, Gouliaev N, Tristam-Nagle S, Zhang R, Suter RM, Nagle JF. Interbilayer interactions: high resolution X-ray study. Phys. Rev. E 1998; 57:7014-7024.
9. Rand RP, Fuller NL, Parsegian VA, Rau DC. Variation in hydration forces between neutral phospholipid bilayers: evidence for hydration attraction. Biochemistry 1988; 7:7711-7722.
10. Rau DC, Lee B, Parsegian VA. Measurement of the repulsive force between polyelectrolyte molecules in ionic solution: hydration forces between parallel DNA double helices. Proc. Natl. Acad. Sci. U.S.A. 1984; 81:2621-2625.
11. Rau DC, Parsegian VA. Direct Measurement of forces between linear polysaccharides xanthan and schizophyllan. Science 1990; 249:1278-1281.
12. Rau DC, Parsegian VA. Direct measurement of temperature-depen dent solvation forces between DNA double helices. Biophys. J. 1992; 61:260-271.
13. Rau DC, Parsegian VA. Direct measurement of the intermolecular forces between counterion-condensed DNA double helices: evidence for long range attractive hydration forces. Biophys. J. 1992; 61:246-259.
14. Strey HH, Podgornik R, Rau DC, Parsegian VA. DNA-DNA interactions. Curr. Opin. Struct. Biol. 1998; 8:309-313.
15. Nandi N, Bhattacharyya K, Bagchi B. Dielectric relaxation and solvation dynamics of water in complex chemical and biological systems. Chem. Rev. 2000; 100:2013-2045.
16. Berkowitz ML, Bostick DL, Pandit S. Aqueous solutions next to phospholipid membrane surfaces: insights from simulations. Chem. Rev. 2006; 106:1527-1539.
17. Verdaguer A, Sacha GM, Bluhm M, Salmeron M. Molecular structure of water at interfaces: wetting at the nanometer scale. Chem. Rev. 2006; 106:1478-1510.
18. Urbic T, Vlachy V, Dill KA. Confined water: a Mercedes-Benz model study. J. Phys. Chem. B 2006; 110:496-4970.
19. Trnskett TM. The subtleties of water in small spaces. Proc. Natl. Acad. Sci. U.S.A. 2003; 100:10139-10140.
20. Levinger NE. Water in confinement. Science 2002; 298:1722-1725.
21. Gilijamse JJ, Lock AJ, Bakker HJ. Dynamics of confined water molecules. Proc. Natl. Acad. Sci. U.S.A. 2005; 102:3202-3207.
22. Cheng JX, Pautot S, Weitz DA, Xie XS. Ordering of water molecules between phospholipid bilayers visualized by coherent anti-Stokes Raman scattering microscopy. Proc. Natl. Acad. Sci. U.S.A. 2003; 100:9826-9830.
23. Ben-Naim A. Molecular recognition-viewed through the eyes of the solvent. Biophys. Chem. 2002; 101:309-319.
24. Ben-Naim A. Hydrophobic hydrophilic phenomena in biochemical processes. Biophys. Chem. 2003; 105:183-193.
25. Cacace MG, Landau EM, Ramsden JJ. The Hofmeister series: salt and solvent effects on interfacial phenomena. Quarterly Rev. Biophys. 1997; 30:241-277.
26. Sorenson JM, Hura G, Soper AK, Pertsemlidis A, Head-Gordon T. Determining the role of hydration forces in protein folding. J. Phys. Chem. B 1999; 103:5413-5426.
27. Pertsemlidis A, Soper AK, Sorensen JM, Head-Gordon T. Evidence for microscopic, long-range hydration forces for a hydrophobic amino acid. Proc. Natl. Acad. Sci. U.S.A. 1999; 96:481- 486.
28. San Biagio PL, Bulone D, Martorana V, Palma-Vittorelli MB, Palma MU. Physics and biophysics of solvent induced forces: hydrophobic interactions and context-dependent hydration. Euro. Biophys. J. 1998; 27:183-196.
29. Hassan SA. Amino acid side chain interactions in the presence of salts. J. Phys. Chem. B 2005; 109:21989-21996.
30. Bennion BJ, Daggett V. Counteraction of urea-induced protein denaturation by trimethylamine N-oxide: a chemical chaperone at atomic resolution. Proc. Natl. Acad. Sci. U.S.A. 2004; 101:6433-6438.
31. Ghosh T, Kalra A, Garde S. On the salt-induced stabilization of pair and many-body hydrophobic interactions. J. Phys. Chem. B. 2005; 109:642-651.
32. Senapati S, Chandra A. Dielectric constant of water confined in a nanocavity. J. Phys. Chem. B 2001; 105:5106-5109.
33. Bopp PA, Kornyshev AA, Sutmann G. Frequency and wave-vector dependent dielectric function of water: collective modes and relaxation spectra. J. Chem. Phys. 1998; 109:1939-1958.
34. Medvedev IG. The analytical expression for the static nonlocal dielectric function of a polar liquid with due account of the overscreening effect. Electrochim. Acta 2004; 49:207-217.
35. Parsegian VA, Rand RP, Fuller NL, Rau DC. In: Methods in Enzymology. Packer L, ed. 1986. Academic Press, New York. p. 400-416.
36. Israelachvili J, Wennerstrom H. Role of hydration and water structure in biological and colloidal interactions. Nature 1996; 379:219-224.
37. Podgornik R, Rau DC, Parsegian VA. Parameterization of direct and soft steric-undulatory forces between DNA double helical polyelectrolytes in solutions of several different anions and cations. Biophysic. J. 1994; 66:962-971.
38. Xie Y, Ludwig KF, Morales LG, Hare DE, Sorensen CM. Noncritical behavior of density fluctuations in supercooled water. Phys. Rev. Lett. 1993; 71:2050-2053.
39. Chik J, Mizrahi S, Chi S, Parsegian VA, Rau DC. Hydration forces underlie the exclusion of salts and of neutral polar solutes from hydroxypropylcellulose. J. Phys. Chem. B 2005; 109:9111-9118.
40. Hultgren A, Rau DC. Exclusion of alcohols from spermidine-DNA assemblies: probing the physical basis for preferential hydration. Biochemistry 2004; 43:8272-8280.
41. Stanley CB, Rau DC. Preferential hydration of DNA: the magnitude and distance dependence of alcohol and polyol interactions. Biophys. J. 2006; 91:912-920.
42. Gruen DWR, Marcelja S. Spatially varying polarization in water. J. Chem. Soc. Faraday Trans. 1983; 79:225-242.
43. Gruen DWR, Marcelja S. Spatially varying polarization in ice. J. Chem. Soc. Faraday Trans. 1983; 79:211-223.
44. Malyguine E, Vannier P, Yot P. Alteration of the specificity of restriction endonucleases in the presence of organic solvents. Gene 1980; 8:163-177.
45. Radic N, Marcelja S. Solvent contribution to the Debye screening length. Chem. Phys. Lett. 1978; 55:377-379.
46. Leikin S, Kornyshev AA. Theory of hydration forces. Nonlocal electrostatic interaction of neutral surfaces. J. Chem. Phys. 1990; 92:6890-6898.
47. Kornyshev AA, Leikin S. Fluctuation theory of hydration forces: the dramatic effects of inhomogeneous boundary conditions. Phys. Rev. A 1989; 40:6431-6437.
48. Leikin S, Parsegian VA. Temperature-induced complementarity as a mechanism of biomolecular assembly. Proteins: Struct. Func. Genet. 1994; 19:73-76.
49. Podgornik R, Rau DC, Parsegian VA. The action of interhelical forces on the organization of DNA double helices: fluctuation- enhanced decay of electrostatic double-layer and hydration forces. Macromolecules 1989; 22:1780-1786.
50. Podgornik R, Strey HH, Gawrisch K, Rau DC, Rupprecht A, Parsegian VA. Bond orientational order, molecular motion, and free energy of high-density DNA mesophases. Proc. Natl. Acad. Sci. U.S.A. 1996; 93:4261-4266.
51. Kuznetsova N, Rau DC, Parsegian VA, Leikin S. Solvent hydrogen-bond network in protein self-assembly: Solvation of collagen triple helices in nonaqueous solvents. Biophys. J. 1997; 72;353-362.
52. Bella J, Brodsky B, Berman HM. Hydration structure of a collagen peptide. Structure 1995; 3:893-906.
53. Parsegian VA, Rand RP, Rau DC.In: Methods in Enzymology. Johnson ML, Ackers GK, eds. 1995. Academic Press, New York. p. 43-94.
54. Parsegian VA, Rand RP, Rau DC. Osmotic stress, crowding, preferential hydration, and binding: a comparison of perspectives. Proc. Natl. Acad. Sci. U.S.A. 2000; 97:3987-3992.
55. Sidorova NY, Muradymov S, Rau DC. Differences in hydration coupled to specific and nonspecific competitive binding and to specific binding of the restriction nuclease BamHI. J. Biol. Chem. 2006; 281:35656-35666.
56. Newman M, Strzelecka T, Dorner LF, Schildkraut I, Aggarwal AK. Structure of BamHI endonuclease bound to DNA: partial folding and unfolding on DNA binding. Science 1995; 269:656-663.
57. Viadiu H, Aggarwal AK. Structure of BamHI bound to nonspecific DNA: a model for DNA sliding. Molec. Cell 2000; 5:889-895.
58. Sidorova NY, Muradymov S, Rau DC. Trapping DNA-protein binding reactions with neutral osmolytes for the analysis by gel mobility shift and self-cleavage assays. Nucleic Acids Res. 2005; 33:5145-5155.
59. Lesser DR, Kurpiewski MR, Jen-Jacobson L. The energetic basis of specificity in the EcoRI endonuclease-DNA interaction. Science 1990; 250:776-786.
60. Sidorova NY, Rau DC. Differences in water release for the binding of EcoRI to specific and nonspecific DNA sequences. Proc. Natl. Acad. Sci. U.S.A. 1996; 93:12272-12277.
61. Sidorova NY, Rau DC. Linkage of EcoRI dissociation from its specific DNA recognition site to water activity, salt concentration, and pH: separating their roles in specific and non-specific binding. J. Molec. Biol. 2001; 310:801-816.
62. Sidorova NY, Rau DC. Differences between EcoRI nonspecific and ‘star’ sequence complexes revealed by osmotic stress. Bio- phys. J. 2004; 87:2564-2576.
63. Rau DC. Sequestered water and binding energy are coupled in complexes of X Cro repressor with non-consensus binding sequences. J. Mol. Biol. 2006; 361:352-361.
64. Rodier F, Bahadur RP, Chakrabarti P, Janin J. Hydration of protein-protein interfaces. Proteins: Struct. Func. Genet. 2005; 60:36-45.
65. Raschke TM. Water structure and interactions with protein surfaces. Curr. Opin. Struct. Biol. 2006; 16:152-159.
66. Colombo MF, Rau DC, Parsegian VA. Protein solvation in allosteric regulation: A water effect on hemoglobin. Science 1992; 256:655-659.
67. Levy Y, Onuchic JN. Water mediation in protein folding and molecular recognition. Ann. Rev. Biophys. Biomol. Struct. 2006; 35:389-415.