CHEMICAL BIOLOGY
Membrane Potentials in Living Systems, Tools to Measure
Paul O'Shea, Cell Biophysics Group, School of Biology, University of Nottingham, University Park, Nottingham, United Kingdom
doi: 10.1002/9780470048672.wecb310
Membrane potentials are a ubiquitous feature of all living cells and play different roles in manifold cellular processes. Three different membrane potentials are known to exist that include the transmembrane potential difference, the surface electrostatic potential and the membrane dipole potential. Each of these are discussed in terms of their different physical origins and characteristics together with representative examples of how they feature in cell biology as well as some examples in physiology. Techniques for the quantitative measurement of each of these potentials are described in both model systems as well as with living systems. As many of these practices involve the use of spectroscopic technologies (particularly fluorescence) they lend themselves to spatial (single cell) imaging applications and examples of the biological roles that spatial variation or localisation of each of these potentials are also outlined.
Biological Background
Membranes act as one of the major macromolecular assemblies of living cells (both prokaryotic and eukaryotic) but also feature as physical envelopes in viruses such as influenza and HIV. Typically cell membranes act as semi-permeable structures that compartmentalise cellular processes and behave as 2D fluids, rapidly annealing any fractures by 2D molecular flow. Membranes, however, undertake many more biological roles than these simple generalizations imply as they also act as platforms for many important biochemical processes. Similarly, it has recently been appreciated that membranes exhibit localised structures in the form of microdomains (ie. so called rafts) as shown in Fig. 1. These act as structures upon and within which, additional physico-chemical mechanisms may operate. The following sections outline the biological features of the trinity of membrane potentials (1) and their physico-chemical origins. Practical methodologies for their respective measurements are then described that exploit these different molecular origins.

Figure 1. Schematic of a contemporary view of a cell membrane.
The transmembrane potential difference: roles in signaling and energy transduction
The first membrane potential to be considered resides in a membrane’s ability to act as a permeability barrier or resistance to solute (particularly electrolyte) movement. Thus ions that are actively transported across the membrane by membrane proteins are not easily able to return to their former compartment. This leads to a thermodynamic gradient that is utilised by cells in two ways. The first, takes advantage of the ionic concentration gradient of a specified ion across the membrane. The second due to a small electrical capacity of the membrane (ca. 1 pF cm-2) may lead to an electrical gradient across the membrane. Thus chemical or light energy that is ‘spent’ transporting the ions across the membrane is partially ‘conserved’ as the ionic gradient across the membrane (e.g. as illustrated in Fig. 2). Two enormously important biological examples featuring these processes are worth emphasising, the first example is that the conservation of light or chemical (oxidation-reduction) energy as an ionic/electric gradient is an essential part of the process of oxidative or photosynthetic phosphorylation. The ionic gradient in these latter cases resides in a proton gradient across the mitochondrial or chloroplast membranes respectively (2). Interestingly, in the case of the mitochondria, the proton gradient manifests mostly as an electrical gradient (3) due as mentioned above, to the relatively small electrical capacity of the mitochondrial membrane with only a small pH gradient. Whereas due to the relatively easy movement of Mg2+ ions across the chloroplast membrane, the electrical capacity is effectively much increased and the proton gradient then manifests mostly as a pH gradient with a small electrical gradient. Both these manifestations of the electrochemical potential difference of the proton across the membrane however, are equivalent and are utilised to manufacture ATP directed through the membrane ATPases. In fact, this electrochemical gradient is utilized essentially as a power source for many additional utilities such as coupled solute transport, to drive the flagellum movement of some bacteria as well as for protein import across prokaryotic and eukaryotic membranes (4).
The second general biological example is that the electrical gradient so generated can be utilised as a signaling mechanism such as in nervous transmission in neural cells or as a driving force for ionic currents that mediate cell signaling. These signaling mechanisms are both complex and ubiquitous with ion channels activated through soluble or membrane-bound ‘ligands’ or 2nd messengers that upon opening permit e.g. calcium ion movements driven by the membrane potential that then elicits further cell signaling cascades for neurotransduction, muscle contraction and nuclear translocation of molecular switches to turn genes on or off. Typically there are spatial elements in these signaling elements and thus there are also many measurement strategies that include imaging modalities as part of the experimental goals.
Finally, in the case of the role of membrane potential in nervous conduction, a traveling wave of an electrical potential gradient (voltage) is used to relay signals over relatively long distances along the cell membrane ie as in axonal linkages between cells (see e.g. 5). This latter manifestation of a “membrane potential” as part of the nerve impulse is perhaps the most commonly understood membrane potential and is described very fully in Reference 6).
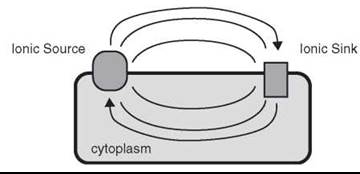
Figure 2. Schematic of an ionic circuit in a living cell or bacterium. Ions transported across the membrane by the action of energy-dependent pumping systems (ionic source) leads to a transmembrane potential difference and/or an ionic concentration gradient according to equations 2 & 3. This gradient may then equilibrate through via the ionic sinks yielding energy to manufacture ATP or drive other transport systems. Alternatively the ionic sources and sinks may be part of the same membrane protein structure and be positioned such that a travelling wave of ionic current is used as a long range signaling system (e.g. nervous conduction).
The membrane surface potential: roles in modulating ion channels and cell-cell interactions
The surface potential is now understood to play important roles in many physiological processes. These range from the simplest involving coulombic repulsion between adjacent membranes that prevent cells sticking to each other. Thus sialic acid as a sugar moiety to the membrane protein glycophorin present on the cell surface of many cells and particularly red blood cells appears to prevents cell-cell aggregation. Under circumstances of uncontrolled-diabetes, however the nature of the sugars on the erythrocyte cell surface may change with sialic acid replaced by uncharged sugars. This reduces the coulombic repulsion between the red cells allowing thrombosis to occur (7, 8).
The contribution to the cell membrane surface potential by sialic acid is also implicated in gating the voltage dependence of Na+ Channels (9). This kind of electrostatic effect on ion pump/channel loading/unloading (with other contributors to the surface potential such as phosphatidylserine), however, has been considered for many years. McLaughlin as long ago as 1971, for example, suggested that surface potential changes were responsible for negative or positive shifts of the current-voltage relationships of neural tissue as embodied in the Hodgkin-Huxley equations (5). This kind of process is the result of the effect of the surface potential on the activity of ions on a membrane surface and leads to changes of e.g. the pK of membrane surface-located acid-base groups (10, 11). We have exploited this latter phenomenon to develop a panel of fluorescent phospholipids as real-time measures of the membrane surface potential (12). By measuring small changes of the membrane surface potential in this manner due to the interaction of charged molecules, it proved possible to study the kinetics and thermodynamics of intermolecular interactions with membranes (13).
The membrane dipole potential: role in modulating microdomain-located membrane proteins
The presence and biological roles of cell membrane microdomains (often referred to as membrane rafts) are discussed elsewhere in the WECB although it must be conceded that presently, this subject remains slightly contentious. Nevertheless in our hands we have clearly observe these structures in both artificial model systems (14) and the membranes of living cells (1). We published the first theoretical model of the possible mechanisms of assembly and disassembly of these structures (14) and firmly believe they are a feature of living cell membranes. The accepted functions of microdomains appear to revolve around their ability to act as local platforms for endocytosis/excocytosis or to localise reactants whether they be small ligands or proteins. In this way reactants are localised in the raft aiding their interaction or they are sequestrated from the more fluid membrane preventing their interaction with potential partners resident in the fluid membrane. Both these processes, however are conceptually analogous. We considered that membrane microdomains may exhibit a vastly different membrane dipole potential to that of the fluid phase membrane due to their different lipid packing and complement of sterols and lipids (etc). We later demonstrated this was indeed a function of the various lipids present (15) and also showed that this parameter had a significant effect on membrane protein conformation (16). This work demonstrated with representative ligand-receptor systems that this behaviour may alter the function of such receptor systems depending on whether they were resident in the rafts or in the fluid phase regions of the membrane (15, 17). Following this a number of other laboratories also observed modulation of membrane behaviour via the agency of the dipole potential (18). Thus the membrane dipole potential appears to be an additional tool for which membrane protein function can be controlled in particular localities. The explicit molecular mechanism by which this may take place is discussed in the next section.
Physical Chemistry Background of Membrane Potentials
It is axiomatic that biological systems must adhere to the physico-chemical laws of nature. Sometimes, biology when appearing to contradict such laws (eg organisms and cells representing low entropy structures, historically brought it into conflict with the 2nd law of thermodynamics), however, merely serves to illustrate the ingenuity of nature in working within the laws. Electrostatics and electrodynamics together represent one such cornerstone of nature that biology exhibits great expertise in making use of to deliver exquisite control of biological function, as briefly outlined above.
Membrane potentials manifest in a number of different ways as part of the process of biology and relate to their physical origins and will be described in this section. Taking each type of the three potentials in turn, the transmembrane potential difference is considered first as this is the most well known and features prominently in undergraduate text books dealing with biochemistry and physiology. Historically this membrane property also known simply as the membrane potential, unfortunately has lead to some confusion as it shares nomenclature with the ‘other’ membrane potentials. In this article the same nomenclature is adopted as that described in a comprehensive treatise on biological membrane potentials (1) that is consistent with the ‘elder’ discipline of electrochemistry, so unifying the chemistry and biology communities’ versions of the nomenclature.
The transmembrane potential difference (∆фm)
Membranes represent permeability barriers to the movement of ions (and electrons) and this phenomenon is utilised in a number of ways in biological systems as mentioned in the previous section. In terms of generalising and for the sake of briefness, this gradient of ions has two principal uses, the first as an energy store albeit labile and secondly a means of long distance signaling. Thus, the transport of net charges across the insulator offered by the membrane will establish an electrical potential difference (∆фm) across the membrane. In terms of an analogy with the charging of a capacitor, this well known latter phenomenon is described by the following expressions:
![]()
Where, V is the electrical potential difference across the membrane ie. Vm or Em and ∆ψ, C = the capacitance of the membrane (dielectric) and q is the number of charges transported across the membrane. The term, ∆фm is included as this represents a more consistent nomenclature, and would be better recognised by disciplines outside biology (e.g. Electrochemists), ∆ψ, is the form utilised by biochemists (2) and Vm or Em is the form utilised by Physiologists (6).
The transport of electrical charge across a membrane may take the form of cation, anion (both inorganic and organic) or electron transport all requiring an energetic input. It can be passive due to membrane leaks or mediated by ionophores such as valinomycin. All other things being equal it is possible to utilise equation 1 to calculate a trans-membrane (ie trans-dielectric) potential difference (19). Thus, under these circumstances there is a simple and direct equivalence of the voltage across the membrane (ie ∆фm) to the Gibbs Free energy (ie. ∆G). In biological membranes, however, the transport is frequently coupled either to the movements of other ions due to co- or anti-porting enzymes, or to chemical reactions as in the case of oxidative phosphorylation or hydrolysis of ATP. The value of ∆фm established in such complex systems is governed by the relation ∑i Zi Ji = 0, where the sum has to include all flows Ji of charged species (Zi) across the membrane (1). When this relation is satisfied, charging of the membrane capacity has ceased, and a (pseudo-)steady state with a (approximately) constant ∆фm is then attained. Its value depends on the difference in chemical potential (∆μi) of all transported species and on the affinities of coupled chemical reactions. The pertinent relations are usually transcendental and cannot be solved explicitly except for some special cases. In particular, if only one species permeates through the membrane, a true equilibrium state is reached and the resulting transmembrane electrical potential difference is described by what is known as the Nernst equation (below). This equivalence, however, becomes more complicated because biological membranes are not totally impermeable to ions (i.e. there is leakage back across the membrane - e.g. Reference 20), the concentration gradients must also be included in the Gibbs free energy of the expression and finally there is usually a coupling of the transport mechanisms to the movements of other ions as well as to the energy input (as in oxidative phosphorylation or the hydrolysis of ATP - see Reference 2). Nevertheless, ion gradients are established across many membranes whereby the ion leakage is balanced by further energy-linked ion transport. Biological membranes, therefore, exhibit quasi-equilibrium transmembrane concentration gradients of charge based on selective transport of the ions found in physiological electrolytes. This is described by the well-known Nernst equation which incorporates the transmembrane concentration gradient of electric charge as follows:
![]()
In which ф is an abbreviation of KT/e = RT/F : With F = faraday constant, R gas constant and Q indicate the concentration of the respective ionic species in the aqueous phases separated by the membrane.
Thus, the Gibbs Free energy expression for such an ionic gradient across the membrane consisting of an positively charged species C, would be of the form of the following expression:
![]()
The electrical component (∆фm) and the chemical component (Log (C+)inside/(C+)outside) are combined to indicate the thermodynamic potential difference due to the ionic gradient.
Finally, its also worth emphasising that related to the transmembrane potential difference, a transmembrane gradient of electric charge known as the Donnan potential is also known to exist. The Donnan potential arises from the inability of larger charged macromolecules or other fixed charges to move across a membrane and for counterions to compensate this gradient.
The membrane surface potential (фS)
Many of the electrical phenomena that feature on membrane surfaces are similar to those found in electrochemistry. Thus derivation of formalisms describing interactions of ions with charged membrane surfaces have evolved from and are in many ways similar to those that have been developed to describe the ion relations of electrodes in electrochemistry. Its worth emphasizing, however that care must be taken when simply reworking concepts that originate from electrochemistry as there are important differences between membranes and electrodes that may complicate formal descriptions. Electrodes are essentially homogeneous hard solid metal surfaces, whereas membranes are soft, fluid, highly heterogenous interfaces that interact and actually require their aqueous environment to exist (ie through the hydrophobic effect).
Ions are attracted towards the charged membrane surface but the hydrated radius of the ions in the layers adjacent to the surface prevents them from moving to the membrane surface without becoming actually adsorbed. The initial treatments of this phenomena by Gouy and Chapman in terms of the interactions of ions with electrodes involved treatment of the ions as point charges but a modification of this model was presented by Stern who developed the much earlier Helmholtz-Perrin model with that of Gouy-Chapman (21). The Helmholtz-Perrin model described the double-layer concept that counterions formed an ionic “sheet” upon a charged surface, the ions being at least partially dehydrated in the direction of the surface. Much of the history of the development of these ideas as directed towards metal surfaces in aqueous media (ie. electrodes) may be found in comprehensive electrochemistry texts (21).
The forces involved in the specific ionic-interactions with membranes were initially thought predominantly to be electrostatic and van der Waals in nature, and large enough to counter the thermal motion/diffusion of the ions away from the interface to the bulk medium. Later, it was suggested that water molecules may adopt a specific orientation upon the charged surface due to their permanent dipoles (this latter feature has some bearing on an understanding of the dipole potential described below). A number of diffuse phases or layers as illustrated in Fig. 3a, have been identified which are thought to exist adjacent to the surfaces of membranes. These include the so-called Stern layer (Fig. 3a) which represents contact-adsorbed counter-ions (either totally or partially dehydrated) and oriented water molecules. The plane running through the centre of the contact adsorbed ions is referred to as the Inner -Helmholtz plane. The first layer of hydrated ions is then referred to as the Outer-Helmholtz plane. The Gouy-Chapman-Stern model was formalised by considering the adsorption of counter-ions only, the process being approximated by a Langmuir-type adsorption isotherm (1, 21).

Figure 3. Fluorescent sensors of Surface and Dipole potential in membranes. Fig. 3a (LHS) indicates the position in the a single bilayer leaflet of fluorescent indicators of the membrane dipole potential (upper chemical structure) and the surface potential (lower chemical structure). The RHS profile indicates how the profile of surface potential varies with distance from the membrane surface. Fig. 3b indicates the use of FPE as a surface potential indicator that responds to the addition of a charged peptide (P25) as it interacts with simple membranes (see 25 for more details).
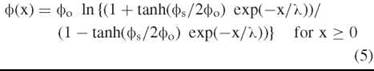
Surface potentials at the electrode-solution interface have been described by a number of formalisms. The most successful of these was offered originally by Gouy and Chapman with subsequent elaborations from Chapman, Stern, Bockris etc. (outlined in ref 1 & 21). McLaughlin (22) and others (outlined in 1) suggested that a combination of the Poisson and Boltzmann equations best describes the state of affairs in the space between the membrane surface and the bulk phase aqueous solution ie. the electrode-water interface. The Poisson-Boltzmann equation, with defined boundary conditions can be solved analytically (1, 22) to yield an expression for the surface potential as follows:
![]()
with ф0 as in Eqn. 4 and the abbreviation ![]() whereby σ represents the surface charge density, and λ is known as the Debye length. At 25 °C
whereby σ represents the surface charge density, and λ is known as the Debye length. At 25 °C ![]() = 0.304 nm M1/2 for an aqueous phase with εr ≈ 80.
= 0.304 nm M1/2 for an aqueous phase with εr ≈ 80.
Thus the potential profile in the diffuse layer shown in Fig. 3a is given by:
The membrane dipole potential (фD)
Many membrane components such as phospholipid include moieties such as the Cδ+ = Oδ— and Oδ—-Pδ+ exhibit polarisation. The membrane dipole potential фd has its origins in the dipole moments of polar groups from the lipidic components of the bilayer, it seems likely that the water molecules at the molecular surface of membrane also make a contribution (1). The organisation of the membrane components that contribute to this potential have been verified from neutron diffraction studies and NMR spectroscopy (23) and quite recently using cryo-EM techniques has also added quantitative estimations of the potential (24). These dipolar groups seem to be oriented in a way such that the potential located towards the hydrophobic interior of the membrane is positive with respect to the pole located towards the external aqueous phases, and фd has a magnitude of several hundred millivolts (typically about 300 mV see Fig. 4).
Symbolically formalising the measured molecular arrangements in order to undertake modelling of the membrane dipole potential is also not as straightforward as it may seem. It is possible to begin by identifying a vector drawn from the point of the negative charge — Q to the positive charge +Q of any dipole which is the familiar electric dipole moment p. The magnitude is Q a, with a defining the distance between the centres of the charge density. The potential at a given point with a position vector r with respect to the centre of the dipole can be expressed as:
![]()
where θ is the angle between r and p. Higher order terms become influential if r » a is not fulfilled.
This expression, however, only deals with a single molecular dipole and as many such dipoles would be required to describe the overall membrane dipole potential but as a mean-field expression, this term is practical and culmulatively offers the approximation of the estimated dipolar organisation shown in Fig. 4. A further complication, however, involves the solvent environment and this too is also often dealt with as a mean field or in a continuum manner. But the relative permittivity (or dielectric constant) (εr) cannot be considered to possess the same value throughout the multiphase system represented by a membrane in an aqueous medium. The permittivity profile has been measured to vary from about 78.5 in the bulk aqueous phase to 20-30 in the diffuse layer at the membrane-water interface (25) to around 2 in the membrane interior.

Figure 4. Profile of dipole potential in the membrane.
Chemical Tools & Techniques
Measurements of the transmembrane potential difference (∆фm)
There are many techniques available for the measurement of ∆фm (e.g. 1, 2, 5) historically these involved the use of electrodes in which the voltage in one compartment would be compared to that in another separated by the membrane. And whilst this is not a major problem with larger structures such as eukaryotic cells, with bacteria penetration by an electrode would represent a major invasive procedure. Electrodes are still utilized routinely (6, 28) but the use of spectroscopic probes has evolved as perhaps the most commonly utilized current technology (26). Experimental strategies involve measurement of the redistribution of membrane-permeant indicators that migrate according to the ∆фm as embodied in the Nernst equation (2, 20). Thus ∆фm-dependent accumulation of a fluorophore such as Rhodamine 123 into mitochondria reports the membrane potential as variations of fluorescence (26 & 27). As this takes place according to the Nernst equation, signals can be standardized with the aid of defined transmembrane potentials generated by K+-diffusion potentials and a K+-specific electrogenic ionophore such as valinomycin (20). Other approaches may involve fluorophore that possess electrochromic properties (28) and report the membrane voltage directly. It is clear, however, that one added advantage of using spectroscopic indicators that respond to the transmembrane potential difference, was that they also offer the possibility of obtaining kinetic information of the changes of potential resulting from cellular signaling or metabolic activity.
Other electrochromic membrane probes of note include, merocyanine 540 used to study the transmembrane potential in liver mitochondria although some problems are evident (5, 30, 31). Overall, measurements of transmembrane potential differences in living cells are well established with the methods fairly reliable and robust. Many of these membrane potential measurement strategies are generic and hold for plasma membranes of neurones and other excitable tissues (6).
Measurements of the membrane surface potential (фS)
In our laboratory we have developed novel fluorescence technologies that illuminate the respective membrane potentials. For measurements of фS this involved the synthesis of fluorophores attached to a phospholipid molecule that have the advantage of being virtually non-invasive as they are used at very low concentrations and do not perturb the membrane. One such probe molecule, FluoresceinPhosphatidylEthanolamine (FPE), has proved to be a versatile indicator of the electrostatic nature of the membrane surface in both artificial and cellular membrane systems (12, 17, 25). FPE is sensitive to changes in the surface potential фS at the membrane-solution interface because the fluorescent moiety of the FPE lies precisely at the membrane solution interface (see Fig. 3a). Any changes in the number of surface charges at the membrane, such as the binding of an inorganic ion or a charged oligopeptide, will cause an alteration in фS. These probe molecules operate in the following manner: thus according to the Boltzmann equation the concentration of a charged species at the membrane surface is
![]()
that when introduced into the logarithmic form of the Henderson-Hasselbalch equation, upon rearranging yields:
![]()
Thus pH = —log(cH,b), and cB and cHB, the concentrations of the dissociated and protonated species of an acid-base pair, respectively (1, 12, 25). The quantity pK — FфS/(RT ln10) can be considered as an apparent pK for proton binding of an acid-base pair on the membrane surface. Eqn. 8 shows that the protonation state cB/cHB of the probe is altered if ^s changes at constant pH, which results in a change in the fluorescence yield ie the protonated form is much less fluorescent than the deprotonated form.
This phenomenon has been utilised to measure the time course of the interactions of just about any charged molecules such as ions e.g. Ca2+, peptides, and proteins that may interact with either synthetic and biological membranes with great sensitivity in real time. An example of this is shown in Fig. 3b. It has also proved possible to monitor the early events during the interactions of macromolecules with artificial membrane systems (25) and with living cells (12) to obtain thermodynamic information of the intermolecular interactions (13).
Measurements of the dipolar membrane potential (ФD)
The dipole potential фd may be measured using a series of potentiometric fluorescent indicators that operate by electrochromic mechanisms. 1-(3-sulfonatopropyl)-4-(β(2-(di-n- octylamino)-6-naphthyl) vinyl) pyridinium betaine (known as di-8-ANEPPS) in particular has been successfully applied to the measurement of фd using dual-wavelength ratiometric fluorescence methods (15, 16, 30). This method forestalled problems arising from small differences in dye concentration between different samples, dye bleaching or the influence of light scattering on the fluorescence measurements.
The excitation spectrum of di-8-ANEPPS is altered when it lines up (symmetrically or asymmetrically) with the membrane dipoles causing electronic redistributions within the probe molecule (see e.g. Fig. 5a). This promotes red or blue shifts in the excitation spectrum depending on the magnitude and direction of the dipole moment of the ambient environment that the probe finds itself in as shown in Fig. 5b. Preparation of membranes with sterols etc (ie that possess quite different dipole-moments to PC) promote changes in the membrane dipole potential, and significant variations of the intensity and position of the excitation maximum are observed. The excitation spectrum of di-8-ANEPPS in phosphatidylcholine (PC) membranes for example is significantly altered when 15 mol% of either 6-ketocholestanol (KC) or phloretin are added to such membranes. In the case of phloretin the difference spectrum has a minimum at 450 nm and a maximum at 520 nm (Fig. 5b). In the case of KC, however, the difference spectrum has a maximum at 450 nm and a minimum at 520 nm, which is the opposite effect to that of phloretin.
Comprehensive studies of the dependence of the relative magnitude of the dipole potential on the membrane lipidic composition have been reported previously and a summary is reported in ref. 15. Of quite some interest, however, is the possibility that di-8-ANEPPS may be used to indicate the interactions of some macromolecules with membranes as shown in Fig. 5b (lower RHS graph) and we were able to show that the dipole potential also has an effect on the structure of the peptide within the membrane (16). It appears from our findings that the magnitude of ^d is measurably influenced by peptides/proteins that insert (at least partially) into the membrane and just as importantly vice versa.

Figure 5. Spectroscopic tools for identifying the membrane dipole potential Fig. 5a indicates the excitation spectrum of different membranes labeled with di-8-anepps with the emission collected at 580 nm. Spectra are shown for membranes made up of 100% phosphatidylcholine (-), membranes made up of phosphatidylcholine and 15mol% 6-Ketocholestanol (- - -) and membranes made up of 15 mol% phloretin (∙∙∙). These excitation spectra are better visualised as the difference spectra shown in 5b in which membrane made up of different lipid micstures are compared to a reference spectra, typically these are normalized and compared to phosphatidylcholine and shown as LHS upper (phloretin) and lower (6-ketocholestanol) spectra. The spectra upper RHS indicates the spectral shift of a membrane following interaction with a peptide and the lower plot illustrates the time course of the interactions in which the upper and lower limbs of the spectra are ratioed and plotted against time.
Spatial Imaging of Membrane Potentials
The dominant technologies (outlined above) utilised to determine biological membrane potentials are optically based and particularly involve fluorescence. Thus spatial imaging is a logical extension of these spectroscopic applications. The use of a modified electrode technology has also been utilized to acquire imaging data in which the electrode is rastered over a cell surface to identify localization of ion transport behaviour and by implication spatial variations of the transmembrane potential (28). Measurements that include a spatial element have become extremely important in addressing biological problems as living cells exhibit enormous heterogeneity in the spatial disposition of these potentials. Lateral gradients of each of the membrane potentials, therefore, are implicated in manifold biological processes. In our laboratories for example we have developed the concepts (outlined above) relating to the interesting possibility that elevated dipole fields within membrane microdomains (15) modulate protein structure and that this modulates signaling activity (1, 17) or the activity of ion channels (18). We developed the use of di-8-ANEPPS to determine how the membrane dipole potential may be utilised to reveal macro-molecular interactions with membranes (15, 16). By illuminating spatial variations of this parameter and particularly how it varies in membrane rafts it led us to propose that the value of фd is quite different in membrane rafts as compared to fluid mosaic membranes (1, 17). Figure 6 illustrates this striking heterogeneity of the фd about the cell surface with measures currently being taken to correlate this or co-locate such signals that are emanating from the raft microdomains within membranes. The latter is a significant issue as there remains much confusion as to the in vivo existence of membrane rafts (33).
Similar approaches utilising such indicators as FPE to visualise the membrane surface potential фs are also routinely employed in our laboratories (17). By correlating the change of the fluorescence and hence surface potential with the addition of net electric charges from the macromolecule that becomes bound, it is possible to quantitate on the basis of the poisson-boltzmann equation above, the number of molecules that become bound. This allows us for example to determine localised molecular interactions on the membrane surface (17, 34).
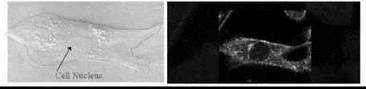
Figure 6. Fluorescence imaging of the membrane dipole potential in single cells. The RHS fluorescence image of a fibroblast was obtained following excitation of di-8anepps (see Fig. 5) using a laser-scanning confocal microscope. Di-8-anepps labels all the intracellular membranes as well as the plasma membrane and thus indicates these membranes also possess very localized regions of elevated dipole potentials indicative of intracellular membrane microdomains. The LHS image indicates a bright field image of the same cell.
Future Studies of Biological Roles and of Technologies for Measurement
Future aims and understanding of the biological roles of membrane potentials
Each of the membrane potentials described above are fundamental properties of living cells and as such there will be a growing appreciation of their roles in cell biology. In particular the development of an understanding of their roles in complex signaling pathways in which the coupling between the electrical and chemical signaling networks are clarified. Ci-VSP, for example (37) is a recently described protein with sequence similarity to both the voltage-sensing domain of a voltage-gated potassium channel and the phosphatase PTEN, and functions as a transmembrane phosphoinositide phosphatase that is regulated by changes in voltage across the plasma membrane (37). More extensive and integrated conceptual developments of the cellular role of all aspects of membrane potentials will undoubtedly emerge as the new biological sub-discipline known as ‘systems biology’ matures (38).
Future technologies for measuring membrane potentials
With the introduction of the green fluorescent protein (GFP) initially as a fluorescent label to track proteins, subsequent development of the technology to manufacture other colours (X-FP) has been used to visualize protein-protein interactions through eg FRET. For the future fluorescent proteins are now starting to be utilized to monitor functionality rather than simply demonstrate expression of a conjugate. An interesting application of this concept involves proteins expressed to monitor membrane potential in living cells and offer much promise (37). The use of voltage sensor proteins has been limited, however, by targeting problems incorrect subcellular localization and small or absent voltage responses in mammalian cells.
A new type of fluorescent probes is the quantum dots or qdots (39). They are essentially inorganic semiconductor nanocrystals and their fluorescent characteristics depends largely on their size; increasing size of the nanocrystal leads to longer wavelengths. Furthermore, bi-functionalised conjugation chemistries are being developed that facilitates the qdot functionality binding specifically to a biomolecule of interest. In this way it is possible to study simultaneously several processes within a cell or tissue.
References
1. O’Shea P. Membrane potentials; measurement, occurrence and roles in cellular function. In: Bioelectrochemistry of Membranes. Walz D, et al., eds. 2005. Birkhauser Verlag, Switzerland. pp. 23-59.
2. Nicholls D, Ferguson S. Bioenergetics, 2nd edition. 1992. John Wiley & Sons, Inc., Chichester, UK.
3. Keibler M, Becker K, Pfanner N, Neupert W. Mitochondrial protein import - specific recognition and membrane translocation of preproteins. J. Membr. Biol. 1993; 135:191-207.
4. Kalenak A, McKenzie RJ, Conover TE. Response of the electrochromic dye, merocyanine 540, to membrane potential in rat liver mitochondria. J. Membr. Biol. 1991; 123:23-31.
5. McLaughlin S, Szabo G, Eisenmann G. Divalent ions and the surface potential of charged phospholipid membranes. J. Gen Physiol 1971; 58:667-687.
6. Sten-Knudsen O. Biological Membranes: Theory of Transport, Potentials and Electric Impulses. 2002. Cambridge University Press, Cambridge, UK.
7. Rogers ME, Williams DT, Niththyananthan R, Rampling MW, Heslop KE, Johnston DG. Decrease in erythrocyte glycophorin sialic-acid content is associated with increased erythrocyte aggregation in human diabetes. Clin. Sci. 1992; 82:309-313.
8. Izumida Y, Seiyama A, Maeda N. Erythrocyte aggregation: bridging by macromolecules and electrostatic repulsion by sialic acid. Biochim. Biophys. Acta 1991; 1067:221-226.
9. Bennett E., Urcan MS, Tinkle SS, Koszowski KG, Levinson KR. Contribution of Sialic acid to the voltage dependence of sodium channel gating: a possible electrostatic mechanism. J. Gen. Physiol. 1997; 109:327-343.
10. Berteloot A. Cation, pH and membrane-potential dependencies of intestinal glutamic-acid transport. Federation Proc. 1985; 44:444.
11. Kimmich GA, Randles J. Na+-coupled sugar transport: membrane potential-dependent Km and Ki for Na+. Am. J. Physiol. Cell Physiol. 1988 ;255:C486-C494.
12. Wall JS, Ayoub F, O’Shea P. The interactions of macromolecules with the mammalian cell surface. J. Cell Sci. 1995; 108:2673-2682.
13. Golding C, Senior S, Wilson MT, O’Shea P. Time resolution of binding and membrane insertion of a mitochondrial signal peptide: correlation with structural changes and evidence for cooperativity. Biochemistry. 1996; 20:10931-10937.
14. Richardson G, Cummings LJ, Harris H, O’Shea P. Towards a mathematical model of the assembly and disassembly of membrane microdomains: comparison with experimental models Biophys. J. 2007; 92:4145-4156.
15. Asawakarn T, Cladera J, O’Shea P. Effects of the membrane dipole potential on the interaction of Saquinavir with phospholipid membranes and plasma membrane receptors of Caco2 cells. J. Biol. Chem. 2001; 276:38457-38463.
16. Cladera J, O’Shea P. Intramembrane molecular dipoles affect the membrane insertion and folding of a model amphiphilic peptide. Biophys. J. 1998; 74:2434-2442.
17. O’Shea P. Intermolecular interactions with/within cell membranes and the trinity of membrane potentials: kinetics and imaging. Biochem. Soc. Trans. 2003; 31:990-996.
18. Rokitskaya TI, Atonenko YN, Kotova EA. Effect of the dipole potential of a bilayer lipid membrane on gramicidin channel dissociation kinetics. Biophys. J. 1997; 73:850-854.
19. O’Shea P, Azzi A. On the location of the electrogenic step(s) during the process of dioxygen reduction by cytochrome c oxidase. Biochem. J. 1984; 224:1053-1057.
20. O’Shea P, Petrone G, Casey RP, Azzi A. The current-voltage relationships of liposomes and mitochondria. Biochem. J. 1984; 219:719-726.
21. Bockris J, Reddy AK. Modern Electrochemistry. 1970. MacDonald, London.
22. McLaughlin S. The electrostatic properties of membranes. Annu. Rev. Biophys. Biophys. Chem. 1989; 18:113-136.
23. Seelig J, Macdonald PM, Scherer PG. Phospholipid head groups as sensors of electric charges in membranes. Biochemistry 1987; 26:7535-7541.
24. Wang L, Bose PS, Sigworth FJ. Using cryo-EM to measure the dipole potential of a lipid membrane. Proc. Natl. Acad. Sci. U.S.A. 2006; 103:18528-18533.
25. Wall JS, Golding C, van Veen M, O’Shea P. The use of fluoresceinphosphatidylethanolamine as a real-time probe for peptide-membrane interactions. Mol. Membr. Biol. 1995; 12:181-190.
26. Bunting JR, Phan TV, Kamali E, Dowben RM. Fluorescent cationic probes of mitochondria. Metrics and mechanism of interaction. Biophys J. 1989; 56:979-993.
27. Emaus RK, Grunwald R, Lemasters JJ. Rhodamine 123 as a probe of transmembrane potential in isolated rat-liver mitochondria: spectral and metabolic properties. Biochim. Biophys. Acta 1986; 850:436-448.
28. Gu Y. Gorelik J, Spohr HA, Shevchuk A, Lab MJ, Harding SA, Vodyanoy I, Klenerman D, Korchev YE. High-resolution scanning patch-clamp: new insights into cell function FASEB J. 2002; 16:748-750
29. Loew LM. Design and characterization of electrochromic membrane probes. J. Biochem Biophys Methods. 1982; 6:243-260.
30. Waggoner A. Optical probes of membrane potential. J. Membr. Biol. 1976; 27:317-334.
31. Langner M, Hui SW. Merocyanine interaction with phosphatidylcholine bilayers. Biochim. Biophys. Acta. 1993; 1149:175-179.
32. Ross E, Bedlack RS, Loew LM. Dual-wavelength ratiometric fluorescence measurement of the membrane dipole potential. Biophys. J. 1994; 67:208-216.
33. Lagerholm BC, Weinreb GE, Jacobson K, Thompson NL. Detecting microdomains in intact cell membranes. Annu. Rev. Phys. Chem. 2005; 56:309-336.
34. O’Shea P. Physical landscapes in biological membranes. Philos. Transact. A Math Phys. Eng. Sci. 2005; 363:575-588.
35. Cladera J, Martin I, O’Shea P. The fusion domain of HIV gp41 interacts specifically with heparan sulfate on the T-lymphocyte cell surface. EMBO J. 2001; 20:19-26.
36. Horn R. Electrifying Phosphatases. 2005; 2005:pe50.
37. Dimitrov D, Mutoh Y-H, Baker BJ, Cohen L, Akemann W, Kndpfel T. Engineering and characterization of an enhanced fluorescent protein voltage sensor. PLoS ONE 2007; 2:e440.
38. Beard DA, Vendelin M. Systems biology of the mitochondrion. Am. J. Physiol. Cell Physiol. 2006; 291:C1101-C1103.
39. Lichtman JW, Conchello, J-A. Fluorescence microscopy. Nat. Methods 2005; 2:910-919.
Further Reading
Cladera J, O’Shea P. Generic techniques for fluorescence measurements of protein-ligand interactions; real-time kinetics and spatial imaging. In: Protein-Ligand Interactions. Harding SE, Chowdery BZ, eds. 2001. Oxford University Press, UK. pp. 169-200.
Loew LM. Spectroscopic Membrane Probes, Volumes 1-3. 1988. CRC Press, Boca Raton, FL.
O’Shea P. Membrane potentials and membrane probes. In: Chemical Biology., eds. 2007. John Wiley & Sons, Ltd, New York. pp. 67-84. Walz D., Teissie J., Milazzo G., (Eds.) Bioelectrochemistry of Membranes. 2005. Birkhauser Verlag, Switzerland.
See Also
Membrane Assembly in Living Systems
Bioenergetics and Oxidative Metabolism
Lipid Rafts
Ion Transport
Imaging Techniques: Overview of Applications in Chemical Biology