Liquid-State Physical Chemistry: Fundamentals, Modeling, and Applications (2013)
4. Describing Liquids: Phenomenological Behavior
Before we embark on modeling the behavior of liquids, in this chapter we discuss some phenomenological properties of liquids. The content of this chapter is not essential for the remainder of the book, but has been included in order to be somewhat self-contained and for reference. A brief outline of the phase behavior and equations of state is given.
4.1. Phase Behavior
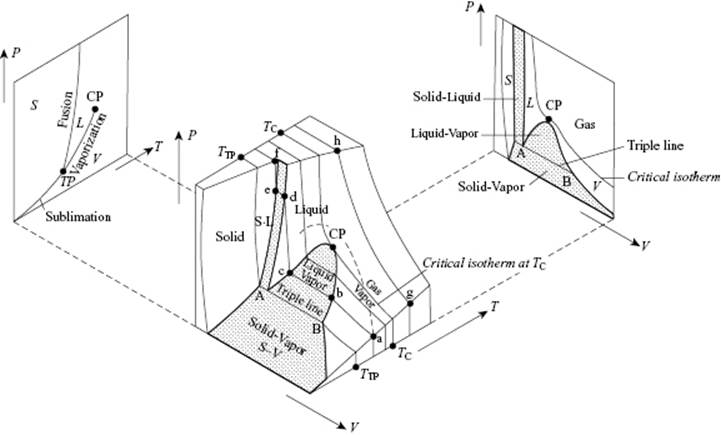
In this section we deal with the phase behavior of fluids, for which a schematic is given in Figure 4.1. For sufficiently low temperature and sufficiently high pressure a vapor (V) condenses to a liquid (L) or a solid (S), and this leads to the coexistence of vapor and liquid (V–L coexistence line), of vapor and solid (V–S coexistence line) or of liquid and solid (S–L coexistence line). Whilst, as far as is known, the fusion (S–L) curve continues to exist with increasing temperature, the vaporization (V–L) curve ends at the critical temperature (Tcri) or critical point (CP). Above the CP, condensation is impossible and the vapor is often addressed as a gas (G). Moreover, above the critical isotherm the difference between liquids and gases ceases to exist. Another special point here is the triple point (TP) where the gas, liquid, and solid phase are in equilibrium.
Figure 4.1 Phase relations for a simple fluid between the solid (S), liquid (L) and vapor (V) phase. The triple point (TP) and critical point (CP) are indicated. As in the figure, some authors use the word “gas” for above-critical and “vapor” for below-critical conditions. Reproduced from Ref. [16].
Characteristic physical properties of liquids are the (isothermal) compressibility, κT, and the (isobaric) volume thermal expansion coefficient, α. For organic liquids the typical range of κT is (0.2–2.0) × 10−9 Pa−1. Generally, κTdecreases with increasing pressure, with a smaller rate at a higher pressure, and increases with increasing temperature, with a larger rate at a lower pressure. For organic liquids, the typical range of α is (0.7–1.5) × 10−3 K−1. The parameter α increases with increasing temperature; typical data are listed in Appendix E.
For future reference, we note that often a threefold classification of fluids is made:
· Simple fluids are fluids of (more or less) spherical molecules such as Ar, CH4 and N2, for which the angular dependence of the interaction potential is (almost) absent.
· Normal fluids are fluids without a specific interaction such as hydrogen bonding; examples are C6H6, CCl4 and cyclo-C6H12.
· If these specific interactions are present, we denote these fluids as complex fluids, examples being H2O, NH3, and CH3COOH.