Liquid-State Physical Chemistry: Fundamentals, Modeling, and Applications (2013)
15. Some Special Topics: Surfaces of Liquids and Solutions
15.2. One-Component Liquid Surfaces
The surface tension of a liquid decreases with temperature T and must vanish at the critical temperature Tcri. One of the first empirical expressions for the surface tension γ as a function of T, applicable to simple and normal liquids, is Eötvös' rule [4] which states that, if Vm is the molar volume, γ for a normal liquid is given by
(15.25) ![]()
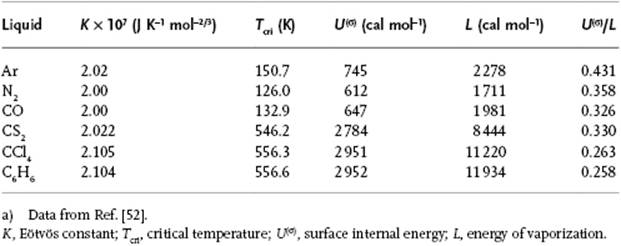
The constant K is supposed to be a universal constant valid for all liquids (Table 15.1), which appears to be approximately true for many nonpolar and nonhydrogen-bonding liquids5). In practice, the value for hydrogen-bonding liquids varies with the type of compound, typically 0.7–1.5 × 10⁻⁷ J K−1 mol−2/3 for alcohols and 0.9–1.7 × 10⁻⁷ J K−1 mol−2/3 for organic acids. The lower values indicate association in these liquids, and one has tried to estimate the degree of association from these data. Although qualitatively sound, accurate values for the degree of association cannot be obtained.
Table 15.1 Various data for liquids.a)
Estimating the molecular area a ≡ A/NA as a = κ(Vm/NA)2/3, F(σ) = γA becomes ![]() . Here, κ is a numerical factor close to one, for example, using a lattice model with FCC arrangement for the molecules, one has κ = 21/3 = 1.26 for the (100) plane, 25/6 = 1.78 for (110) plane, and 2−2/331/2 = 1.09 for the (111) plane. To obtain the surface internal energy U(σ) we use the Gibbs–Helmholtz relationship U(σ) = ∂(F(σ)/T)/∂(1/T), and from Eq. (15.25)easily obtain
. Here, κ is a numerical factor close to one, for example, using a lattice model with FCC arrangement for the molecules, one has κ = 21/3 = 1.26 for the (100) plane, 25/6 = 1.78 for (110) plane, and 2−2/331/2 = 1.09 for the (111) plane. To obtain the surface internal energy U(σ) we use the Gibbs–Helmholtz relationship U(σ) = ∂(F(σ)/T)/∂(1/T), and from Eq. (15.25)easily obtain ![]() . To obtain the surface entropy S(σ), we use S(σ) = −∂F(σ)/∂T and obtain
. To obtain the surface entropy S(σ), we use S(σ) = −∂F(σ)/∂T and obtain ![]() . Inserting the value of K, it appears that S(σ) ≅ 2.0k. For water, S(σ) ≅ 1.1k.
. Inserting the value of K, it appears that S(σ) ≅ 2.0k. For water, S(σ) ≅ 1.1k.
In a simple lattice picture of liquids with N molecules in the bulk with coordination number z and nearest-neighbor interaction w, the potential energy Φ and heat of vaporization L read, respectively,
(15.26) ![]()
If we cleave a liquid into two parts, we transfer molecules to the surface with surface coordination number z(σ) and the work expended W(σ) is
(15.27) ![]()
since the number of molecules N which in the bulk had a potential energy ½zw have now a potential energy ½z(σ)w. At 0 K, where the argument applies, we have for the molar energy associated with surface U(σ) = W(σ). Note that w < 0 and z(σ) < z, so that U(σ) > 0. We obtain
(15.28) ![]()
Using the FCC (111) plane for the surface, we have z(σ) = 9 and z = 12, resulting in U(σ)/L = 0.25. While experimentally for simple liquids values of ∼0.4 are observed, for normal liquids the estimate U(σ)/L = 0.25 is reasonably good (Table 15.1)6).
Empirically extending the dependence of γ on temperature T, still using the fact that γ vanishes at the critical temperature Tcri, one can write [5]
(15.29) ![]()
with γ0 and r constants. It appears that for simple liquids [2] excellent agreement is obtained with r = 2/9, while for a range of organic compounds the average value r = 0.210 ± 0.015 describes the experimental data well [6a, 6b]7). Katayama [7] argued that the surface tension is determined by the difference in interactions between the liquid and vapor phase and therefore related to the density difference. Defining y = (ρL − ρV)/M or yVcri = (ρL − ρV)/ρcri, with Mthe molecular mass and ρL and ρV the density of the liquid and vapor, respectively, Katayama proposed to use
(15.30) ![]()
and where a is given as the average value for six liquids. Guggenheim [8] showed that for simple liquids, the density behavior of liquids and gases can be accurately represented by (see Chapter 4)
(15.31) ![]()
Consequently, using Eq. (15.31), we can write
(15.32) ![]()
and eliminating y between Eq. (15.30) and (15.32), we obtain
(15.33) ![]()
explaining nicely the empirically observed relation with r = 2/9.
We can also eliminate T/Tcri between Eq. (15.30) and (15.31) with as the result
(15.34) ![]()
In 1923, McLeod [9], unaware of Katayama's results, also suggested a relationship between the surface tension γ and liquid and vapor densities ρL and ρV given by
(15.35) ![]()
to be compared with γ ∼ (ρL−ρV)11/3. In fact, even the data McLeod used – that is, the data of Ramsay and Shields5 – showed the exponent to be somewhat smaller than 4.
Sugden [10], ignoring the fact that an exponent 11/3 is more suitable than 4, and hence using r = 1/5 in Eq. (15.29), rewrote the McLeod expression to
(15.36) ![]()
with M the molecular mass (for polymers the molecular mass of the repeating unit).
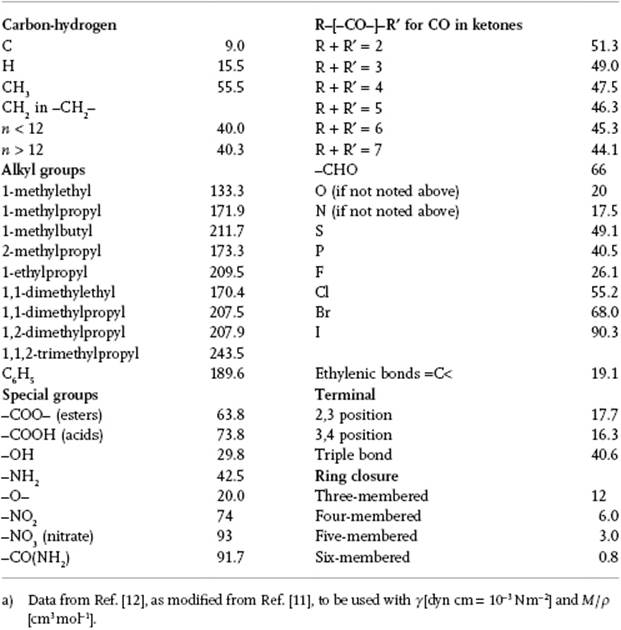
The parameter P, which appears experimentally to be independent of temperature over a reasonable temperature range, is denoted as parachor P, and Sugden related it to the molecular structure. In essence, he used a group contribution method for which the necessary data were refined by Quayle [11]. Table 15.2 provides data as given by Poling, Prausnitz, and O'Connell [12], who state that they are often as accurate as those from Quayle (fitted to surface tension data), except for compounds such as benzonitrile, carbon disulfide, carbon tetrachloride and pyridine, where the errors are unacceptably high. Originally, the parachor was used to study molecular structure, but nowadays spectroscopic and diffraction methods have superseded this approach, although it is still used for estimating surface tension. Nevertheless, there are some serious flaws in this correlator, as demonstrated clearly by Exner8)[13], but unfortunately his critique has been largely neglected in the literature.
Table 15.2 Structural contributions for the parachor P.a)
It appears that the surface tension also obeys the principle of corresponding states (PoCS). Guggenheim [2] noticed that a dimensionless parameter is obtained if we take ![]() . For the set Ne, Ar, Xe, N2, O2 and CH4, its average value is (4.30 ± 0.16), where ± indicates the sample standard deviation (see Table 4.3). An improved correlation is obtained by using the acentric factor ω (see Chapter 4). As a first step we use the reduced density ρred = ρ/ρcri, which we take as a function of Tred = T/Tcri and ω. According to Riedel9) [14], we can take this correlation as
. For the set Ne, Ar, Xe, N2, O2 and CH4, its average value is (4.30 ± 0.16), where ± indicates the sample standard deviation (see Table 4.3). An improved correlation is obtained by using the acentric factor ω (see Chapter 4). As a first step we use the reduced density ρred = ρ/ρcri, which we take as a function of Tred = T/Tcri and ω. According to Riedel9) [14], we can take this correlation as
(15.37) ![]()
At Tred = 0 we obtain ρ0 representing the (hypothetical) density at 0 K. For Tred < 0.8 it appears that the value of ρ/ρ0 is more or less constant, independent of the acentric factor ω. Using this correlation and knowing the ω value, a single measurement below Tred = 0.8 is sufficient to predict the density variation over the full temperature range. As a side product we are also able to estimate the thermal expansion coefficient or expansivity α.
The second step is using Eq. (15.33), where γ0 is interpreted as the (hypothetical) surface tension at 0 K. It appears that the correlation
(15.38) ![]()
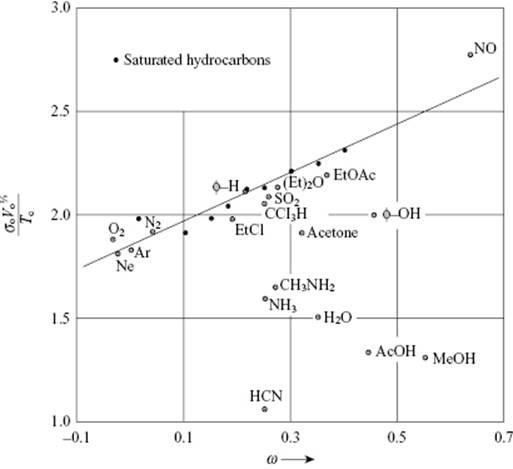
with V0 the (hypothetical) volume at 0 K as calculated from ρ0, describes the behavior rather well (Figure 15.4). Using the density ρ at a given Tred, we obtain ρ/ρ0 from Eq. (15.37) and the reference volume V0 is then V0 = (m/ρ)(ρ/ρ0). Together with Tcri, Eq. (15.38) provides an estimate for γ0. The fit of Eq. (15.38) is rather good – typically the deviations for normal fluids are less than 5% – and this led Pitzer [15] to suggest that γ0 could be used to test whether liquids behave as “normal” (see Chapter 4).
Figure 15.4 The reduced surface tension ![]() as a function of the acentric factor ω. The data points for normal fluids are all within 5% of the line given by Eq. (15.38). Data from Ref. [54].
as a function of the acentric factor ω. The data points for normal fluids are all within 5% of the line given by Eq. (15.38). Data from Ref. [54].
Another approach [16] to estimate the surface tension is based on the comparison of lattice considerations (for a liquid and a surface taking interactions up to the fifth shell into account) and conventional thermodynamics. Assuming a stepwise change in density for the interface, usually denoted as the Fowler (–Kirkwood–Buff) approximation, the analysis leads to
(15.39) ![]()
The derivative (∂U/∂V)T is the internal pressure of the liquid which can be calculated from (the experimentally accessible) αT/κT − P, where α and κT are the expansivity and compressibility, respectively, and P is the ambient pressure. The agreement of the predicted values with respect to the experimental values for eight liquids at various temperatures was ∼17%, and quite good considering the simplified nature of the model. In fact, it was shown [17] for a variety of liquids that γκT = l was relatively constant, and it was suggested that l represents an intrinsic length scale. A first-principles statistical mechanical derivation of such a relation for monoatomic liquids by using density functional theory (DFT) arguments for the density ρ(z) through the liquid–vapor interface is available [18]. Furthermore, it was shown that a good empirical correlation [19] exists between γ and κT for 24 organic liquids near 298 K that reads γκT = 27.4 ± 3.4 pm, where ± indicates the sample standard deviation. Sanchez [20] provides γ(κT/ρ)1/2 = A1/2 with A1/2 = 2.78 ± 0.13 (erg cm2/g)1/2 as a temperature-independent constant, and where about half of the variation was attributed to experimental errors. Although the constant A1/2 was shown to be proportional to the second moment of the direct correlation function, and was empirically related to the Lennard-Jones energy parameter εand size parameter σ via A1/2 = 0.26(εσ2/M)1/2 with M the molecular mass, the physical implications of this correlation are unclear.
Yet another approach is based on the pair correlation function g(r). Accepting again Fowler's approximation for the interface and using Eq. (6.39) in combination with Eq. (15.1), Kirkwood and Buff derived, denoting as before the potential energy and its derivative by ϕ(r) and dϕ(r)/dr = ϕ′(r), respectively, the expression for the surface tension γ and surface internal energy u(σ) as
(15.40) ![]()
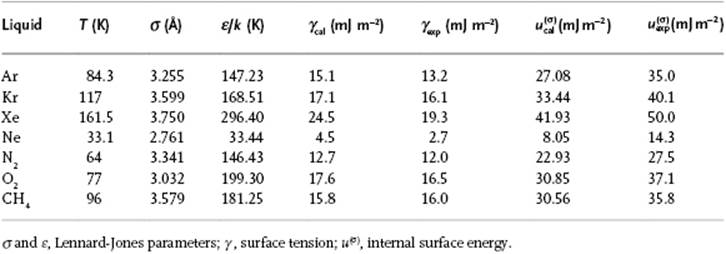
In their approach [21] ρ = ρL denotes the number density of molecules in the liquid. Using the Lennard-Jones potential for ϕ(r) as determined from the internal energy U and vapor pressure P, the surface tension γ and surface internal energy u(σ) were calculated [22] for several simple molecules (Table 15.3). The agreement for γ with experiment is good. Evidently, the agreement for γ is much less as for u(σ), and this was attributed to the use of the Fowler approximation and neglect of the vapor phase. It should be noted that the Lennard-Jones parameters used should be chosen properly, that is, from liquid state data U and P, as indicated. These parameters are normally estimated from the second virial coefficient B(T), or from viscosity data η(T). Generally, σ{U,P} < σ{B(T),η(T)} and ε{U,P} > ε{B(T),η(T)}. Values for γ and u(σ) calculated from either B(T) or η(T) resulted, in most cases, in physically impossible values. The drawback of the approach is similar as for the bulk, namely that it is largely applicable only to molecules that are more or less spherical, since otherwise the orientational angles must be introduced and this complicates the formalism tremendously.
Table 15.3 Surface tension as estimated for various liquids using the Kirkwood–Buff approach.
Later [23], it was suggested that ρ = ρL − ρV be used instead of just ρ = ρL. This extended the applicability of the Kirkwood–Buff predictions from only close to the triple point to close to the critical point. Further, one could wonder about the effect of the use of the Fowler approximation for Lennard-Jones fluids. Its effect has been evaluated [24], and it appears that any agreement of theoretical results using this approximation with simulations and experiments is fortuitous. It accounts for ∼70% of the value for γ as obtained from simulations for Lennard-Jones liquids.
Finally, we note that the surface tension itself becomes size-dependent for drops with very small radius r, and that this dependency [25] is expressed by γ = γ0(1 − 2δ/r), where γ0 is the surface tension for a flat surface and δ is the Tolman length with a magnitude on the order of a few tenths of the molecular diameter.
In conclusion, in spite of being important, the surface structure of pure liquids is still incompletely known and the debate continues. While the basic theory, as exposed in several reviews [26], is essentially clear, development and experimentation are continuing, for example using optical and X-ray scattering techniques [27], to provide continuously new insights.
Problem 15.5
Show that for the FCC lattice, κ = 21/3 for the (100) plane, κ = 25/6 for (110) plane, and κ = 2−2/331/2 for the (111) plane.
Problem 15.6
Show that for the Eötvös–Ramsey–Shields model, ![]() ,
, ![]() , and
, and ![]() . Indicate why this expression for γ cannot be generally valid.
. Indicate why this expression for γ cannot be generally valid.
Problem 15.7
Verify Eq. (15.33) and (15.34).
Problem 15.8
Estimate the surface tension for cyclohexane, using a vaporization energy L = 30.5 kJ mol−1, a density ρ = 773 kg m−3, and molecular mass M = 84.16 g mol−1, by assuming a cubic structure. Compare your result with the experimental value of 0.0247 N m−1, and comment.