Organic Chemistry I For Dummies, 2nd Edition (2014)
Part IV. Spectroscopy and Structure Determination
IN THIS PART …
See how mass spec, NMR, and IR spectroscopy work.
Use mass spec to look at fragmentation patterns of molecules.
Look at how IR spectroscopy can allow you to determine the functional groups in a molecule.
Do detective work to figure out the structure of unknown compounds using spectroscopy.
Chapter 17. A Smashing Time: Mass Spectrometry
IN THIS CHAPTER
Seeing how mass spectrometry works
Breaking down a mass spectrum
Predicting fragments formed in the mass spectrometer
Examining isotope effects
Working problems with mass spec
Imagine trying to determine how a watch is put together by whacking it with a mallet and examining all the little pieces. KAPLOW! A spring here, a cog there. This process may not be the most elegant examination — and it probably won’t please your friend whose watch you “borrowed” — but it will give you some information about the different parts that made up that watch. Such an examination probably wouldn’t give you enough information to determine exactly how the watch fit together, but you would certainly be more informed about what was inside the watch after your experiment than you were before.
Furthermore, certain brands of watches would likely break apart in different ways. If you smashed a particular brand of watch, say Watch Brand A, you may find that in most cases you break off the clasp when you hit it with a mallet; with Watch Brand B, you may find that you break off the casing more of the time but leave the clasp intact.
That’s sort of how mass spectrometry works — with a molecule, of course, instead of a watch. A mass spectrometer works by smashing a molecule into bits. Instead of viewing all the shattered pieces, though, a mass spectrometer weighs them. The weights of these fragments give clues about the structure of the molecule itself. And, like different kinds of watches, different kinds of molecules break apart in distinct ways in a mass spectrometer.
In this chapter, I talk about how mass spectrometry works, how to interpret a mass spectrum, and how to figure out what fragments will most likely be formed from a given structure.
Defining Mass Spectrometry
Mass spectrometry is really quite different from spectroscopy. You often hear or read the words mass spectroscopy. But by definition, spectroscopy involves light, and mass spectrometry doesn’t involve light at all. Still, like spectroscopy (see Chapters 18 and 19), mass spectrometry (or “mass spec”) provides valuable information about the structure of a compound. In fact, modern organic chemists use mass spectrometry nearly as much as NMR (see Chapter 19) in order to determine the structures of compounds. Perhaps this is because, in addition to giving clues about the structures of unknown molecules, mass spectrometry appeals to chemists’ childlike urges to smash things — albeit on a molecular scale.
Taking Apart a Mass Spectrometer
Here’s a very general rundown of how a mass spectrometer works, free for the moment of technical names and jargon (see Figure 17-1). The sample containing the unknown compound is first injected into the spectrometer through an inlet, and is then vaporized by heating it under a vacuum. The vaporized sample is then pushed by an inert gas into the “smasher” where the sample is clobbered and broken into little bits. Some particles come out of the “smasher” with an electrical charge and some come out uncharged. All the charged bits (called ions) move along into the sorter, which separates the bits according to how much they weigh. All the uncharged bits are discarded. The remaining charged particles then hit a detector, which determines how many bits of each weight there are, and plots the data on the mass spectrum. This spectrum shows the molecular weight of each fragment versus the number of fragments with that weight that hit the detector.
![]()
FIGURE 17-1: The basic parts of a mass spectrometer.
Now I talk about the specifics of each of these parts.
The inlet
Mass spectrometry is performed in the gas phase. Therefore, the first thing that happens after the sample is injected into the spectrometer is that the sample is vaporized by heating the sample under low pressure. After the sample is in the gas phase, it’s pushed into the smasher by the flow of an inert gas (usually helium).
Electron ionization: The smasher
A mass spectrometer can use many different “mallets” to ionize molecules. Ionize is organic-speak for smashing the neutral molecules into charged fragments. The most common mallet is one that incorporates high-energy electrons (there are other kinds, but this is a popular one). Mass spectrometry using this type of smasher is termed electron-ionization mass spectrometry (EIMS). (On an exam, be sure to use this term, not “smasher.”) In an electron-ionization mass spectrometer, the molecules are pushed through a stream of very high-energy electrons to ionize them. When one of these high-energy electrons crashes into the molecule, an electron is ejected from the molecule, as shown in Figure 17-2.
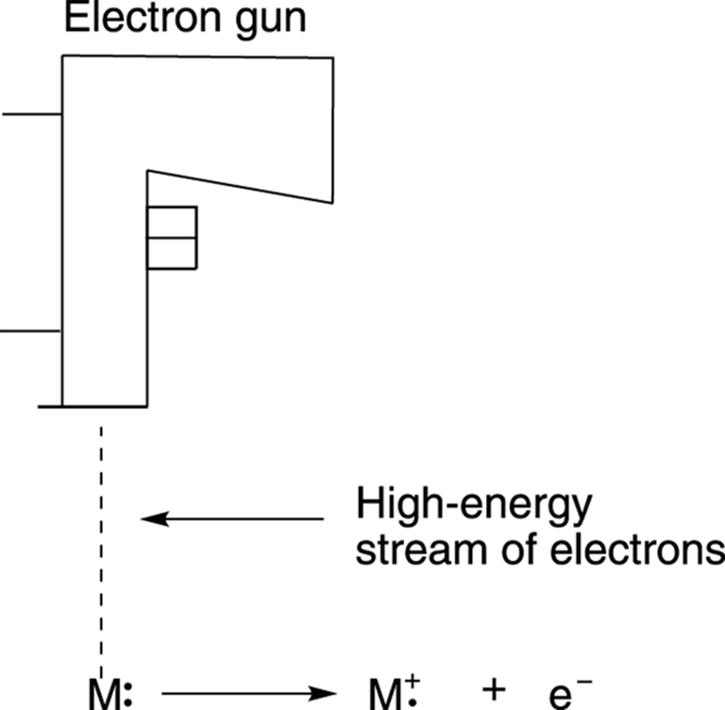
FIGURE 17-2: The ionization of molecules in the smasher of an electron ionization mass spectrometer.
Both the smashing electron from the electron source (diagramed in the figure as an electron gun) and the electron that’s kicked out of the molecule don’t play any further roles in the process and are simply discarded. But each molecule that has had an electron knocked out becomes a species called a radical cation (abbreviated +·). The “cation” portion of the name results from the fact that the molecule has lost an electron and is now positively charged, and the “radical” portion of the name comes about because one of its electrons is unpaired. For more on radicals, seeChapter 8. These radical cations can either remain in one big piece or spontaneously fragment further into several smaller pieces. (I talk more about this later.) In either case, all the fragments move on toward the sorter and weigher.
The sorter and weigher
What happens after the molecules are smashed and become radical cations? Some of them stay as they are and move through the spectrometer to the weigher. Those pieces that stay whole give a peak in the mass spectrum called the molecular ion peak, or M+ peak. This molecular ion peak tells you the molecular weight of the molecule, because losing an electron doesn’t really change the weight of the molecule (it’s like a tractor trailer losing a lug nut). The molecular ion peak is the most important piece that’s weighed by the mass spectrometer, because knowing the molecular weight of the unknown molecule is a very valuable piece of information when you’re trying to determine its structure.
Some of the radical cations stay intact and lead to the molecular ion peak, but others break down spontaneously into smaller bits. Most commonly, the radical cations break into two pieces, one piece that’s a neutral radical, and one piece that’s a positively charged cation (see Figure 17-3). For reasons I talk about later, only the charged cationic species is “seen” and weighed by the mass spectrometer. The neutral radicals are discarded and go undetected.
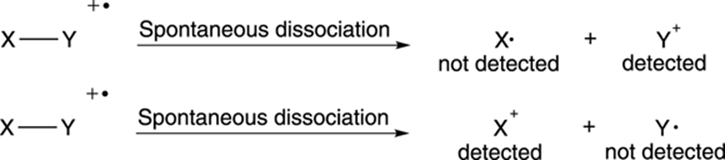
FIGURE 17-3: The dissociation of radical cations.
After the pieces have become charged by the smasher, they’re sent through the weigher. This weigher, though, isn’t like the scale that collects dust in your bathroom. Instead, because the fragments are charged, they can be weighed by accelerating them through the poles of a magnet. When charged particles move through a magnetic field, they’re deflected (pulled off course) by the magnetic field; all uncharged fragments are not deflected by the magnet and simply crash and burn into the walls of the spectrometer, never to be seen again. Therefore, only charged particles can hit the detector.
The weight of a fragment determines how much it will be deflected by the magnet. Light fragments are deflected a lot by the magnet, while heavier fragments are deflected less. With a low magnetic field strength, small particles will be bent the right amount by the spectrometer to hit the detector, while all the other fragments will crash and burn into the walls of the spectrometer. With a larger magnetic field strength, larger particles will curve the right amount to hit the detector. By varying the magnetic field strength (which is proportional to the weight of the fragment), the weights of the fragments can be determined.
Detector and spectrum
The number of ions that bend the right amount at a particular magnetic field strength to hit the detector is measured. On a mass spectrum, the molecular weight of the fragment is shown on the x-axis versus the relative number of fragments that hit the detector on the y-axis (the intensity). The most intense peak on the mass spectrum is arbitrarily assigned an intensity value of 100. The full mass spectrometer is shown in Figure 17-4.
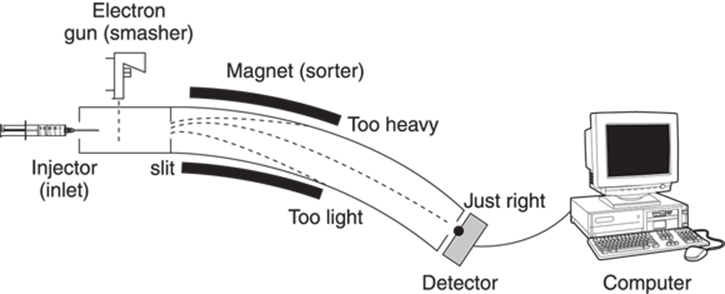
FIGURE 17-4: The inside of a mass spectrometer.
 It’s actually not the weight of the fragment that’s measured on the x-axis of the mass spectrum, but the mass (m) to charge (z) ratio (called the m/z value). A fragment that has a +2 charge will require a smaller magnetic field to deflect it toward the detector than a fragment that has a +1 charge, and will therefore show up on the mass spectrum at half the m/z value. However, since most fragments simply have charges of +1 (and since the vast majority of undergraduate classes will not discuss fragments with more than one charge), the m/z axis is often simply said to represent the molecular weight of the fragment.
The Mass Spectrum
Figure 17-5 shows the mass spectrum for the molecule pentane (C5H12). This spectrum contains several peaks that are worth pointing out. The molecular ion peak, or M+ peak, is the peak at m/z 72, which represents the molecular weight of the molecule (72 amu). The tallest peak in the spectrum, which is always given a value on the y-axis of 100, is called the base peak. The base peak represents the most abundant fragment that hits the detector. In some spectra, the base peak is also the M+ peak, although in this case it’s not.
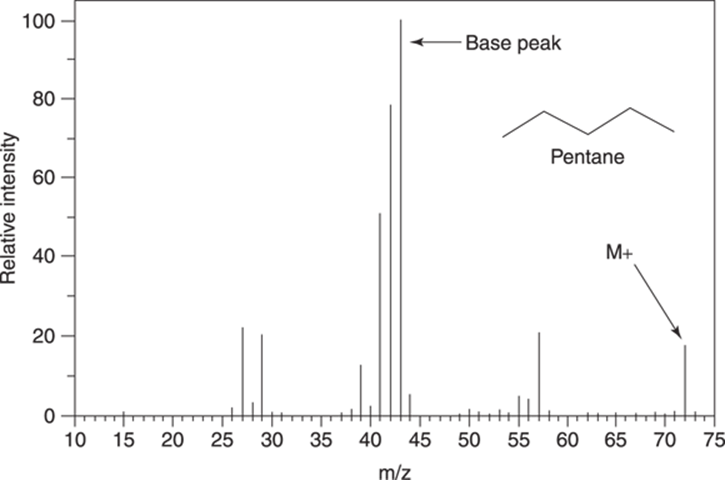
FIGURE 17-5: The mass spectrum for pentane (C5H12).
The mass spectrum for pentane is fairly simple, but it still contains a lot of peaks, each of which represents a different fragment that was formed by electron ionization. Later in the chapter, I show you how to determine the structure of some of the most important fragments in the mass spectrum. Usually, though, you can’t expect to be able to identify all the peaks in a mass spectrum (or even most of them).
Kind and Caring: Sensitivity of Mass Spec
One of the most valuable features of mass spectrometry is its sensitivity. NMR and IR spectroscopy usually require milligrams of material to do an analysis, but mass spec requires only nanograms (10–9 grams) of material. This sensitivity is particularly useful for characterizing compounds isolated from biological systems in which many substances are produced and isolated in miniscule amounts. (The structure of the ketone chiloglottone, discussed in Chapter 5, was determined solely using mass spectrometry because it was isolated in such small amounts.) Unlike NMR and IR spectroscopy, however, the sample used to take a mass spectrum is nonrecoverable, so the tiny amounts that are required in order to obtain a spectrum are destroyed and cannot be re-collected for later study.
Resolving the Problem: Resolution
In addition to its ability to detect tiny amounts of material, mass spectrometry can also weigh things with incredible accuracy. In other words, high-resolution mass spectrometers (HRMS) can determine the exact weight of a compound, enough to definitively identify a compound’s molecular formula, which is a very valuable piece of information. For example, the compounds with molecular formulas C3H6 and C2H2O both have molecular weights of about 42 amu. So, how can a mass spectrometer distinguish between them?
The answer lies in the fact that the mass spectrometer determines the weight of the molecular ion (M+) fragment with accuracy of several digits after the decimal point. Both C3H6 and C2H2O have molecular weights that are approximately — but not exactly — 42 amu. The molecular mass system is set up so that 12C has a mass of exactly 12.0000 amu, and the weights of all other atoms are calibrated against this number. Therefore, elements other than carbon don’t have masses that are exact whole numbers. By this system, the exact mass of C3H6 is 42.0469 amu and the exact mass of C2H2O is 42.0105 amu.
In this example, the masses of these two compounds differ by about 0.036 amu; this is a very small difference, really, but a difference that’s large enough to be distinguished by a good mass spectrometer. A mass spectrometer with a high enough resolution can detect these differences, and the correct molecular formula can therefore be deduced (usually, using a computer program). In this case, a mass spectrometer that’s accurate to the second decimal place would be able to distinguish between the two compounds. Most high-resolution mass spectrometers, however, are much more accurate than that, and many are accurate to the fourth decimal place.
Changing the Weight: Isotopes
Because mass spectrometry determines the weights of fragments, atoms that naturally have heavy isotopes become important.
 Isotopes are atoms that have the same number of protons and electrons, but different numbers of neutrons.
Isotope effects are most readily observed in compounds containing the halogens chlorine (Cl) and bromine (Br). In nature, chlorine consists of about 75 percent of the 35Cl isotope and about 25 percent of the heavier 37Cl isotope, in which the chlorine has two additional neutrons. This means that if 100 chlorine-containing molecules were chosen at random, on average 75 of them would contain the 35Cl isotope, while 25 of them would weigh two mass units more because they contain the heavier 37Cl isotope. Because mass spectrometry weighs molecules, these heavier-mass isotopes will be observed in the mass spectrum.
In fact, both of these isotopes will be seen in the mass spectrum. But because a sample of a chlorine-containing molecule has three times as many of the 35Cl isotope as it has of the heavier 37Cl isotope, the molecular ion peak (which corresponds to molecules containing the 35Cl isotope) will be three times as intense as the peak two mass units heavier that corresponds to molecules containing the heavier isotope. Because this heavy isotope peak is two mass units heavier than the peak of the molecular ion containing the 35Cl isotope, it’s called the M+2 ion. (If the heavy isotope is heavier by one neutron, it’s called the M+1 isotope peak; by two neutrons, the M+2 peak; by 3 neutrons, the M+3, and so on.)
These isotope effects allow you to spot molecules that contain chlorine, because the spectra of a chlorine-containing molecule will contain a peak that’s two mass units heavier than the molecular ion (M+) and that’s one-third as intense as the M+ peak (see Figure 17-6).
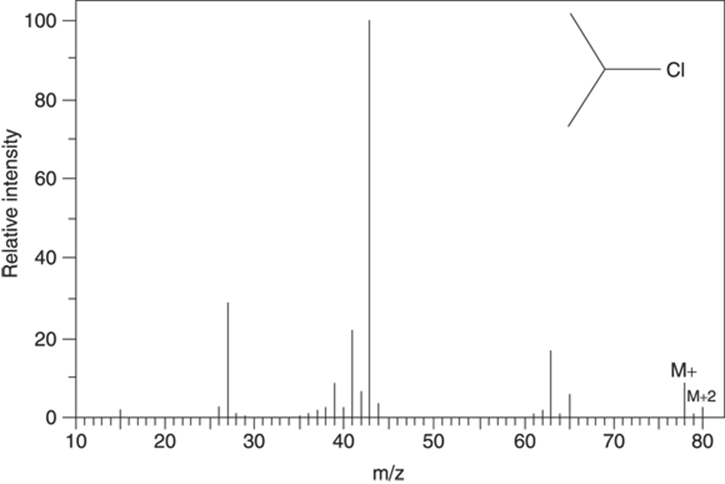
FIGURE 17-6: The mass spectrum for 2-chloropropane (C3H7Cl).
Naturally occurring bromine consists of a mixture of isotopes that’s approximately 50 percent 79Br and 50 percent 81Br. Therefore, bromine is easily spotted in the mass spectrum by observing a peak of approximately equal intensity two mass units higher than the molecular ion peak (seeFigure 17-7).
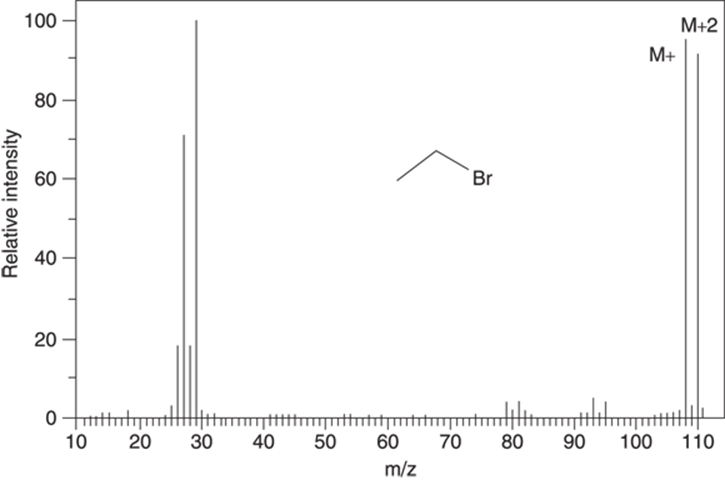
FIGURE 17-7: The mass spectrum for ethyl bromide (C2H5Br).
Naturally occurring iodine is virtually 100 percent 129I, so unlike the spectra of chlorine- and bromine-containing molecules, iodine-containing molecules don’t show isotope peaks. However, iodo compounds can often be spotted by observing the iodonium peak (I+) in the mass spectrum at m/z 129.
Other atoms have isotopes that are less abundant. Naturally occurring carbon contains about 1 percent of the 13C isotope. Because a molecule that consists of many carbons will have a greater chance of having a 13C atom, molecules with many carbon atoms will have a larger 13C isotope peak in the mass spectrum than molecules that contain fewer carbon atoms. (Because 13C is one mass unit heavier than 12C, the isotope peak is called the M+1 peak.) This, in fact, is a crude way to determine the number of carbons in the molecule, because the size of the M+1 isotope peak relative to the molecular ion (M+) peak depends on the number of carbons in the molecule.
The Nitrogen Rule
Any molecule that contains only carbon, hydrogen, oxygen, or the halogens (F, Cl, Br, I), will have an even-numbered molecular weight. However, molecules that contain an odd number of nitrogens will have odd molecular weights. Knowing this, you can spot certain molecules that contain nitrogen, because if your molecular ion (M+) peak occurs at an odd-numbered m/z value, the molecule likely contains an odd number of nitrogens. This is because nitrogen has three bonds and a lone pair of electrons, rather than four bonds like carbon (thus, for every nitrogen you substitute for carbon, you lose one hydrogen). An even number of nitrogens will lead to an even-numbered molecular weight (see Figure 17-8).
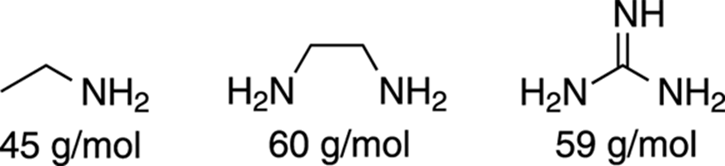
FIGURE 17-8: Seeing the nitrogen rule.
Identifying Common Fragmentation Patterns
Often, predicting what peaks will be observed in the mass spectrum is possible simply by looking at a structure and seeing which pieces would be easy to break off to make stable cations. In this section, I go through some common structural features that make stable cations.
The ionizer makes the molecules into radical cations, which then generally break apart into a cationic piece (which is seen by the detector) plus a neutral radical piece (not seen by the detector).
Smashing alkanes
Alkanes generally break apart to make the most highly substituted cation. Tertiary cations (cations substituted with three carbons) are more stable than secondary cations (cations substituted with two carbons), which in turn are more stable than primary cations (cations substituted with only one carbon). Therefore, breaks in a molecule that make tertiary cations are likely to give fragments that correspond to large peaks in the mass spectrum, because the most stable fragments produce the largest peaks (see Figure 17-9).
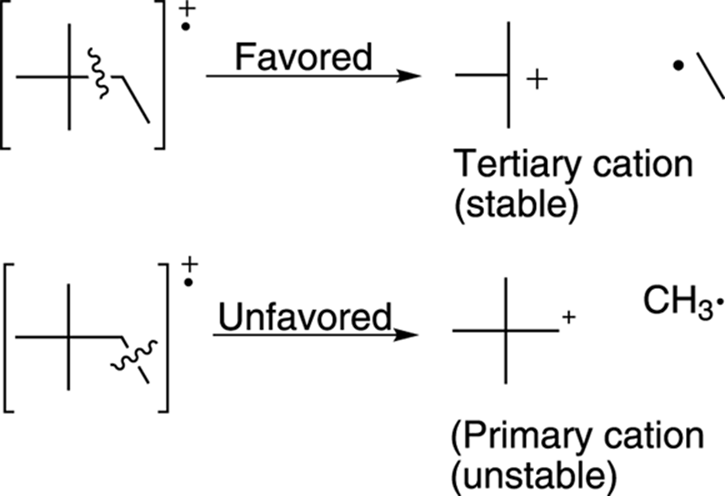
FIGURE 17-9: Favored and unfavored bond cleavage.
Breaking next to a heteroatom: Alpha cleavage
When a molecule contains heteroatoms (elements such as oxygen, sulfur, and nitrogen), breaking next to these atoms makes cations that are resonance stabilized. For example, breaking the C-C bond next to an alcohol group creates a resonance-stabilized carbocation. This type of break is called alpha cleavage and is commonly seen in alcohols (as shown in Figure 17-10).
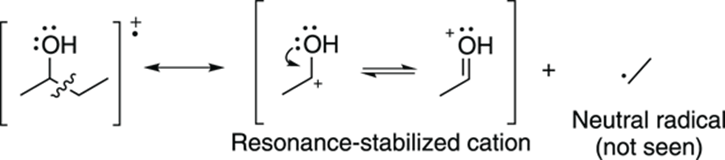
FIGURE 17-10: Alcohol alpha cleavage.
This same pattern of alpha cleavage is observed with amines, as shown in Figure 17-11.

FIGURE 17-11: Amine alpha cleavage.
Alpha cleavage is also commonly seen in ethers, where the bond breaks adjacent to the oxygen (see Figure 17-12).
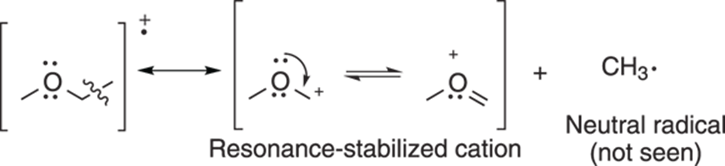
FIGURE 17-12: Ether alpha cleavage.
Breaks are often seen next to carbonyl groups (C=O groups), because this creates the resonance-stabilized cation (see Figure 17-13). (I hope this is getting repetitious.)

FIGURE 17-13: Carbonyl alpha cleavage.
Loss of water: Alcohols
In addition to alpha cleavage, alcohols readily lose a water molecule to form an alkene (a carbon-carbon double bond). This is why the mass spectrum of an alcohol often has a peak corresponding to the loss of 18 mass units (the weight of water). See Figure 17-14.
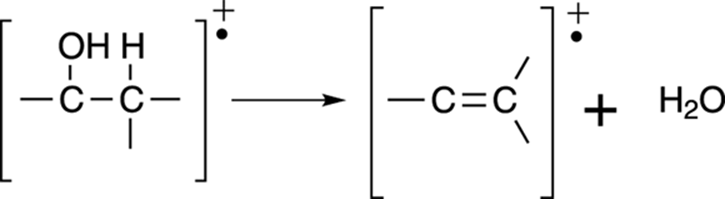
FIGURE 17-14: Alcohol dehydration.
Rearranging carbonyls: The McLafferty rearrangement
Some radical cations can also rearrange. The most famous rearrangement is called the McLafferty rearrangement. It can occur on carbonyl compounds (such as ketones and aldehydes; see Chapter 5 for more on carbonyl functional groups) that have a hydrogen on a carbon that’s three carbons away from the carbonyl group. This third carbon position is called the gamma, or γ, position. The rearrangement involves a six-membered ring transition state in which the carbonyl group pulls off the γ proton, breaking the molecule into two pieces. These pieces consist of an enol radical cation (recall that an enol is a combination of an alkene and an alcohol) and a neutral alkene fragment (a fragment with a carbon double bond). The enol radical cation is observed in the mass spectrum, while the neutral alkene fragment is not observed. Any carbonyl compound that has a hydrogen in the γ position is likely to have a peak in the mass spectrum corresponding to the enol radical cation that’s formed by the McLafferty rearrangement of that carbonyl compound. An example of the McLafferty rearrangement is shown in Figure 17-15.
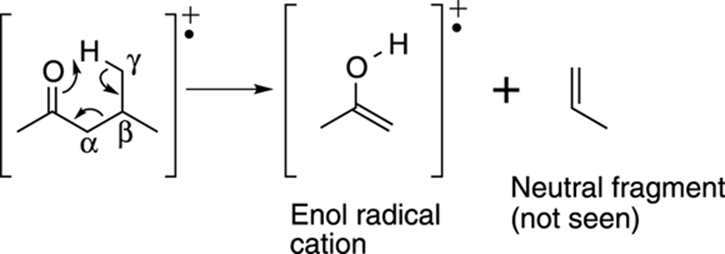
FIGURE 17-15: The McLafferty rearrangement.
Breaking benzenes and double bonds
Breaking one carbon away from an aromatic ring leads to the stable benzylic cation as shown in Figure 17-16. This benzene ring stabilizes the cation through resonance (see Chapter 3).
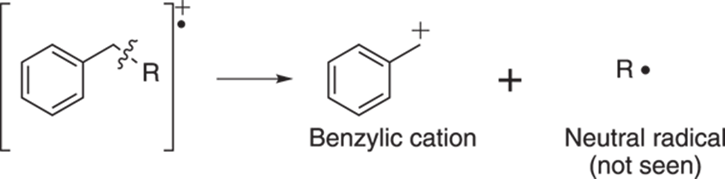
FIGURE 17-16: Benzylic cleavage.
Likewise, breaking the bond one carbon away from a double bond leads to an allylic cation that’s stabilized by resonance. Note that breaking adjacent to the double bond leads to the unstable vinylic cation, as shown in Figure 17-17.
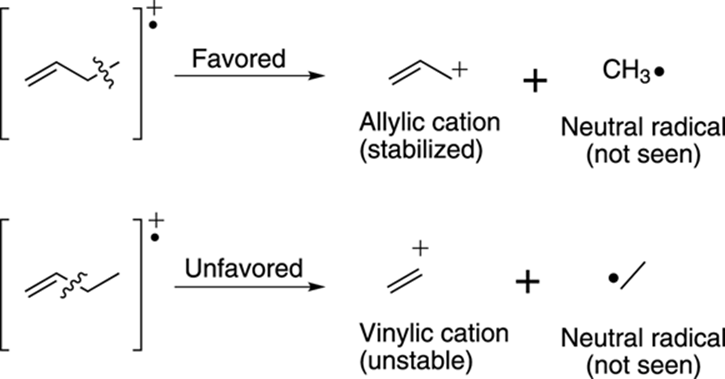
FIGURE 17-17: Fragmentation next to alkenes.
 The loss of 15 mass units from the molecular ion generally indicates a loss of a methyl (CH3) group. The loss of 29 mass units often indicates loss of an ethyl (CH2CH3) group.
Self test: Working the problem
Here’s a sample question of the type you may see on an exam: The mass spectrum for 2-pentanone is shown in Figure 17-18. Draw the fragments responsible for the peaks in the mass spectrum at m/z 71, 58, 43.
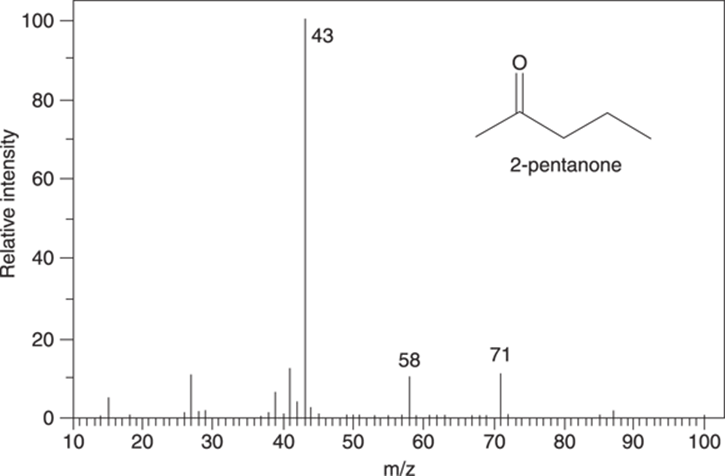
FIGURE 17-18: Mass spectrum for 2-pentanone (C5H10O).
The main piece of information to remember in answering these types of questions is that each of the structures you draw must be positively charged. Neutral fragments are discarded and don’t reach the detector.
Usually the best way to start is by looking for likely breaks in the molecule. Can you get an alpha cleavage (a break next to a heteroatom like O or N)? Can the molecule break to form a benzylic fragment or allylic fragment? Can a tertiary cation be made? If it’s a carbonyl compound, does it have a gamma hydrogen that could be involved in a McLafferty rearrangement?
This example has neither a benzene ring nor a carbon-carbon double bond. It doesn’t have the capacity to make a tertiary cation, either. But it does have a heteroatom (oxygen). So, alpha cleavage would definitely be a possibility. Additionally, because it’s a carbonyl compound and has a hydrogen in the gamma position, you’ll probably see a peak for the McLafferty rearrangement.
Start with alpha cleavage. The molecule can split on the left of the carbonyl group to make the resonance-stabilized cation that has a molecular weight of 71 amu. You may have already noticed that this peak with an m/z of 71 is 15 mass units below the molecular ion peak, suggesting a loss of a methyl group. This cleavage is shown in Figure 17-19.
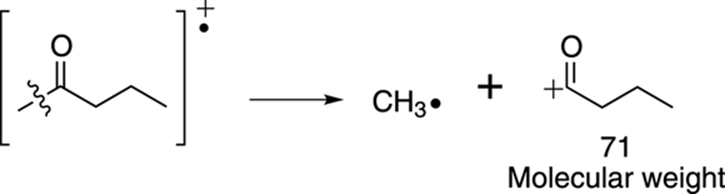
FIGURE 17-19: Alpha cleavage.
Or the molecule could split via an alpha cleavage on the right side of the carbonyl to make a cationic fragment that weighs 43 amu, as shown in Figure 17-20.
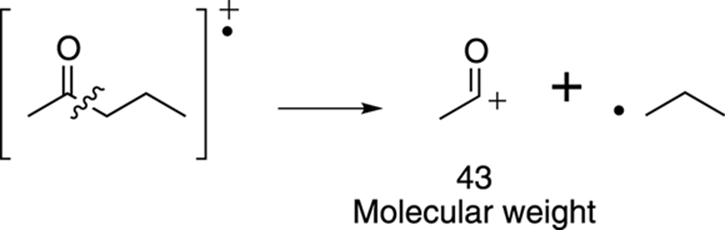
FIGURE 17-20: Another possible alpha cleavage.
Now try the McLafferty rearrangement. I’ve redrawn the molecule to make it easier to see which bonds get made and which bonds get broken. The McLafferty rearrangement gives the piece that weighs 58 amu, as shown in Figure 17-21.
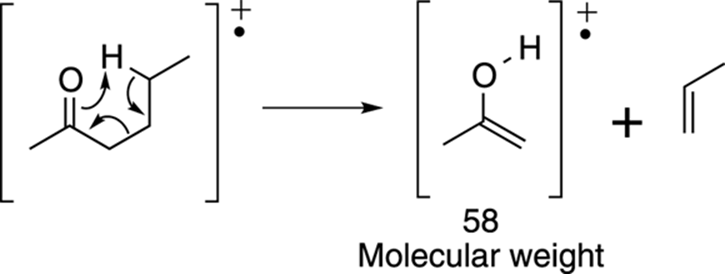
FIGURE 17-21: The McLafferty rearrangement.
Key Ideas Checklist
For mass spectrometry, there’s a good bit of detail that you need to keep track of, so it’s easy to lose sight of the big picture. But here’s a list of the main ideas and uses of mass spectrometry:
· Mass spectrometry is very sensitive. Only miniscule amounts of material are required to do an analysis.
· Only positively charged fragments are observed in a mass spectrum.
· The weights of fragments are plotted versus the intensity (or relative number of fragments) on the spectrum. The highest-intensity peak is arbitrarily assigned an intensity of 100 and is called the base peak.
· Atoms that have abundant heavy isotopes can often be spotted in a mass spectrum (particularly Cl and Br).
· Stable fragments (cations) have more intense peaks in the mass spectrum than do unstable fragments.
· The molecular formula of an unknown can often be determined using high-resolution mass spectrometers by looking at the parent ion, or M+ peak. The parent ion is a molecule that was ionized but did not break apart into smaller pieces before it hit the detector.