5 Steps to a 5: AP Macroeconomics 2017 (2016)
STEP 4
Review the Knowledge You Need to Score High
CHAPTER 11
Money, Banking, and Monetary Policy
IN THIS CHAPTER
Summary: People often think that economics is the study of money. While you have already discovered that, strictly speaking, this is not the case, there is no denying the critical role of money in any economic system in the exchange of goods and services, employment of resources, and macroeconomic stability. This chapter first briefly defines money, the functions that it serves, and the market for it. Following a brief overview of the fractional reserve banking system, we discuss money creation. We then focus on the tools of monetary policy that the Federal Reserve uses to influence the macroeconomy. The chapter concludes with a discussion of fiscal and monetary policy coordination and how one school of economic thought sees the role of monetary policy.

Key Ideas
![]() Money as an Asset
Money as an Asset
![]() The Money Market
The Money Market
![]() The Money Multiplier
The Money Multiplier
![]() Monetary Policy
Monetary Policy
11.1 Money and Financial Assets
Main Topics: Financial Assets, Functions of Money, Present Value and Future Value, Supply of Money, Demand for Money, The Money Market, Changes in Money Supply
The paper and coin currency that we carry around in our pockets is typically used for one thing: to buy stuff. Before we get into a more thorough discussion about money, let’s briefly discuss financial assets other than the money in your pocket.
In general, money is anything that is used to facilitate exchange of goods between buyers and sellers. Human history has seen many things used as money, from shells and tobacco to gold and spices. These different forms of money have all performed certain functions.
Financial Assets
We have already discussed investment in physical (or capital) assets like machinery or new construction as components of GDP. The firm invests in a physical asset if the expected rate of return is at least as high as the real interest rate. Sometimes firms and households seek other forms of assets as a place for their money. Financial investments also yield a rate of return. We spend much more time discussing money as a short-term financial asset, but quickly address other financial assets like stocks and bonds.
Stocks
A share of stock represents a claim on the ownership of the firm and is exchanged in a stock market. Firms that wish to raise money for capital investment can issue, and sell, these partial shares of ownership. This form of equity financing avoids debt but relinquishes a small degree of control over the management, and profits, of the firm.
Bonds
A bond is a certificate of indebtedness. When a firm wants to raise money by borrowing, it can issue corporate bonds that promise the bondholders the principle amount, plus a specified rate of interest, with repayment on a specific maturity date. This form of debt financing commits the corporation to interest payments, but does not relinquish shares of ownership. Like stocks, bonds can be bought and sold in a secondary market. We shall see how the central bank can intervene in this market in a way that has profound effects on the economy.
Functions of Money
In general, money is anything that is used to facilitate an exchange of goods between buyers and sellers. Human history has seen many things used as money, from shells and tobacco to gold and spices. These different forms of money have all performed certain functions.
Today’s paper and coin money is called fiat money because it has no intrinsic value (like gold) and no value as a commodity (like tobacco). It serves as money because the government declares it to be legal tender and, in doing so, the government assures us that it performs three general functions:
• Medium of exchange . Your employer exchanges dollars for an hour of your labor. You exchange those dollars for a grocer’s pound of apples. The grocer exchanges those dollars for an orchard’s apple crop, and on and on. If it weren’t for money, we would still be engaging in the barter system, an extremely inconvenient way to exchange goods and services. If I were a cheese maker and I wanted apples, I would need to find an orchard that also needed cheese, and this would be a supremely difficult way to do my shopping.
• Unit of account . Units of currency (dollars, euro, yen, etc.) measure the relative worth of goods and services just as inches and meters measure relative distance between two points. Again, this is an improvement over the barter system where all goods are measured in terms of many other goods. The value of a pound of cheese in a barter economy is measured in a dozen eggs, or a half pound of sausage, or three pints of ale. With money, the value of cheese, and all other goods and services, is measured in terms of a monetary unit like dollars.
• Store of value . So long as prices are not rapidly increasing, money is a decent way to store value. You can put money under your mattress or in a checking account, and it is still useful, with essentially the same value, a week or a month later. If I were the town cheese maker, I must quickly find merchants with whom to exchange my cheese, because if I wait too long, moldy cheese loses its value.
Time Value of Money
Money may serve as a store of value, but money does lose its value over time. Most of us prefer to receive money income as early as possible (the sooner we can begin to consume stuff) and pay our debts as late as possible. If you lend your best friend $100, would you rather be paid back tomorrow or five years from tomorrow? If you are not going to charge your best friend any interest on this loan, then you probably prefer your money as soon as possible. If your best friend paid you back in five years without interest, your $100 would certainly have lost value over time due to inflation. After all, not having $100 for such a long period of time means that you were unable to consume $100 worth of goods! Delaying your consumption of goods that would give you utility must surely come at a cost. The idea of a time value of money is perhaps the most important reason for paying interest on savings and charging interest on borrowing.
Present Value and Future Value
Many decisions in life involve paying upfront costs today with the promise of a payoff tomorrow or even years from now. Many of you are familiar with this trade-off because you were told by a parent that “If you finish eating your vegetables, you can watch TV before bedtime,” or “If you wash the car, you can go to the movie with your friends.” As you consider attending college, the same principle applies. The costs (tuition, books, etc.) are paid today, but the payoffs (marketable skills, useful knowledge, etc.) are received years from today. As the previous section illustrates, dollars today are worth more than future dollars; so there must be a way to convert present and future dollars to the same time period so that wise decisions can be made. The interest rate is the key.
Let’s again assume that you are going to lend your friend $100 and that he is going to pay you back in one year. We’ll also assume that there is no inflation, so a 10 percent nominal interest rate is equal to the real interest rate. The opportunity cost of lending your friend $100 is the interest you could have earned—$10, after a year had passed. So the interest rate measures the cost to you of forgoing the use of that $100. After all, you could have spent $100 on clothing right now that would have provided immediate benefit to you. To see the relationship between dollars today (present value, or PV) and dollars one year from now (future value, or FV), we can use a simple equation:
FV = PV × (1 + r )
or, using our example:
FV = $100 × (1.10) = $110
In other words, one year into the future, that $100 will be worth $110.
We can also rearrange our equation and solve for the present value PV:
PV = FV/(1 + r )
and, using our example again:
PV = $110/(1.10) = $100
This tells us that $110 a year from now is worth only $100 in today’s dollars.
If you were lending the money for a period of two years,
FV = PV(1 + r )2 = $100 × (1.10) × (1.10) = $121
What does this all mean? It means that your friend, as a borrower, must pay you $21 to compensate you for the fact that he has your $100 for a period of two years. It also says that had you, as a saver, put the $100 in the bank today, two years from now, you would have $121 to spend on goods and services. This implies that you would be completely indifferent to having $100 in your hand today or $121 two years from today. The differing sums are equivalent units of purchasing power, just measured at two different points in time, and it is the interest rate that equates the two.
So, to summarize:
• Money today is more valuable than the same amount of money in the future.
• The present value of $1 received one year from now is $1/(1 + r ).
• The future value of $1 invested today, for a period of one year, is $1 × (1 + r ).
• Interest paid on savings and interest charged on borrowing is designed to equate the value of dollars today with the value of future dollars.
Supply of Money
At the core of monetary policy is regulation of the supply of money. Because our paper money is not backed by precious metals or crown jewels, we trust the government to keep the value of our money as stable as possible. This value is guaranteed by stabilizing the money supply , which is measured by the central bank as M 1 and M 2 the latter being more broadly defined and less liquid than the former. Liquidity refers to how easily an asset can be converted to cash. A five-dollar bill, already being cash, is as liquid as it gets. A Van Gogh painting hidden in your attic is also an asset but not a very liquid one.
We can say that:
“There are a couple of questions on this. Know what is included in each category.”
—Kristy, AP Student
• M 1 = Cash + Coins + Checking deposits + Traveler’s checks. M 1 is the most liquid of money definitions.
• M 2 = M 1 + Savings deposits + Small (i.e., under $100,000 certificates of deposit) time deposits + Money market deposits + Money market mutual funds. M 2 is slightly less liquid because the holders of these assets would likely incur a penalty if they wished to immediately convert the asset to cash.
At any given point in time, the supply of money is a constant. This implies that the current money supply curve is vertical. Because other measures of money supply are based upon the most liquid M 1, when we discuss the money supply, we focus on M 1. Insight gained from studying the expansion and contraction of M 1 can be applied to M 2.
Demand for Money

People demand goods like cheese because cheese helps satisfy wants. People demand money because it facilitates the purchase of cheese and other goods. In addition to this transaction demand for money, people also demand money as an asset, just as a government bond or a share of Intel stock is an asset. We quickly look at demand for money as the sum of money demand for transactions and money demand as an asset.
Transaction Demand . As nominal GDP increases, consumers demand more money to buy goods and services. For a given price level, if output increases, more money is demanded. Or for a given level of output, if the price level rises, more money is demanded. If nominal GDP is $1,000 and each dollar is spent an average of four times each year, money demand for transactions would be $1,000/4 = $250. If nominal GDP increases to $1,200, money demand for transactions increases to $1,200/4 = $300. We assume that the nominal rate of interest does not affect transaction demand for money, so when plotted on a graph with the nominal interest rate on the y axis, it is a constant.
Asset Demand . Money can be held as an asset at very little risk. If you put money under your mattress, there is the advantage of knowing that a crashing stock market or real estate market does not diminish the value of this asset. The main disadvantage of putting this asset under your mattress is that it cannot earn any interest as it would were you to invest that money in bonds, for example. As the interest rate on bonds rises, the opportunity cost of holding money under your mattress begins to rise, and so you are more likely to lessen your asset demand for money. At a lower interest rate on bonds, you are more likely to increase your asset demand for money.
Total Demand . Plotted against the nominal interest rate, the transaction demand for money is a constant MDt . Adding this constant amount of money needed to make transactions to a downward-sloping asset demand for money (MDa ) provides us with the total money demand curve. This is seen in Figure 11.1
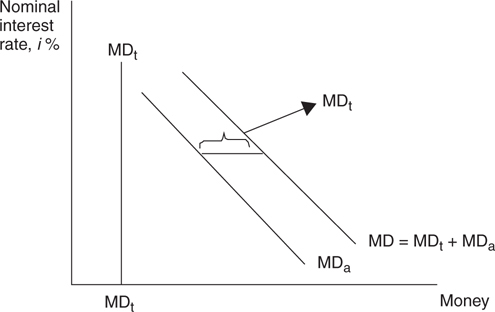
Figure 11.1
The Money Market
The central bank, having established a given level of money supply circulating in the economy, allows us to incorporate a vertical money supply (MS) curve with a downward-sloping money demand curve to complete the money market. John Maynard Keynes developed the theory of liquidity preference , which postulates that the equilibrium “price” of money is the interest rate where money supply intersects money demand. Just like any market, if the price is below equilibrium (a shortage), the price must rise, and if the price is above equilibrium (a surplus), the price must fall. Money demand can increase if more transactions are being made, but the real focus of the rest of this chapter is on changes in money supply. Equilibrium is shown in Figure 11.2 .
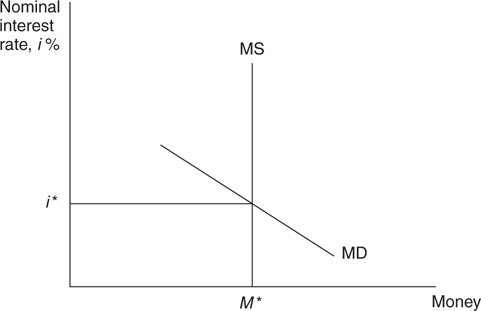
Figure 11.2
How Is the Money Market Different from the Market for Loanable Funds?
Understanding the difference between the money market and the loanable funds market can be tough, so we’ll take it in two and a half parts. I’m sure the first is much more helpful, the second much more esoteric, and the half is going to earn you the graphing points.
“This is an important question. Know the difference.”
—AP Teacher
1. Breadth of scope .
The supply of loanable funds, which varies directly with the interest rate, comes from saving. The supply of money is more inclusive than just saving; it includes currency and checking deposits. A $100 bill in your wallet would fall into the money supply curve, but not into the supply of loanable funds. The demand for loanable funds comes from investment demand. The demand for money includes the money used for investment, but also for consumption (transaction demand) and for holding as an asset (asset demand). So basically the money market, both on the supply and the demand side, is broader, and more inclusive, than the market for loanable funds. The price (aka the interest rate) appears to be the same in both markets, and is the result of …
2. Different philosophies .
We don’t want to delve too much into the Keynesian versus Classical philosophical debates because they are quite unlikely to appear on your AP Macroeconomics exam. It can seem a little confusing to show the interest rate as the “price” in both the market for loanable funds and the market for money. The reason that both markets are presented here, and in your textbook, is that they represent fundamental differences in macroeconomic philosophies.
• Classical economists believe that the price level is flexible and long-run GDP adjusts to the natural rate of employment. For any level of GDP, the interest rate adjusts to balance the supply and demand for loanable funds and the price level adjusts to keep the money market in equilibrium.
• Keynesian economists believe that the price level is sticky. For any price level, the interest rate adjusts to balance the supply and demand for money, and this interest rate influences aggregate demand and thus the short-run level of GDP.
• Bottom line here: The two different ways of looking at the interest rate are the result of two different ways of looking at the overall economy and the difference in the long-run (Classical) and short-run (Keynesian) views of the economy.
… and ½. Graphing .
While it appears that the same interest rate is graphed on the vertical axis of both the loanable funds and money market graphs, they are not in fact the same. It is correct to label the vertical axis of the money market with a nominal interest rate and the vertical axis of the loanable funds market with the real interest rate. Changes in the money market can be viewed as short-term changes, and therefore the role of expected inflation is negligible. For long-term decisions like investment and saving, the price of investment, or return on saving, does depend upon expected inflation, and so it makes sense to focus on the real rate of interest when making long-term plans. Here’s a way to keep it straight: “Loanable funds are REAL-ly fun.”
• When asked to draw the money market, the best way to ensure that you receive the graphing point is to label the vertical axis in the money market as the “Nominal interest rate” or “n.i.r.”
• If you simply label the vertical axis in the money market as “%” or “Interest rate” you may not earn all the graphing points.
Changes in Money Supply
When we talk about monetary policy, we are really talking about money supply policy. The tools used to expand or contract the money supply are discussed later in this chapter, but it’s useful to see what is happening in the money market when the money supply increases or decreases.
An Increase in the Money Supply
Like the market for any commodity, when the supply increases, there exists a temporary surplus at the original equilibrium price. The money market is no different. At the original interest rate of 10 percent, the supply of money is $1,000. Now the Fed increases the money supply to $1,500. In Figure 11.3 , you can see that at 10 percent, there is now a surplus of money.
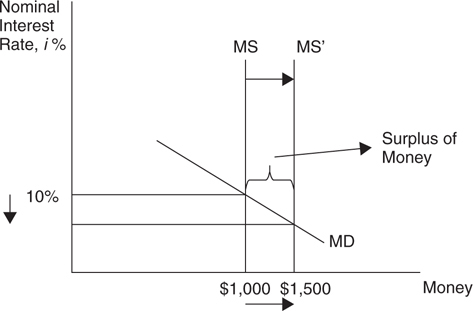
Figure 11.3
With surplus money on their hands, people find other assets, like bonds, as places to put the extra money. As more people increase the demand for bonds, the bond price rises, and this lowers the effective interest rate paid on the bonds.
How does this work?
A bond is selling at a price of $100 and promises to pay $10 in interest. The interest rate = $10/$100 = 10 percent. But if the price of the bond is driven up to $125, the same $10 of interest actually yields only $10/$125 = 8.0 percent. With lower interest rates available in the bond market, the opportunity cost of holding cash falls and the quantity of money demanded increases along the downward-sloping MD curve until MD = $1,500. An increase in the money supply therefore decreases the interest rate.
A Decrease in the Money Supply
If the Fed decides to decrease the supply of money from $1,000 to $500, there is a shortage of money at the 10 percent interest rate. A shortage of money sends some bondholders to sell their bonds so that they have money for transactions. An increase in the supply of bonds in the bond market decreases the price and increases the rate of interest earned on those assets.
How does this work?
If the original price of the bond is $100, promising to pay $10 in interest, the interest rate is 10 percent. If the price falls to $90, the same $10 of interest now yields $10/$90 = 11.1 percent. Higher interest rates on bonds increase the opportunity cost of holding cash, and so the quantity of money demanded falls until the interest rate rises to the point where MD = $500. This adjustment is seen in Figure 11.4 .
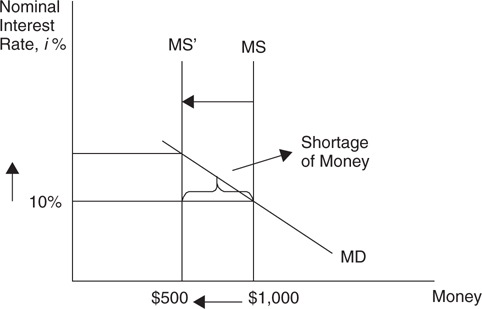
Figure 11.4
• Increasing the money supply lowers interest rates as surplus money moves into the bond market, increasing bond prices.
• Decreasing the money supply increases interest rates as a shortage of money creates a sell-off of bonds, decreasing bond prices.
11.2 Fractional Reserve Banking and Money Creation
Main Topics: Fractional Reserve Banking, Money Creation, The Money Multiplier
If you asked 10 bank tellers in your hometown, “Do you create money here?” I’m guessing that 9 or 10 of them would reply, “No way.” They’re wrong. The fractional reserve system of banking, plus the bank’s profit motive, creates money and opens the door for the Fed to promote or inhibit such money creation.
Fractional Reserve Banking
Fractional reserve banking is a system in which only a fraction of the total money supply is held in reserve as currency. The short story that follows illustrates how fractional reserve banking might have evolved.
Eli’s Community Bank (ECB) opens its doors and is now accepting deposits from citizens who want a safe place to put their money. Eli promises to always keep 100 percent of their money on hand so that if a person needs to buy groceries, he or she can simply withdraw some money and take it to the store.
One day, a citizen comes up to the bank asking to borrow some money to start a lemonade stand, but Eli has to turn her down because if any of his customers comes to withdraw money for groceries and finds that it was not in the vault, they would be extremely irritated. After a month or so, Eli observes that on any given day, there are very few withdrawals and most of the time the deposited money just sits there in the vault, doing nothing.
Eli decides, just to be safe, to hold a small percentage of his total deposits in the vault to cover any daily withdrawals, and earn some interest income by lending out the rest to households or small businesses. He even realizes that he must offer a small rate of interest to his depositors to compensate them for that “whole time value of money thing.” The fraction of total deposits kept on reserve is called the reserve ratio . Each time he receives a deposit, he puts that fraction in the vault and lends the rest. This process is the foundation for money creation and the Fed’s ability to conduct monetary policy.
Money Creation
A specific example of how the fractional reserve system can multiply one new bank deposit into new created money illustrates the process of money creation.
The reserve ratio is 10 percent. In other words,
Reserve ratio (rr ) = Cash reserves/Total deposits = .10
One way to see how checking deposits turn into loans and how loans turn into new money is to create a basic T-account, or balance sheet . The idea of a balance sheet is to show the assets and liabilities of a bank. In our example, total assets must equal total liabilities.
Asset. Anything owned by the bank or owed to the bank is an asset of the bank. Cash on reserve is an asset, and so are loans made to citizens.
Liability. Anything owned by depositors or lenders to the bank is a liability. Checking deposits of citizens or loans made to the bank are liabilities to the bank.
Let’s look at an example:
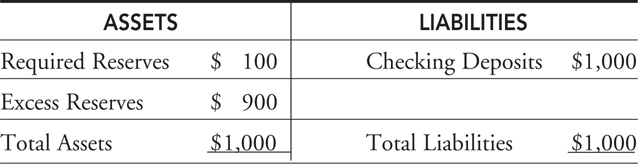
Step 1 . Katie takes $1,000 from under her mattress, deposits it at ECB, and opens a checking account. If the Federal Reserve, the central bank of the United States, tells the ECB that it must hold 10 percent of all deposits in reserve, then the ECB must comply and keep no less than $100 of Katie’s deposit as “required” reserves. The remaining $900 of the deposit are excess reserves and can be kept on reserve in the bank or lent to another person.
Balance Sheet ECB (Step 1)
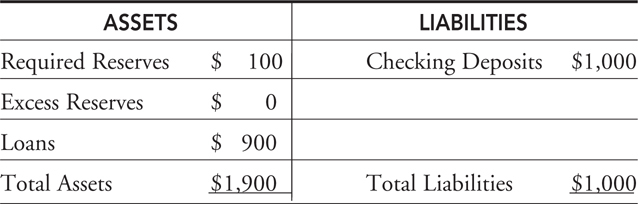
Step 2 . ECB lends all $900 in excess reserves to Theo, a local farmer.
Balance Sheet ECB (Step 2)
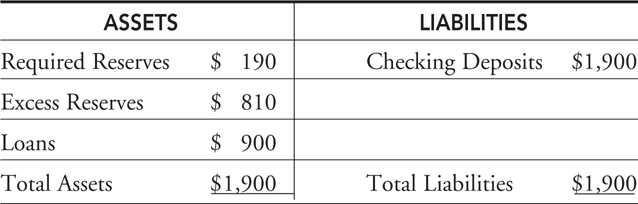
Step 3 . Theo uses his $900 at Tractor Supply, which has a checking account with ECB. Checking deposits have now increased by $900, and this is new money. ECB must keep $90 as required reserves, and excess reserves now total $810.
Balance Sheet ECB (Step 3)
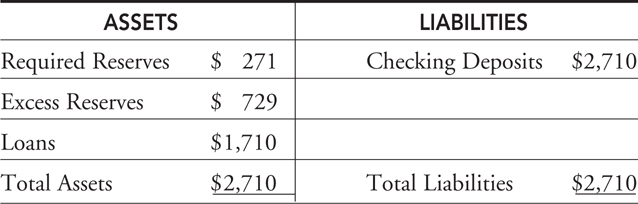
Step 4. ECB makes an $810 loan to Max, who wants to buy some furniture. Max spends $810 at Furniture Factory, which also banks with ECB, increasing checking deposits by $810. ECB must keep $81 in required reserves, leaving $729 in excess reserves.
Balance Sheet ECB (Step 4)
The Money Multiplier
An initial deposit of $1,000 creates, after only two loans are made and redeposited, $2,710 of checking deposits. This process could continue until there are no more excess reserves to be loaned, ultimately creating $10,000 of deposits. Of this $10,000 of deposits, $1,000 was already in the money supply (cash under Katie’s mattress) but $9,000 has been created as new money, seemingly out of thin air. This process is known as the money multiplier, which measures the maximum amount of new checking deposits that can be created by a single dollar of excess reserves. The idea of the money multiplier, not to mention the mathematics, is identical to our coverage of the spending multiplier.
M = 1/(Reserve requirement) = 1/rr (= 1/.10 = 10 in our example)
We had $900 in initial excess reserves and this would have multiplied into a maximum of $9,000 if (a) at every stage the banks kept only the required dollars in reserve, (b) at every stage borrowers redeposit funds into the bank and keep none as cash, and (c) borrowers are willing to take out excess reserves as loans.
• The maximum, or simple, money multiplier M = 1/rr .
• An initial amount of excess reserves multiplies by, at most, a factor of M .
This process works in reverse if, instead of an initial deposit, Katie makes a $1,000 withdrawal and puts the cash under her mattress. Rather than money creation, this could be called money destruction.
11.3 Monetary Policy
Main Topics: Expansionary Monetary Policy, Contractionary Monetary Policy, Open Market Operations, Changing the Discount Rate, Changing the Required Reserve Ratio, Coordination of Fiscal and Monetary Policy, Quantity Theory of Money
The Federal Reserve has three general tools of monetary policy at their disposal. The Fed can engage in open market operations, change the discount rate and change the required reserve ratio. Each of these can be used to expand or contract the money supply to stabilize prices and move the economy to full employment. We first look at the intended effects of expansionary and contractionary monetary policy and then investigate each of the tools in more detail.
Expansionary Monetary Policy
Unlike fiscal policy, which has a relatively direct impact on aggregate demand, real GDP, unemployment, and the price level, monetary policy takes a longer path to impact. Expansionary monetary policy is designed to fix a recession and increase aggregate demand, lower the unemployment rate, and increase real GDP. By increasing the money supply, the interest rate is lowered. A lower rate of interest increases private consumption and investment, which shifts the aggregate demand curve to the right. This process is illustrated in Figures 11.5 and 11.6 .
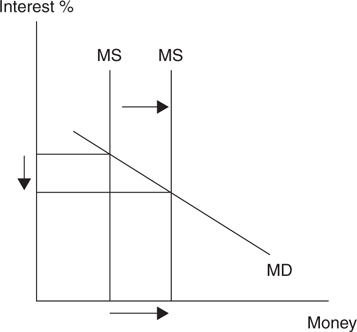
Figure 11.5
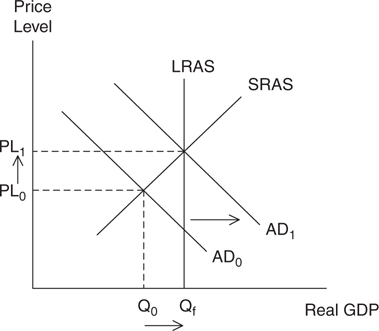
Figure 11.6
Contractionary Monetary Policy
As you might imagine, contractionary monetary policy has the opposite effect as expansionary and is designed to avoid inflation by decreasing aggregate demand, which lowers the price level and decreases real GDP back to the full employment level. By decreasing the money supply, the interest rate is increased. A higher rate of interest decreases private consumption and investment, which shifts the aggregate demand to the left. This process is illustrated in Figures 11.7 and 11.8 .
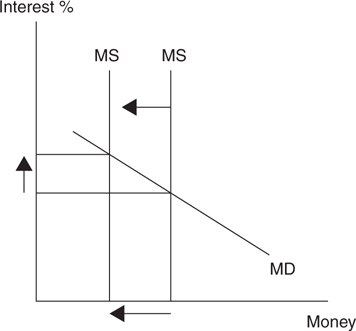
Figure 11.7
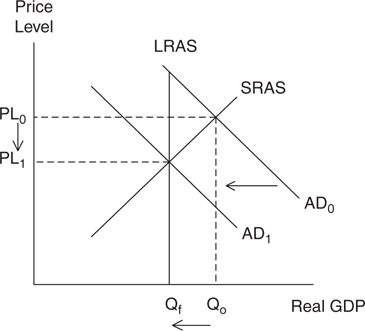
Figure 11.8
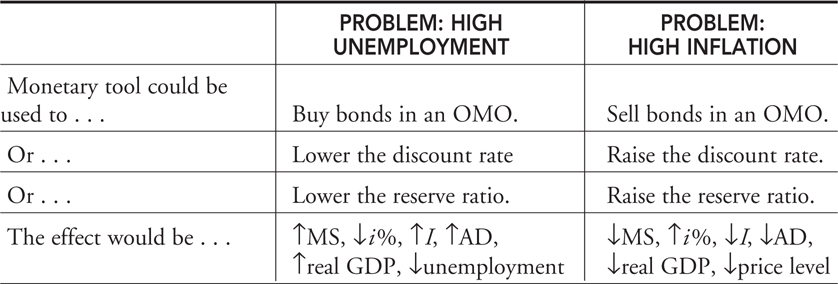
The chain of events for expansionary and contractionary monetary policy is as follows.
• Unemployment is too high →↑MS, ↓i %, ↑I , ↑AD, ↑real GDP, ↓unemployment
• Inflation is too high →↓MS, ↑i %, ↓I , ↓AD, ↓real GDP, ↓price level
Open Market Operations
Just like individuals and firms, the Federal Reserve, through the Federal Open Market Committee (FOMC), can buy and sell securities on the open market. Such an open market operation (OMO) typically involves the buying (or selling) of Treasury bonds from (or to) commercial banks and the general public. Of the three tools of monetary policy, conducting OMOs is by far the approach most frequently taken by the Fed.
Buying Securities . Commercial banks hold Treasury bonds as an asset rather than excess cash reserves. If the Fed offers to buy some of those securities, the banks would receive excess cash reserves and the Fed would get the bonds. When banks have excess reserves, the money creation process begins. The money supply increases and the interest rate falls.
“This is a great way to remember this!”
—AP Teacher
• When the Fed buys securities, the money supply expands. If it helps to remember, use this: “B uying B onds = B igger B ucks” (a larger money supply).
Selling Securities . Commercial banks might be in the market to buy Treasury bonds as an asset rather than excess cash reserves. If the Fed offers to sell some of their securities, the banks would get the bonds and their excess cash reserves would fall. When banks have fewer excess reserves, the money destruction process begins. The money supply decreases and the interest rate rises.
• When the Fed sells securities, the money supply contracts. If it helps to remember, use this: “S elling B onds = “S maller B ucks” (a smaller money supply).
The Federal Funds Rate
The discussion of OMOs seems to indicate that the buying and selling of securities is the main policy tool. If the FOMC wants to lower the interest rate, it buys bonds. If the FOMC wants to increase the interest rate, it sells bonds. In reality, the federal funds rate is set as a target interest rate and the FOMC then proceeds to engage in OMOs to hit that target rate. The federal funds rate is the interest rate that banks charge other banks for short-term loans. One bank might need to borrow funds from other banks, primarily to cover an unexpected dip in reserves. The important thing to remember is that our analysis of monetary policy is the same whether we talk about changes in the money supply or changes in the target federal funds interest rate.
Changing the Discount Rate
There are times when commercial banks need a short-term loan from the Fed. When they borrow from the Fed, they pay an interest rate called the discount rate . When the Fed lowers the discount rate, it makes it more affordable for commercial banks to increase excess reserves by borrowing from the Fed. The entire amount of the loan goes into excess reserves and can be borrowed by customers of the bank, increasing the money supply. As a practical matter, the Fed tends to change the discount rate in lockstep with the federal funds target rate.
To summarize:
• Lowering the discount rate (or federal funds rate) increases excess reserves in commercial banks and expands the money supply.
• Raising the discount rate (or federal funds rate) decreases excess reserves in commercial banks and contracts the money supply.
Changing the Required Reserve Ratio
Though rarely used, if the Fed wants to increase excess reserves and expand the money supply, it could change the fraction of deposits that must be kept as required reserves. If the reserve ratio is .50, half of all deposits must be kept in the vault, leaving half to be loaned as excess reserves. The money multiplier in this case is two. But if the required reserve ratio were lowered to .10, 90 percent of all deposits could be lent as excess reserves. The money multiplier increases to 10.
So:
• Lowering the reserve ratio increases excess reserves in commercial banks and expands the money supply.
• Increasing the reserve ratio decreases excess reserves in commercial banks and contracts the money supply.
Table 11.1 summarizes how various tools of monetary policy can be used to target high unemployment or high inflation.
Table 11.1
Coordination of Fiscal and Monetary Policy
Congress and the President develop fiscal policy through the annual process of approving a spending budget and tax law. Chapter 10 showed how fiscal policy can be used to move the economy closer to full employment, but that it has some weakness, especially in the case when private investment is crowded out by government borrowing.
“Monetary policy does not affect government spending.”
—Elliot, AP Student
The central bank develops monetary policy and is independent of Congress and the President. This independence of monetary policy is believed to be a critical balance to fiscal policy that can be heavily politicized. After all, the creators of fiscal policy are elected by their constituents and might let an upcoming election taint the policy-making process. The central bank, free of election pressures, can develop monetary policy without this conflict of interest and perhaps work to counterbalance the downsides to fiscal policy. Let’s look at three different scenarios where monetary and fiscal policy might be coordinated in Table 11.2 .
Table 11.2
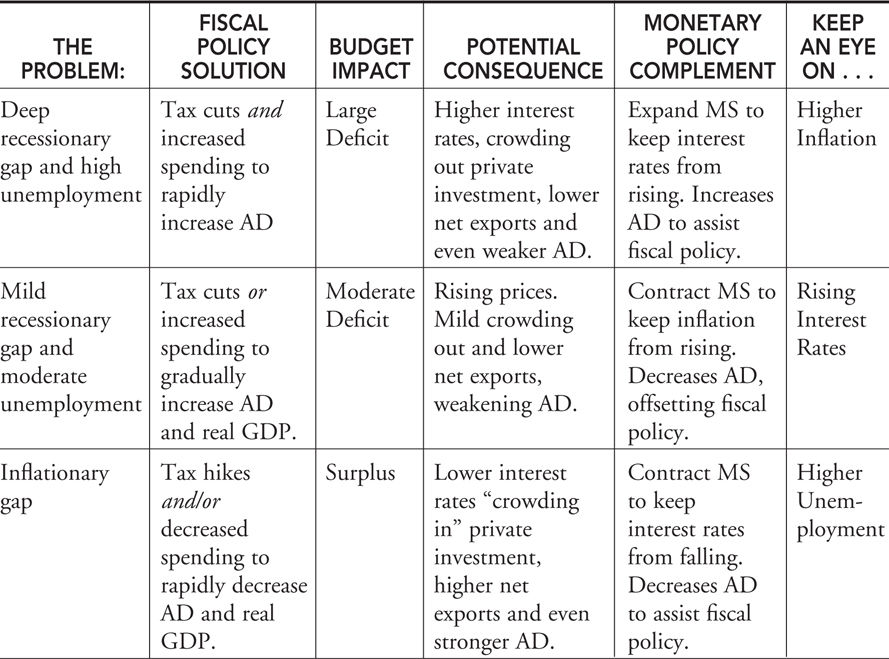
• In a deep recessionary gap, expansionary monetary policy could be used to assist expansionary fiscal policy to quickly move to full employment. The risk then becomes a burst of inflation.
• In a mild recessionary gap, contractionary monetary policy could be used to offset expansionary fiscal policy to gradually move to full employment. The risk then becomes rising interest rates.
• In an inflationary gap, contractionary monetary policy could be used to assist contractionary fiscal policy to put downward pressure on the price level. The risk then becomes a rising unemployment rate.
Are There Critics of Monetary Policy?
Some economists disagree with the effectiveness of monetary policy, particularly the expansionary policies that are designed to eliminate a recessionary gap. One group of economists, which has come to be known as the “monetarists,” argues against active open market purchases of Treasury securities on the grounds that such expansions of the money supply will not create more economic growth in the long run and will only create inflation. How would this happen?
Figure 11.9 shows an economy with a mild recessionary gap as real GDP (Q r ) falls below full employment output (Q f ). Suppose the central bank takes aggressive action and buys Treasury securities to expand the money supply. With a lower interest rate in the money market, aggregate demand increases to AD2 , increasing real GDP beyond full employment. While the unemployment rate falls in the short run, the aggregate price level rises to PL2 and inflation becomes a concern. As the economy, now with more money in circulation, adjusts to higher levels of spending, nominal wages and other factor prices rise, shifting the SRAS curve to the left to SRAS2 . When the economy fully adjusts, it is back at full employment, but the aggregate price level has now greatly risen to PL3 . Early monetarists such as Milton Friedman would therefore argue that such activist monetary policy doesn’t “fix” the recession, it only creates inflation in the long run. The monetarists believe that the role of the central bank should be price stability, and the best way to accomplish this goal is to gradually and methodically increase the money supply by a fixed percentage each year.
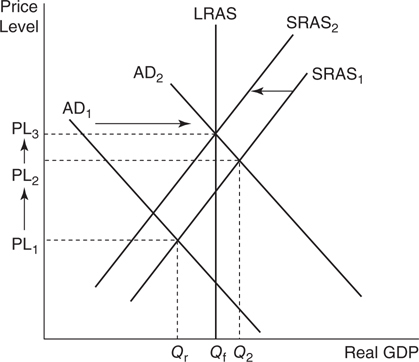
Figure 11.9
Another way to see the monetarist view of monetary policy is to examine the equation of exchange, the topic we turn to next.
Quantity Theory of Money
Fiscal policy directly puts money into, or takes money out of, the pockets of households and firms, but monetary policy depends upon several cause-and-effect relationships. The critical link between monetary policy and real GDP is the relationship between changes in money supply, the real interest rate, and the level of private investment. After all, if the money supply increases and there is no increase in investment, expansionary monetary policy would have no effect on real GDP. As already noted, monetarists have become proponents of the quantity theory of money , which postulates that increasing the money supply has no effect on real GDP, but only serves to increase the price level.
One way to view this theory is to use the equation of exchange . The equation says that nominal GDP (P × Q ) is equal to the quantity of money (M ) multiplied by the number of times each dollar is spent in a year (V ), the velocity of money . For example, if in a given year the money supply is $100 and nominal GDP is $1,000, then each dollar must be spent 10 times; V = 10.
MV = PQ , or V = PQ /M
If the money supply (M ) increases, this increase must be reflected in the other three variables. To accommodate an increase in money supply, the velocity of money must fall, the price level must rise, or the economy’s output of goods and services must increase.
Historically, the velocity of money in the United States has been fairly constant and stable, so the increase in M must result in changes in either P or Q . Economists believe that the quantity of output produced in a given year is a function of technology and the supply of resources, rather than the quantity of money circulating in the economy. Therefore, the increased money supply is going to only create a higher price level—inflation.
• The quantity theory of money predicts that any increase in the money supply only causes an increase in the price level.
![]() Review Questions
Review Questions
1 . Which function of money best defines $1.25 as the price of a 20-ounce bottle of pop?
(A) Medium of exchange
(B) Unit of account
(C) Store of value
(D) Transfer of ownership
(E) Fiat money
2 . If a bank has $500 in checking deposits and the bank is required to reserve $50, what is the reserve ratio? How much does the bank have in excess reserves?
(A) 10 percent, $450 in excess reserves
(B) 90 percent, $50 in excess reserves
(C) 90 percent, $450 in excess reserves
(D) 10 percent, $50 in excess reserves
(E) 10 percent, $500 in excess reserves
3 . Which is not a way that the Fed can affect the money supply?
(A) A change in discount rate
(B) An open market operation
(C) A change in reserve ratio
(D) A change in tax rates
(E) Buying Treasury securities from commercial banks
4 . If the money supply increases, what happens in the money market (assuming money demand is downward sloping)?
(A) The nominal interest rates rises.
(B) The nominal interest rates falls.
(C) The nominal interest rate does not change.
(D) Transaction demand for money falls.
(E) Transaction demand for money rises.
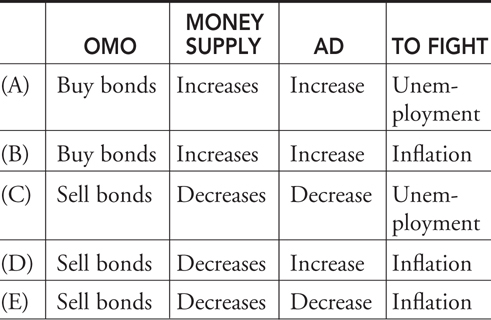
5 . To move the economy closer to full employment, the central bank decides that the federal funds rate must be increased. The appropriate open market operation is to ______, which ______ the money supply, ______ aggregate demand, and fights ______.
6 . Which of the following is a predictable advantage of expansionary monetary policy in a recession?
(A) Decreases aggregate demand so that the price level falls.
(B) Increases aggregate demand, which increases real GDP and increases employment.
(C) Increases unemployment, but low prices negate this effect.
(D) It keeps interest rates high, which attracts foreign investment.
(E) It boosts the value of the dollar in foreign currency markets.
![]() Answers and Explanations
Answers and Explanations
1 . B —The price in this case measures the relative price (value) of the pop.
2 . A —The reserve ratio = Required reserves/checking deposits = .1 = 10%. Excess reserves = (Checking deposits – Required reserves) = ($500 – $50) = $450.
3 . D —The Fed has no control of tax rates, which are an example of fiscal policy. All of the other choices are tools of monetary policy.
4 . B —If the demand for money is downward sloping, the nominal interest rate falls because the money supply curve has shifted rightward.
5 . E —If the central bank has decided that moving to full employment requires an increase in the federal funds rate, it must sell bonds to decrease the money supply. The resulting increase in interest rates decreases AD and puts downward pressure on the price level.
6 . B —Expansionary monetary policies decrease the interest rate, causing AD to increase, which increases GDP at equilibrium and increases employment.
![]() Rapid Review
Rapid Review
Stock: A certificate that represents a claim to, or share of, the ownership of a firm.
Equity financing: The firm’s method of raising funds for investment by issuing shares of stock to the public.
Bond: A certificate of indebtedness from the issuer to the bond holder.
Debt financing: A firm’s way of raising investment funds by issuing bonds to the public.
Fiat money: Paper and coin money used to make transactions because the government declares it to be legal tender. Because it has no intrinsic value, it is backed by the public’s trust that the government maintains its value.
Functions of money: Money serves three functions. It serves as a medium of exchange, a unit of account, and a store of value.
Present value: If r is the current interest rate, the present value of $1 received one year from now is $1/(1 + r).
Future value: If r is the current interest rate, the future value of $1 invested today for a period of one year is $1 × (1 + r).
Money supply: The quantity of money in circulation as measured by the Federal Reserve (the Fed) as M 1 and M 2. Assumed to be fixed at a given point in time.
M 1: The most liquid of money definitions and the basis for all other more broadly defined measures of money. M 1 = Cash + Coins + Checking deposits + Traveler’s checks.
Liquidity: A measure of how easily an asset can be converted to cash. The more easily it can be converted to cash, the more liquid the asset.
Transaction demand: The amount of money held in order to make transactions. This is not related to the interest rate, but it increases as nominal GDP increases.
Asset demand: The amount of money demanded as an asset. As nominal interest rates rise, the opportunity cost of holding money begins to rise and you are more likely to lessen your asset demand for money.
Money demand: The demand for money is the sum of money demanded for transactions and money demanded as an asset. It is inversely related to the nominal interest rate.
Theory of liquidity preference: Keynes’ theory that the interest rate adjusts to bring the money market into equilibrium.
Fractional reserve banking: A system in which only a fraction of the total money deposited in banks is held in reserve as currency.
Reserve ratio (rr ): The fraction of a bank’s total deposits that are kept on reserve.
Reserve requirement: Regulation set by the Fed that states the minimum reserve ratio for banks.
Excess reserves: The cash reserves held by banks above and beyond the minimum reserve requirement.
Balance sheet or T-account: A tabular way to show the assets and liabilities of a bank. Total assets must equal liabilities.
Asset of a bank: Anything owned by the bank or owed to the bank is an asset of the bank. Cash on reserve is an asset and so are loans made to citizens.
Liability of a bank: Anything owned by depositors or lenders is a liability to the bank. Checking deposits of citizens or loans made to the bank are liabilities to the bank.
Money multiplier: This measures the maximum amount of new checking deposits that can be created by a single dollar of excess reserves. M = 1/(reserve ratio) = 1/rr . The money multiplier is smaller if (a) at any stage the banks keep more than the required dollars in reserve, (b) at any stage borrowers do not redeposit funds into the bank and keep some as cash, and (c) customers are not willing to borrow.
Expansionary monetary policy: Designed to fix a recession and increase aggregate demand, lower the unemployment rate, and increase real GDP, which may increase the price level.
Contractionary monetary policy: Designed to avoid inflation by decreasing aggregate demand, which lowers the price level and decreases real GDP back to full employment.
Open Market Operations (OMOs): A tool of monetary policy, it involves the Fed’s buying (or selling) of securities from (or to) commercial banks and the general public.
Federal funds rate: The interest rate paid on short-term loans made from one bank to another. When this rate is a target for an OMO, bonds are bought or sold accordingly until the interest rate target has been met.
Discount rate: The interest rate commercial banks pay on short-term loans from the Fed.
Quantity Theory of Money: A theory that asserts that the quantity of money determines the price level and that the growth rate of money determines the rate of inflation.
Equation of Exchange: The equation says that nominal GDP (P × Q ) is equal to the quantity of money (M ) multiplied by the number of times each dollar is spent in a year (V ). MV = PQ .
Velocity of money: The average number of times that a dollar is spent in a year. V is defined as PQ /M .