5 Steps to a 5: AP Microeconomics 2017 (2016)
STEP 4
Review the Knowledge You Need to Score High
CHAPTER 11
Public Goods, Externalities, and the Role of Government
IN THIS CHAPTER
Summary: One of the recurring themes of the first half of this book is that the competitive marketplace provides the most efficient societal outcome where goods are produced at the point where MB = MC, or at the intersection of market supply and market demand. We have not, however, explored the possibility that the demand curve might not capture all of the benefits to society from the consumption of a good. There is also the possibility that the supply curve might not capture all of the costs to society from the production of the good. If these benefits and/or costs are indeed not reflected in the market equilibrium price and quantity, then we conclude that the market has failed to provide the efficient outcome. When this occurs, the government usually needs to step in.

Key Ideas
![]() Public and Private Goods
Public and Private Goods
![]() Positive and Negative Externalities
Positive and Negative Externalities
![]() Income Distribution
Income Distribution
![]() Tax Structures
Tax Structures
11.1 Public Goods and Spillover Benefits
Main Topics: Private and Public Goods, Spillover Benefits and Positive Externalities
Private and Public Goods
So far, when discussing goods and services, we have focused on private goods and services. Private goods are goods that are both rival and excludable. A bag of potato chips and a cup of herbal tea are all private goods. These are rival in that only one person can consume the good, and so consumption by one consumer necessarily means another cannot. Private goods are excludable in that consumers who do not pay for the good are excluded from the consumption.
Public goods , however, are special cases where the goods are both nonrival and nonexcludable. These characteristics mean that one person’s consumption does not prevent another from also consuming the good. If a public good is provided to some, it is necessarily provided to all, even if they do not pay for the good. Common examples of public goods are national defense, local fire and police services, space exploration, and environmental protection.
Who Pays?
In the case of private goods, each individual decides whether he or she is going to pay the going price. If the marginal benefit to me is at least as high as the price, I might decide to purchase and consume the good. For private goods, those who want the good badly enough are the ones who pay.
Maybe you have confronted the difficulty in paying for a public good if you have been assigned a group project in school. If each group member receives the same grade, regardless of his or her level of effort, some members of the group might slack off and benefit from the hard work of the others. If this sounds familiar, you have experienced the free-rider problem. The free-rider problem pops up whenever some members of the community understand that they can consume the public good while others provide for it.
A small town has a community meeting to decide how to pay for local police protection. The mayor passes a collection plate around the room, and we each make a voluntary donation toward this public good. There are some difficulties with paying for a public good in this way. How much do I use or value the next unit of police services in my protection? Is this more than, less than, or the same as my neighbor’s use and value of police protection? It is impossible to answer this question, and even if it were possible to determine how much my neighbor values police service, maybe he won’t pay his fair share. After all, if police protection is going to be provided to the entire community, and this protection cannot be denied to anyone, some members of the community might become free riders . The free-rider problem and the nonexcludable nature of public goods require that the government collect taxes to pay for their provision.
Spillover Benefits and Positive Externalities
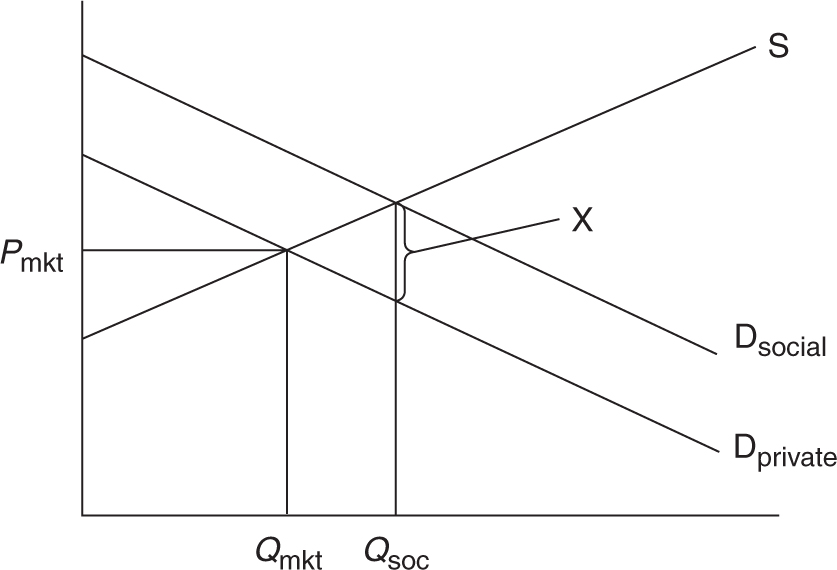
In graduate school I rented a small house on a dead-end street. On the other side of the street, two older ladies had an immaculately landscaped yard with gorgeous rosebushes. Riding my mountain bike home from campus, I was happy to see, and smell, the results of their hard yard work. I’m sure that I was not the only neighbor who felt that way. When one person’s consumption of a good provides utility to a third party who has not directly purchased the good, there exist spillover benefits that are not reflected in the market price of that good. In my case, my neighbors went to the trouble, expense, and effort to beautify their yard. In the process, they beautified the neighborhood and provided benefits to those of us who received utility from the landscaping and the roses. This situation is described as a positive externality and is illustrated in Figure 11.1 .
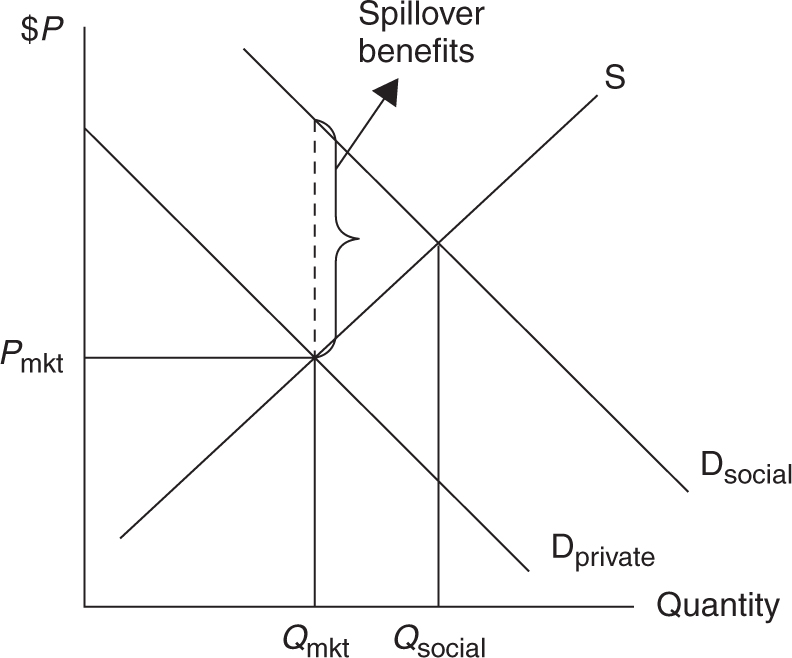
Figure 11.1
The market demand curve for roses (often labeled MPB for marginal private benefits) captured the private benefits received by consumers of roses but did not capture the additional benefits received by neighbors of those who consumed roses. Figure 11.1 incorporates the spillover benefits to the market for roses. The private demand curve, which does not include the spillover benefits, lies below the societal demand curve (often labeled MSB for marginal social benefits). The market produces only Q mkt roses, but the optimal amount is greater at Q social . Because the market produces less than the socially optimal amount, it is said that there is an underallocation of resources to rose production. In other words, society wants more than the market provides.

• The existence of spillover benefits in a market results in an underallocation of resources in that market. In other words, there is not enough of a good thing.
• In the presence of a positive externality, at Q mkt , the MSB is greater than MPB due to spillover benefits.
• Because the market ignores the spillover benefits, deadweight loss exists and is seen as the area between MSB and MPB and between Q social and Q mkt .
The ladies who lived across the street from my house were essentially providing a public good that we might call “community beautification,” and the rest of us were free riding on their activity. How could we have contributed to the provision of the public good? Maybe we could have brought these ladies cash donations, or we could have volunteered our labor. Each of these gestures would have lessened their burden and freed up their private resources to provide even more landscaping for the neighborhood.
Subsidies
On a larger scale, this type of market failure can be remedied through government intervention. Our goal as economic policy makers is to move the equilibrium quantity from Q mkt to Q social . One solution might be to provide a subsidy to gardeners equal to the amount of the spillover benefit that their activity provides to the community. By sending a check (or voucher) to the ladies, they would have increased their demand for roses and other landscaping and shifted the private demand out to equal the social demand. This is seen in Figure 11.2 . The price received by the firm has risen to P firm , but when the consumer applies the voucher, the actual price to the consumer is lower at Pcons .
Another possibility is to provide a subsidy to producers of roses. This type of subsidy would result in an outward shift in the supply curve so that the equilibrium quantity of roses would be at Q social . This policy is seen in Figure 11.3 . The price to consumers, P cons , is also lower in this case, while producers receive, with the subsidy, P firm .
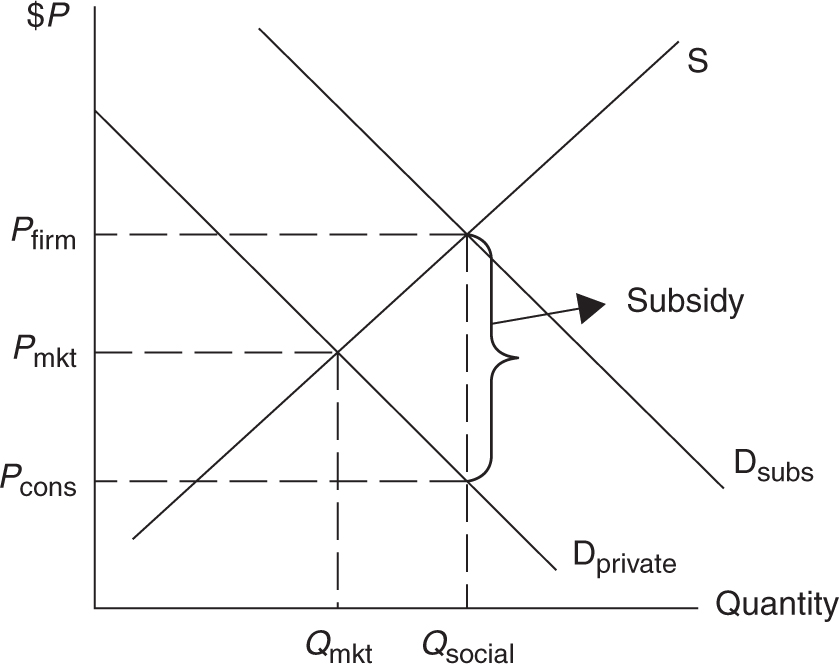
Figure 11.2
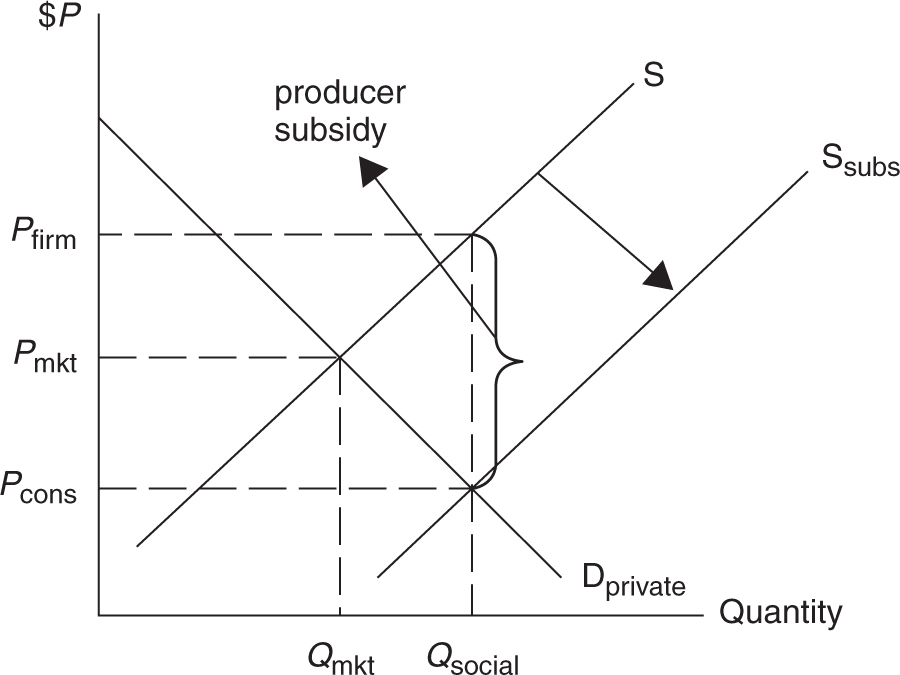
Figure 11.3
11.2 Pollution and Spillover Costs
Main Topics: Spillover Costs and Negative Externalities
Another kind of market failure occurs when there are additional costs associated with production of a good that are not reflected in the market price. Pollution of all kinds is a classic example.
Spillover Costs and Negative Externalities
Almost anyone who has walked down a busy street has experienced secondhand smoke.
Even a nonsmoker, having spent just a minute walking next to a smoker, can smell smoke on his or her clothes. While the smoker has chosen to pay the market price of tobacco, the nonsmoker also pays a price for that choice, either in minor disutility or worsened health. When one person’s consumption of a good imposes disutility on a third party who has not directly purchased the good, there exist spillover costs that are not reflected in the market price of that good. A situation in which polluters impose costs upon third parties is called a negative externality .
The existence of spillover costs from a negative externality means that not all of the costs of production are captured by the supply curve. In the Midwest, the burning of coal produces most electricity. The private cost of electricity production includes the coal, the labor, and capital at the plant. But the burning of coal imposes environmental costs in the form of air, water, and land pollution. These costs actually make people, not to mention the planet, sick! These societal costs are not found in the market price (P mkt ) of charging your cellphone or running the dishwasher. The difference between the private cost and the societal cost of producing electricity is seen in Figure 11.4 . The private supply curve (also labeled MPC for marginal private cost), which does not include the spillover costs, lies below the societal supply curve (also labeled MSC for marginal social cost). The market produces Q mkt units of electricity, but the optimal amount is less at Q social . Because the market produces more than the socially optimal amount, it is said that there is an overallocation of resources to electricity production. In other words, society wants less than the market provides.
• The existence of spillover costs in a market results in an overallocation of resources in that market. In other words, there is too much of a bad thing.
• In the presence of a negative externality, at Q mkt , the MSC is greater than MPC due to spillover costs.
• Because the market ignores the spillover costs, deadweight loss exists and is seen as the area between MSC and MPC and between Q social and Q mkt .
“I was always told to make big graphs to keep things clear. It ended up saving me from many careless errors.”
—Ross, AP Student
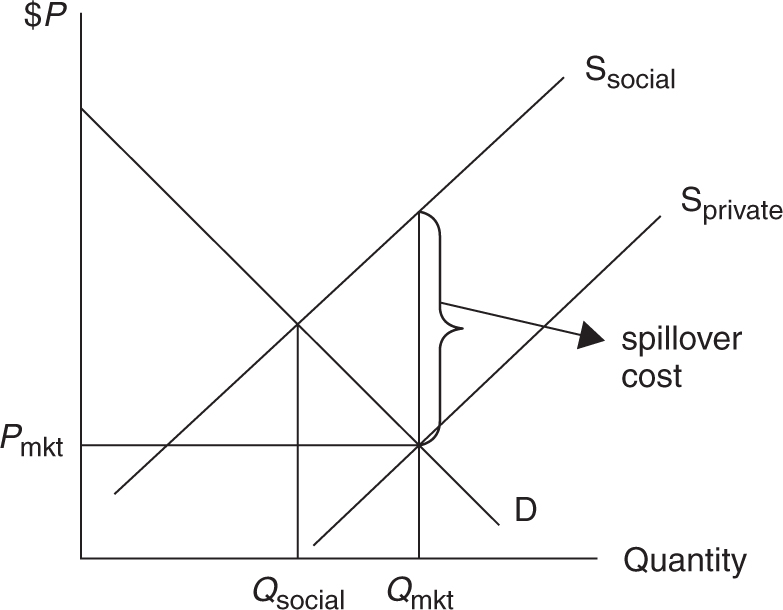
Figure 11.4
So how could cigarette smokers alleviate the discomfort that they impose upon their nonsmoking citizens? The aim of any such policy is to try to move the spillover costs away from the third-party victims and back upon those who produce the externality.
Pollution Taxes
Rather than allow the spillover costs to fall externally on members of society, the goal of pollution taxes is to internalize these costs by imposing a tax on the production or consumption of goods that create negative externalities. Our goal is to move the market equilibrium quantity closer to the socially optimal quantity of electricity. Suppose government imposes a tax, equal to the spillover cost, on every unit of coal that our power plant uses to produce electricity. This pollution tax results in an inward shift of the private supply curve so that it equals the social supply curve. See Figure 11.5 . The price of running the dishwasher has increased, but now that price incorporates all of the costs of electricity, including the effects of pollution on the environment and human health.
In some cases, a tax may be imposed on consumers, if they are responsible for the negative externality. For example, in major metropolitan areas, traffic is a serious problem and millions of commuters create significant amounts of pollution. We might increase the automobile registration tax or create a system of toll highways so that the users of automobiles and the commuters themselves must pay an additional price for that behavior. We have seen that any time the price increases, quantity demanded (driving) must fall.
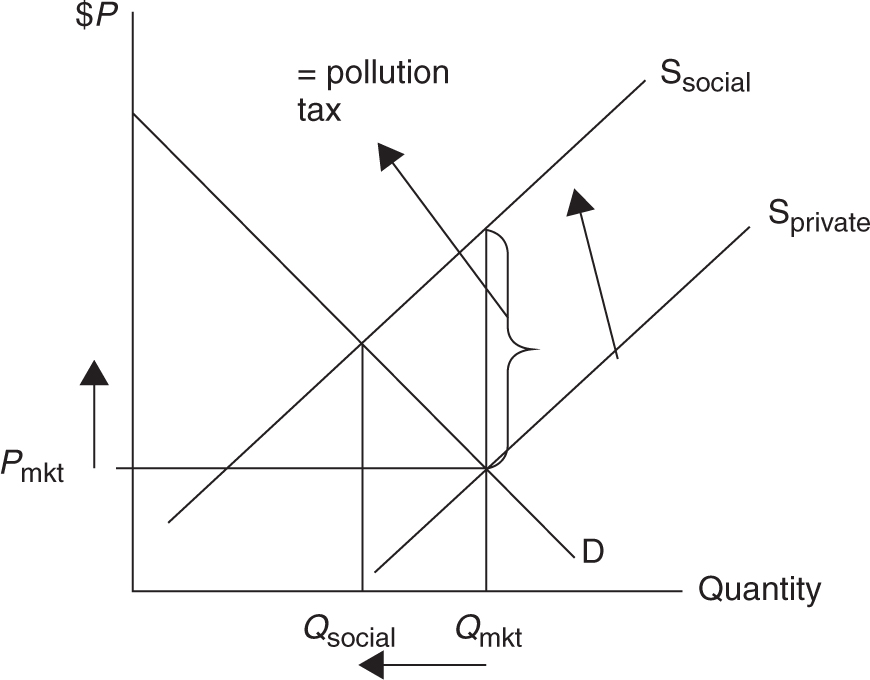
Figure 11.5
Be careful when designing a tax to remedy a negative externality. We must tax those who are imposing the spillover costs on society. Would you tax the nonsmoker to fix the problem of secondhand smoke? Hardly.
11.3 Income Distribution and Tax Structures
Main Topics: Equity as a Goal; Marginal and Average Tax Rates; Progressive, Regressive, and Proportional Taxes
In the case of pollution and other negative externalities, the marketplace fails to protect the victims of spillover costs. In the case of public goods or other positive externalities, the market fails to provide an adequate quantity to satisfy the needs of society. As we saw previously, the government is called to action to move the market outcome closer to the societal efficient outcome. The government is also called to action to remedy issues of equity, or fairness. This section discusses equity, distribution of income, and tax structures to move closer to a more equitable outcome.
Equity as a Goal
While we tout the efficiency of competitive markets with a fervor that approaches deification, the one thing even the most efficient market does not do is provide equity, or fairness. Some consumers can afford a new Mercedes; some cannot. Yet I doubt that this is a good example of the unfairness of markets. But some consumers cannot afford pediatric services for their infant children. Even if these services are exchanged at the efficient quantity where the marginal social benefit is equal to the marginal social cost, even the most die-hard advocates of the free market can see that it is an outcome that should be remedied through some form of income redistribution.
An Equal Share?
There are some who propose that the economic resources should be equally divided amongst all members of society. This egalitarian, or equal-share, view seems fair but has at least one serious criticism. Egalitarianism suffers from an issue of compensation that fails to match productivity. In other words, the incentives to work hard, take risks, and seek a competitive advantage are greatly reduced. If you were guaranteed an equal share of the resources, how hard would you work?
Example:
All students in your class are assured of being compensated with a B, regardless of the effort and productivity that might merit a B. C-level students lack the motivation to become more productive because they are guaranteed compensation above their productivity. A-level students lack the motivation to produce A-level work because they know compensation falls below that. The high-productivity students get disenchanted and disgruntled, and work even less.
Productivity Share?
If egalitarianism suffers from a lack of productivity incentives, maybe everyone’s share of economic resources should be based upon individual productivity. In other words, this marginal productivity theory says your wage is a function of your marginal revenue product. If markets are competitive, this can be quite efficient. In theory, this could even be fair. The flaw in this method of income distribution is that not all citizens are given a fair shake at demonstrating to the labor market their true marginal revenue product. Think of all of the advantages, large or small, that you were lucky enough to be born with. Now imagine all of them being removed from your past and present. Productive individuals who have few advantages can overcome obstacles with hard work, but some societal barriers (e.g., discrimination, a disability) prevent them from ever receiving a compensation equal to their productivity.
How Do We Measure the Income Distribution?
There are a couple of common ways to see a nation’s income distribution. Whether or not we think this is “fair” is another question entirely.
1. Quintiles .
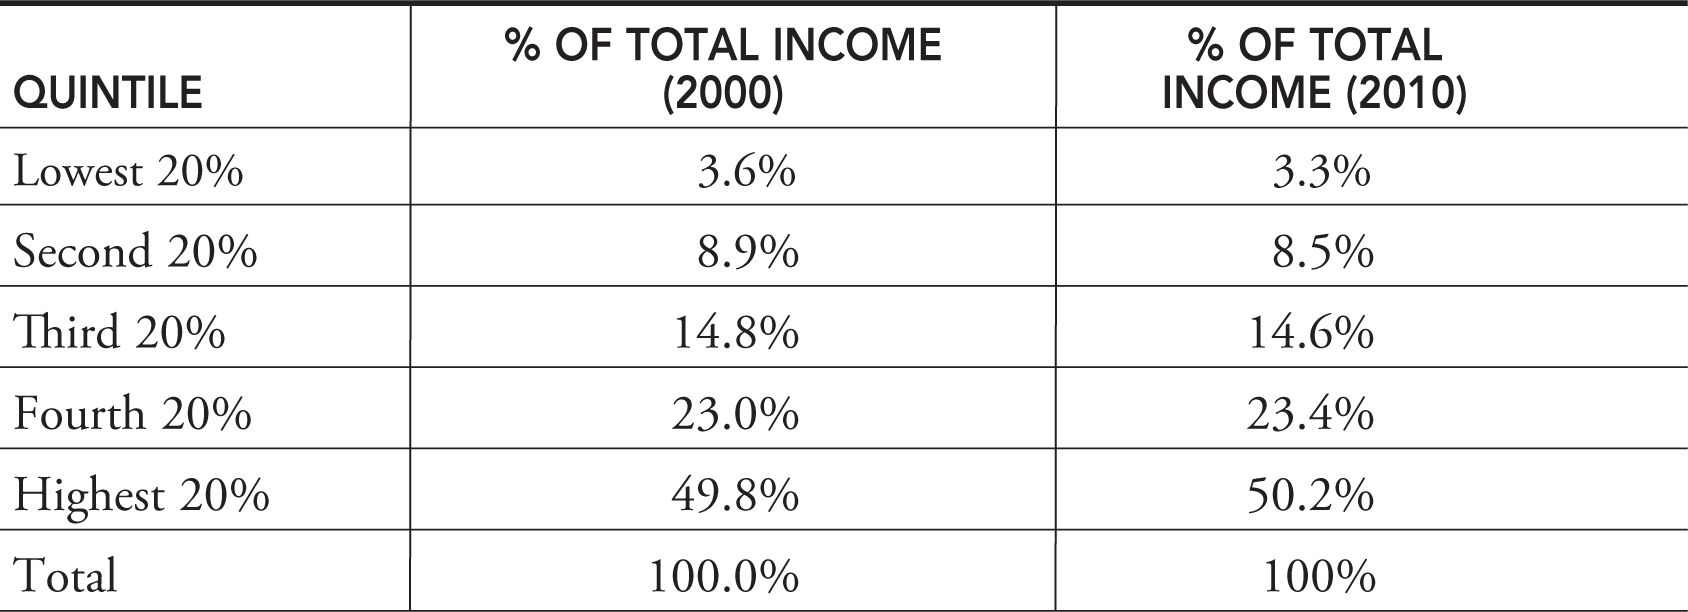
Economists sort households from the lowest incomes to the highest incomes and then divide that range into fifths, or quintiles . In each quintile lies 20 percent of all households. Table 11.1 illustrates the income distribution in 2000 and 2010 as published by the Census Bureau. If income were perfectly distributed, each 20 percent of the families in the United States would have 20 percent of the total income.
Table 11.1
2. Lorenz Curve and Gini Ratio .
The above quintile distribution can be graphically illustrated with a Lorenz curve (see Figure 11.6 ). The farther the Lorenz curve lies below the hypothetical line of perfect equality, the more unequal the distribution of income. This distance of the actual distribution of income from the line of perfect equality is calculated by constructing a Gini ratio , the area of the gap between the perfect equality line and the Lorenz curve (A) as a ratio of the entire area (A + B). The closer the Gini ratio is to zero, the more equal the distribution. The closer to one, the more unequal the income distribution.
Gini ratio = Area A/(Area A + Area B)
• The closer the Gini ratio gets to zero, the more equal the distribution of income.
• The closer the Gini ratio gets to one, the more unequal the distribution of income.
What Are the Sources of Inequality?
The market is not always a good mechanism for distributing income equally. There are some commonly accepted factors for income inequality:
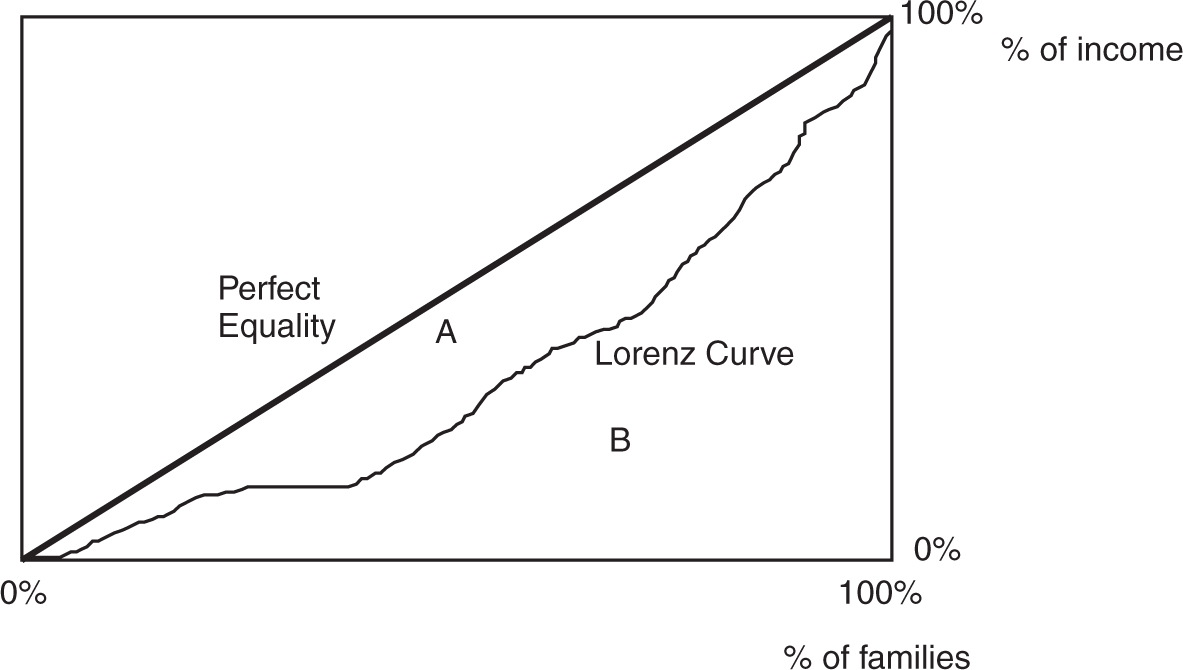
Figure 11.6
• Ability . Because natural ability is not distributed equally, income is not distributed equally. This factor would explain why some quarterbacks or artists are more highly paid than other quarterbacks or artists.
• Human capital . Individuals augment their ability with education and training, resulting in higher income. Not everyone attains the same level of human capital, so income is not equally distributed.
• Discrimination . Despite social progress, discrimination is a hurdle that might not be surmountable even with high levels of ability and human capital.
• Preferences . Some individuals, even with high ability and human capital, prefer to maximize utility with more leisure and less labor.
• Market power . We learned that monopoly and monopsony markets are detrimental to consumers and workers. The more market power held in the hands of the few, the more unequal the distribution of income.
• Luck and connections . Some are born into prosperity, and some are lucky enough to stumble upon the right connections.
Can Income Be Redistributed?
The economic system in the United States emphasizes a productivity-based distribution of resources, but we know that this system does not overcome all of the equity issues that are theoretically solved by egalitarianism. We have decided that the government should have a role in income distribution. The idea behind redistribution of income is that the government collects taxes from one segment of society and transfers it to another. These transfers come in the form of social programs like government housing, Medicare, or public education. And while most agree that these programs are essentially good, how government decides to tax is a hotly debated issue along philosophical and political grounds. We summarize the nature of progressive, regressive, and proportional taxes, and use the marginal and average concepts again in this new context.
Marginal and Average Tax Rates
Marginal tax rate is the rate paid on the last dollar earned. This is found by taking the ratio of the change in taxes divided by the change in income:
Marginal tax rate = (Δ taxes due)/(Δ taxable income)
Example:
If my income rises by $100 and the taxes that I owe the government rise by $25, the marginal tax rate is 25 percent on those additional $100.
Average tax rate is the proportion of total income paid to taxes. It is calculated by dividing the total taxes owed by the total taxable income:
Average tax rate = (Total taxes due)/(Total taxable income)
Example:
If my monthly taxable income is $1,000 and $200 is deducted for taxes, my average tax rate is 20 percent.
Progressive, Regressive, and Proportional Taxes
The way in which a redistributive tax works depends upon how the average tax rate changes as income changes.
A Progressive Tax
A progressive tax exists if as income increases, the average tax rates increase. The federal income tax works this way. If your household income is above a certain minimum level but below a certain maximum level (a tax bracket), you might pay an average of 20 percent of your income in taxes. If your household income rises above that upper limit and falls into a higher tax bracket, your average tax rate might increase to 24 percent. A tax bracket is a range of income on which is applied a given marginal tax rate. This structure is designed so that the lowest incomes pay taxes at a much lower rate than the highest incomes.
A Regressive Tax
A tax is regressive if the average tax rate falls as income rises. A sales tax on consumption is a good example of a regressive tax.
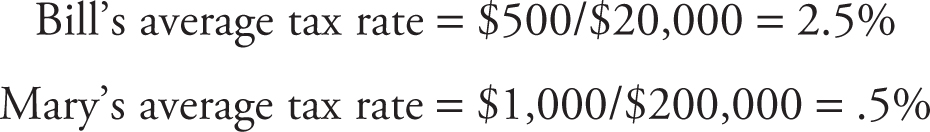
Example:
Two unmarried consumers with no children both shop at the grocery store in a state with a 5 percent sales tax. One consumer, Bill, earns a modest $20,000 and spends $10,000 annually on food at the store. He pays $500 in sales tax. A second consumer, Mary, earns $200,000, or 10 times as much as Bill. Can we expect her to spend 10 times as much on food? Doubtful. Let’s be generous and say that Mary spends $20,000 annually on food at the grocery store and pays $1,000 in sales tax. Everyone in the state pays 5 percent sales tax on his or her consumption spending, but as a percentage of income, Bill pays a much higher average tax rate.
A Proportional Tax
A proportional tax exists if a constant tax rate is applied regardless of income. Many politicians, on the grounds of a more streamlined way of taxing the population, have proposed this kind of “flat tax.” Corporate taxes are taxed at a flat rate of approximately 35 percent and are one of few examples of a proportional tax in the United States. Some U.S. states have adopted a proportional income tax rather than the more traditional progressive tax on income.
Example:
Melanie and Max earn $30,000 and $60,000, respectively. A proportional tax of 10% would require that Melanie pays $300 and Max pays $600 in taxes.
![]() Review Questions
Review Questions
1 . In the figure below, X represents
(A) spillover benefits.
(B) a potential producer subsidy to eliminate an externality.
(C) a potential consumer subsidy to eliminate an externality.
(D) both A and C.
(E) A, B, and C.
2 . Which of the following scenarios best describes a negative externality?
(A) A roommate has an extensive music library, and you share the same taste in music.
(B) Your neighbor has a swimming pool, and you have an open invitation to come on over for a pool party.
(C) Your neighbor has a swimming pool, and her six-year-old child has his first-grade friends over every day for a pool party.
(D) Your roommate’s mom has decided that your apartment needs cable and pays for it.
(E) Your dad has purchased a new sports coupe and has agreed that you can drive it to the prom.
3 . Which of the following is the best example of a public good?
(A) A lighthouse on a rocky coastline
(B) Tickets to the Super Bowl
(C) A granola bar
(D) A cup of coffee
(E) A magazine subscription
4 . Production of energy (i.e., electricity, natural gas, heating oil) creates a negative externality in the form of air pollution blown to communities downwind from the source of the pollution. Of the choices below, which is the most appropriate policy to remedy this negative externality?
(A) a per unit tax on consumers of subway tickets and city bus passes
(B) a per unit tax on producers of energy
(C) a per unit subsidy for energy consumers
(D) a per unit tax on consumers of energy efficient lightbulbs
(E) a per unit subsidy for energy producers
5 . Jason earns $1,000 a week and pays a total of $200 in taxes. Jennifer earns $2,000 a week and pays a total of $300 in taxes. We can conclude from this information that their income is taxed with a(n)
(A) progressive tax
(B) proportional tax
(C) regressive tax
(D) tax bracket
(E) egalitarian tax
6 . You learn that one nation has a Gini ratio of .25 and another nation has a Gini ratio of .85. Based on this you might conclude
(A) the nation with the higher Gini ratio has a more equal distribution of wealth and income.
(B) the nation with the higher Gini ratio has a more unequal distribution of citizens with college degrees.
(C) the nation with the lower Gini ratio has more societal barriers like discrimination.
(D) the nation with the higher Gini ratio has fewer societal barriers like discrimination.
(E) the nation with the lower Gini ratio has more oligopolistic industries.
![]() Answers and Explanations
Answers and Explanations
1 . E —This vertical distance between society’s demand curve and the market demand curve represents spillover benefits, or additional benefits to society not captured by market demand. However, it could also be the amount of a producer or consumer subsidy if the government chose to eliminate the externality.
2 . C —A negative externality is a situation where a third party is harmed by the actions of consumers and/or producers. The first-grade pool party is the best candidate for such a situation, as all of the other choices are likely to benefit you, rather than impose cost upon you.
3 . A —A public good is a good that is nonrival and nonexcludable. In other words, if one person consumes it, all others can still consume it.
4 . B —The presence of the negative externality should rule out any choice that refers to a subsidy of either producers or consumers of energy. To reduce consumption and production, we must reduce the market quantity, not encourage more of it. Subsidies could be used to encourage more energy-efficient behavior, but choices A and D would actually inhibit this kind of action. The per unit tax on producers of the negative externality is the most appropriate choice, as the tax shifts the market supply inward, making it closer to the socially optimal supply of energy.
5 . C —Jennifer’s weekly income is twice Jason’s, yet she pays less than double his taxes. This is a regressive tax. A proportional tax would require Jennifer to pay $400, and a progressive tax would require that she pay more than $400 in weekly taxes.
6 . B —The distribution of human capital is a factor in determining the distribution of income and wealth. A nation that has a more unequal distribution of educational attainment would therefore likely have a more unequal distribution of income.
![]() Rapid Review
Rapid Review
Private goods: Goods that are both rival and excludable. Only one person can consume the good at a time, and consumers who do not pay for the good are excluded from the consumption. Examples include a tube of toothpaste or an airline ticket.
Public goods: Goods that are both nonrival and nonexcludable. One person’s consumption does not prevent another from also consuming the good, and if it is provided to some, it is necessarily provided to all, even if they do not pay for the good. Examples are local police services and national defense.
Free-rider problem: In the case of a public good, some members of the community know that they can consume the public good while others provide for it. This results in a lack of private funding for the good and requires that the government provide it.
Spillover benefits: Additional benefits to society, not captured by the market demand curve from the production of a good, result in a price that is too high and a market quantity that is too low. Resources are underallocated to the production of this good.
Positive externality: Exists when the production of a good creates utility (the spillover benefits) for third parties not directly involved in the consumption or production of the good.
Marginal private benefit curve (MPB): The MPB reflects the additional benefit received by actual consumers of a good; the market demand curve.
Marginal social benefit curve (MSB): The MSB reflects the additional benefit received by all members of society, including both those who actually consume the good and those who receive spillover benefits from that consumption; the socially optimal demand curve.
Spillover costs: Additional costs to society, not captured by the market supply curve from the production of a good, result in a price that is too low and market quantity that is too high. Resources are overallocated to the production of this good.
Negative externality: Exists when the production of a good imposes disutility (the spillover costs) upon third parties not directly involved in the consumption or production of the good.
Marginal private cost curve (MPC): The MPC reflects the additional cost incurred by actual producers of a good; the market supply curve.
Marginal social cost curve (MSC): The MSC reflects the additional cost incurred by all members of society, including those who actually produce the good and those who incur spillover costs from that production; the socially optimal supply curve.
Egalitarianism: The philosophy that all citizens should receive an equal share of the economic resources.
Marginal productivity theory: The philosophy that a citizen should receive a share of economic resources proportional to the marginal revenue product of his or her productivity.
Marginal tax rate: The rate paid on the last dollar earned. This is found by taking the ratio of the change in taxes divided by the change in income.
Average tax rate: The proportion of total income paid to taxes. It is calculated by dividing the total taxes owed by the total taxable income.
Progressive tax: The proportion of income paid in taxes rises as income rises. An example is the personal income tax.
Tax bracket: A range of income on which a given marginal tax rate is applied.
Regressive tax: The proportion of income paid in taxes decreases as income rises. An example is a sales tax.
Proportional tax: A constant proportion of income is paid in taxes no matter the level of income. An example is a “flat tax” or the corporate income tax.
Gini ratio: A measure of a nation’s income inequality. This measure uses a scale between zero and one. The closer it lies to zero, the more equal the distribution of income.