High School Algebra I Unlocked (2016)
Chapter 4. Equations and Inequalities
Lesson 4.4. Two-Variable Linear Equations
Up until now, we’ve only discussed equations with a single variable; for example, x = 2 or y + 3 = 2y. However, in algebra, you will encounter tons of questions that require you to manipulate and graph two-variable equations.
Graphing and the Coordinate Plane
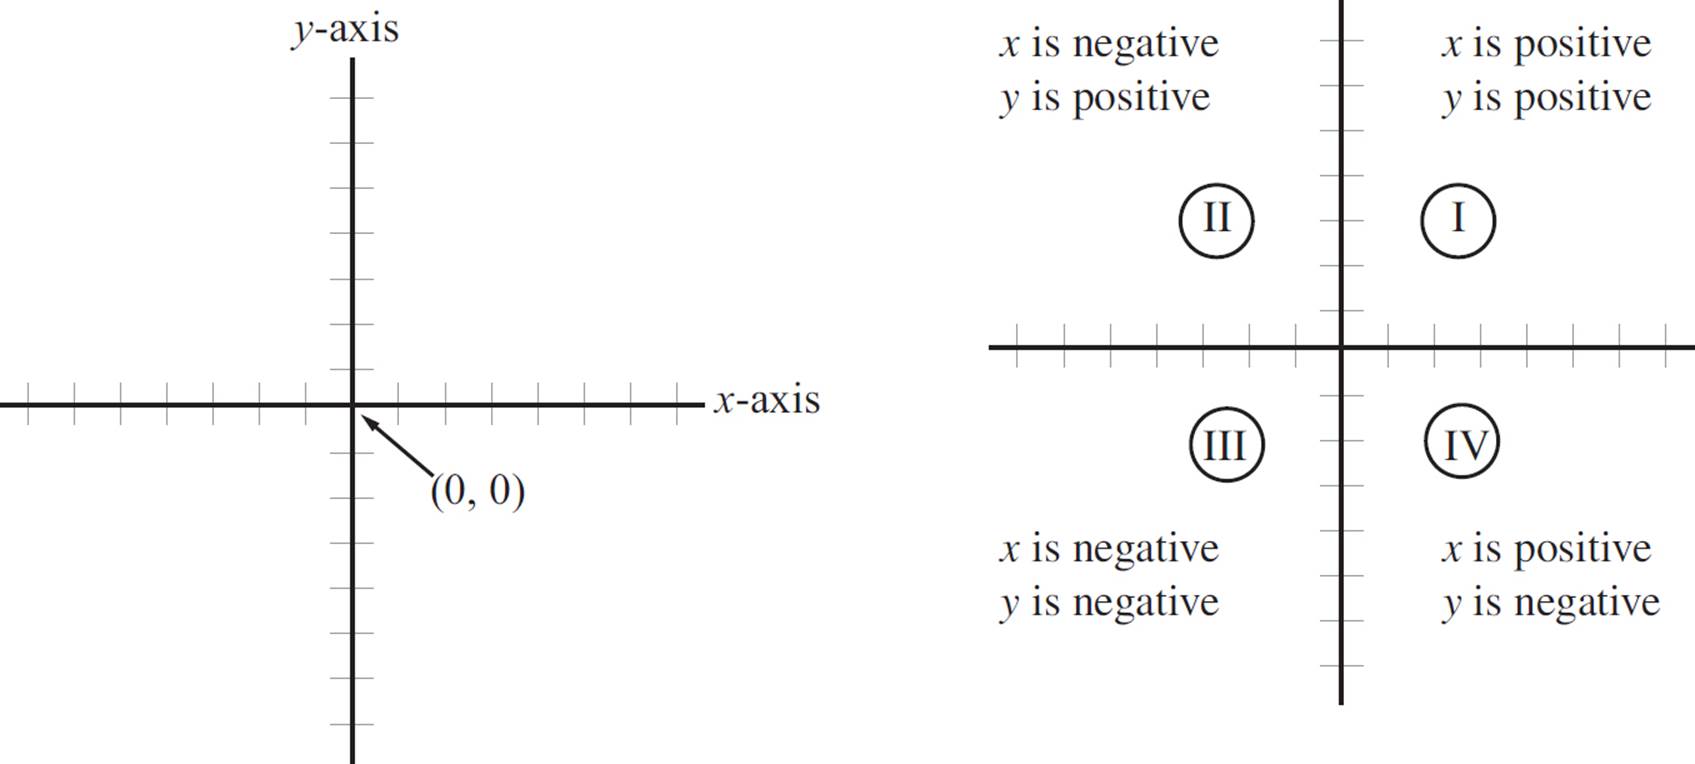
Graphing is a way of representing a point in two dimensions on what is known as a Cartesian grid or coordinate plane. Here’s the Cartesian grid:

Here is how you may see equivalent expressions on the ACT.
−x3 + 24x + 75 + 34x3 − 36x is equivalent to:
F. 99x
G. −35x3
H. 24x + 75
J. 33x3 − 12x + 75
K. 35x3 + 12x + 75
Graphing is a way of assigning points to this grid. Every point has two numbers assigned to it: an x-coordinate and a y-coordinate. Let’s take point A (3, 1) in the following graph. The first number is considered the x-coordinate, and the second number is the y-coordinate. To plot this point on the graph, we start at (0, 0), also referred to as the origin, and count over three to the right on the x-axis, and then count up one place parallel to the y-axis. To find point B (5, 4), we move five places to the right of the origin on the x-axis, and then up four places parallel to the y-axis.
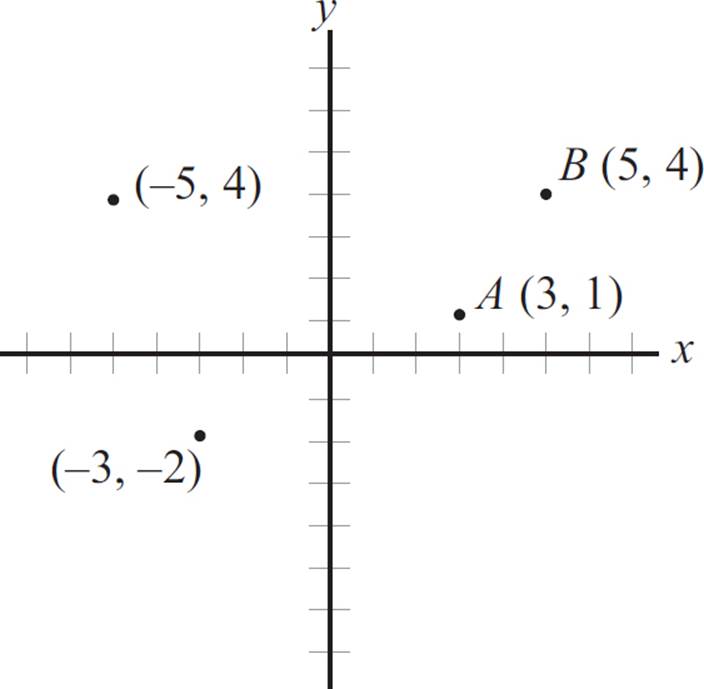
If the x-coordinate is negative, move to the left along the x-axis. If the y-coordinate is negative, then you move downward parallel to the y-axis. Look at the graph above to see how points (−5, 4) and (−3, −2) are plotted.
Slope-Intercept Form
In order to graph linear equations with ease, you need to be familiar with the slope-intercept form of a line:
y = mx + b
When an equation is in slope-intercept form, m represents the slope, or the measure of the steepness of a line, and b represents the y-intercept, or the y-coordinate of the point on the line that crosses the y-axis and has an x-coordinate of 0. To find the x-intercept, set y equal to zero and solve for x.
The slope-intercept form of a line is y = mx + b.
m = Slope b = y-intercept
The x-intercept is found by setting y = 0 and solving for x.
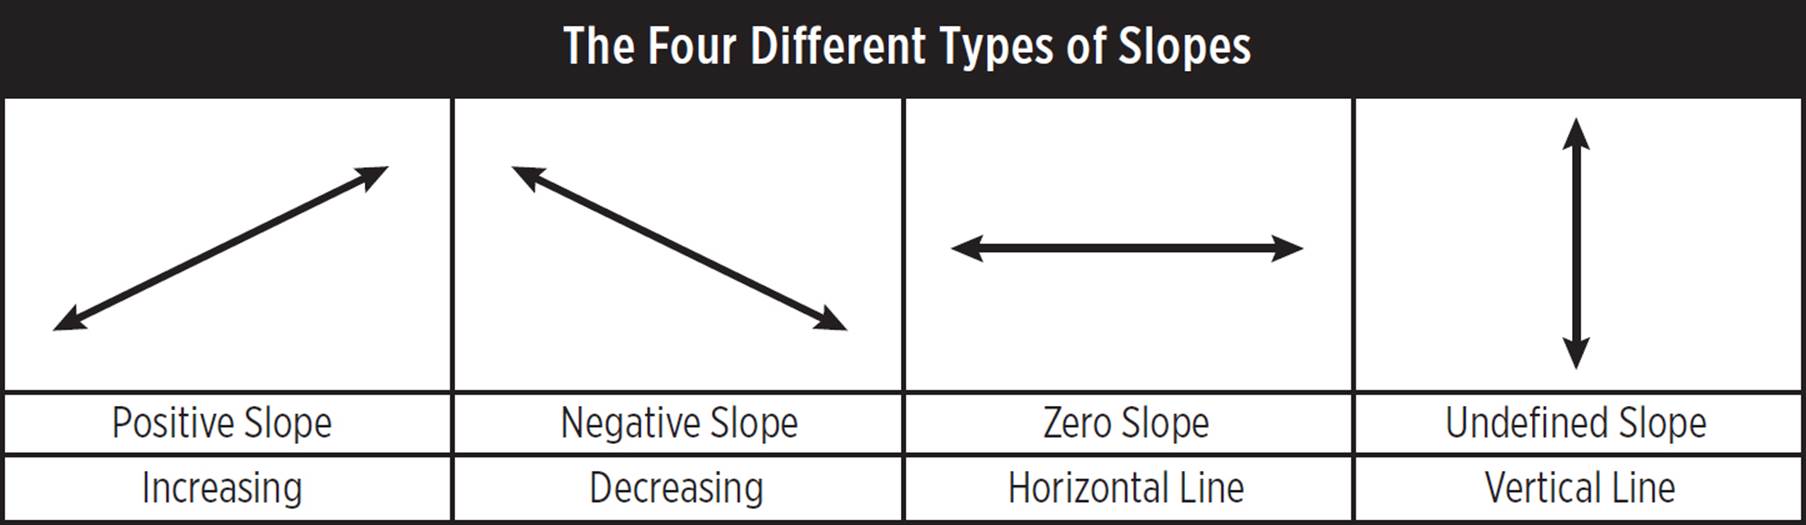
As shown in the chart below, the slope of a line can be increasing, decreasing, zero, or undefined, depending on the value of m.
Graphs of Single-Variable Linear Equations
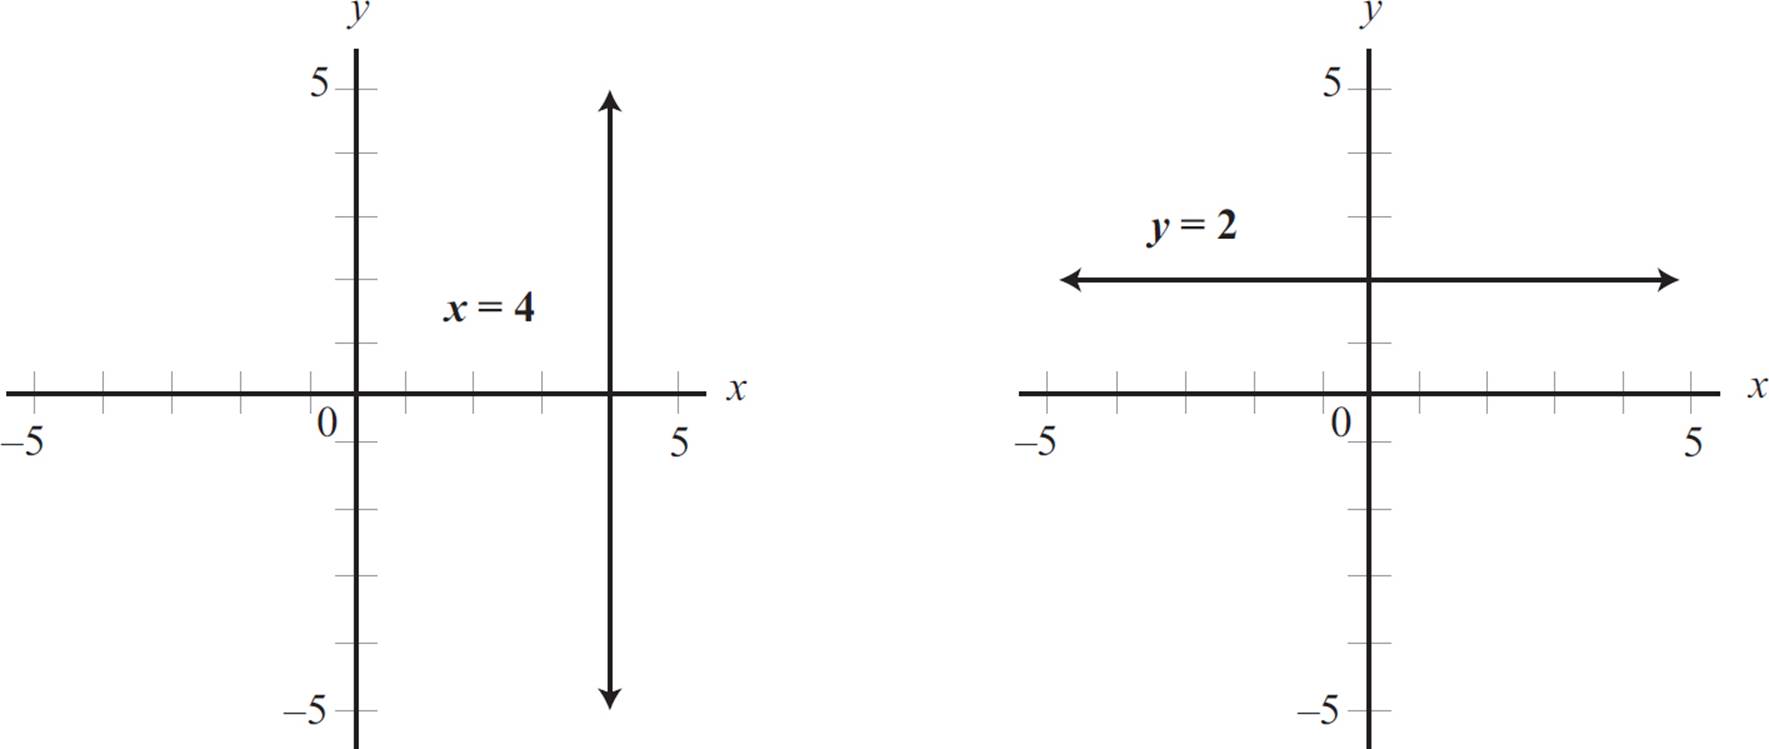
If you’re wondering why we didn’t cover graphs of single-variable linear equations, consider the equation x = 4. This equation indicates that x = 4 for all values of y and, therefore, is a straight vertical line. For all equations that are in the form of x = any number, the slope is undefined.
Conversely, the equation y = 2 indicates that y = 2 for all values of x and, in turn, is a straight horizontal line. For all equations that are in the form of y = any number, the slope is 0. On the next page, you can see the graphs of both x = 4 and y = 2.

Start by grouping similar terms. Here, you have −x3 + 34x3 = 33x3. You can eliminate (F), (G), and (H) because they do not have the term 33x3 in their expressions. Next, you have 24x − 36x = −12x. The only answer choice that has the term −12x is (J).
Alternatively, you could plug in a value for x, find the value of −x3 + 24x + 75 + 34x3 −36x. Since there are exponents, pick a small number, like 2. When you set x = 2, the equation −x3 + 24x + 75 + 34x3 − 36x becomes −23 + 24(2) + 75 + 34(2)3 − 36(2). This simplifies to −8 + 48 + 75 + 272 − 72 = 315. Now, plug x = 2 into the answer choices, looking for the value of 315. Only (J), 33(2)3 − 12(2) + 75 = 264 − 24 + 75 = 315, provides that value.
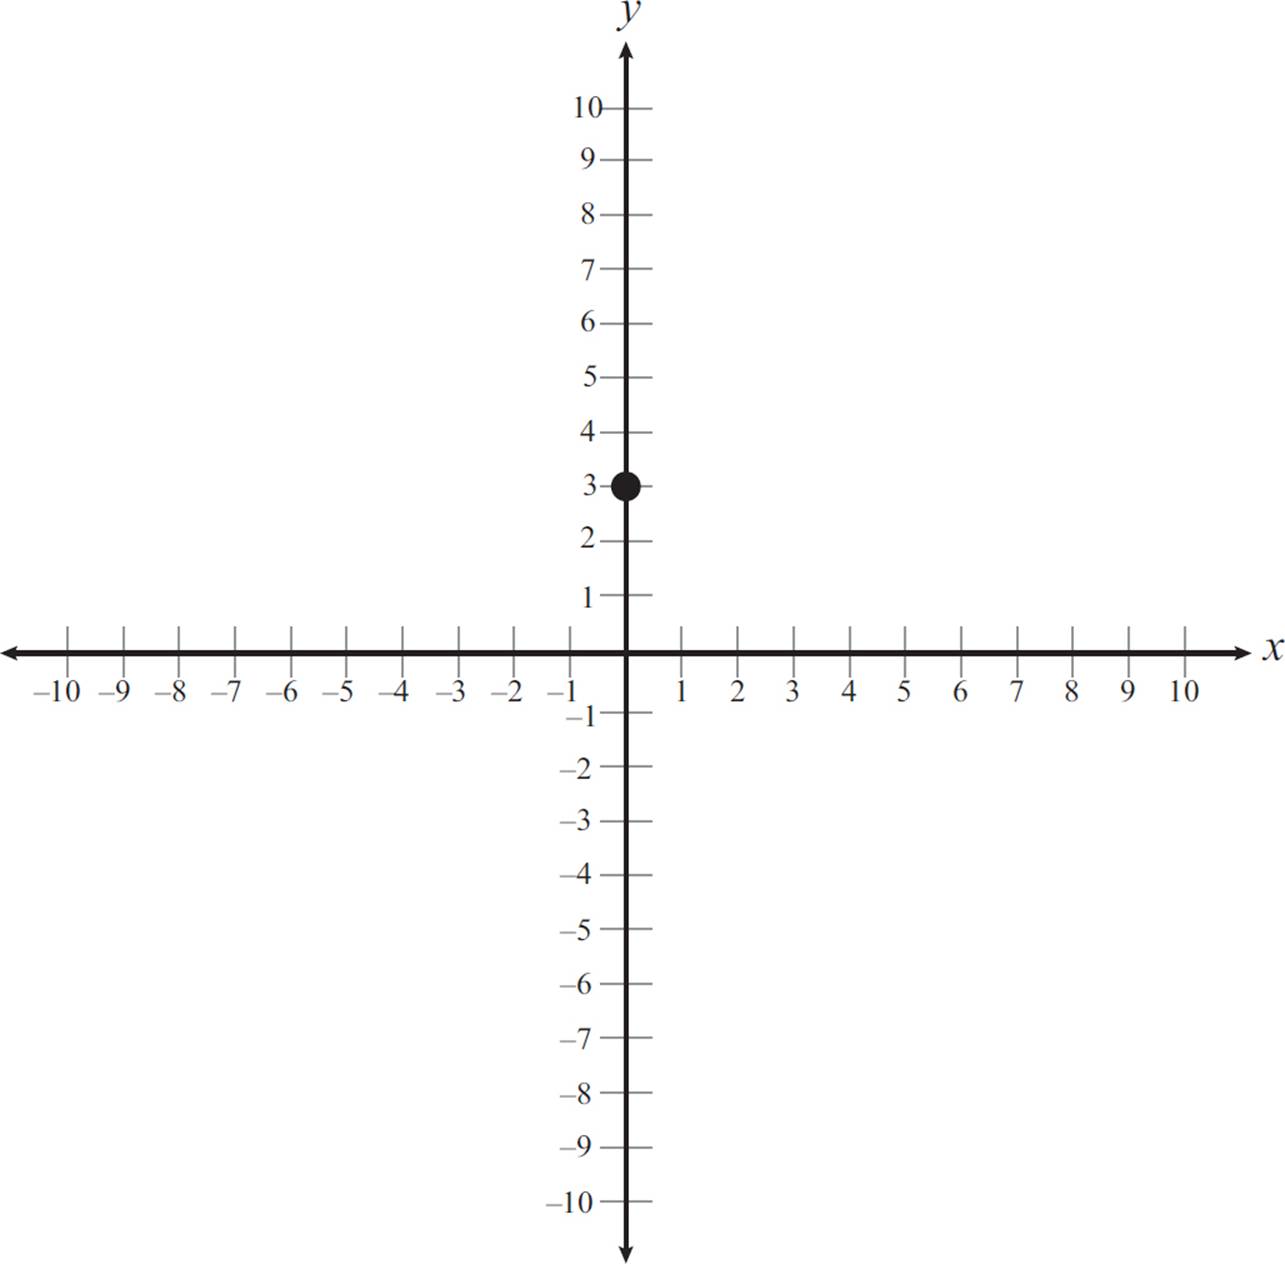
Consider the equation y = 2x + 3. Start out by identifying the y-intercept, which is 3. Since the y-intercept is 3, the graph includes the point (0, 3). This can be plotted on the graph, as shown.
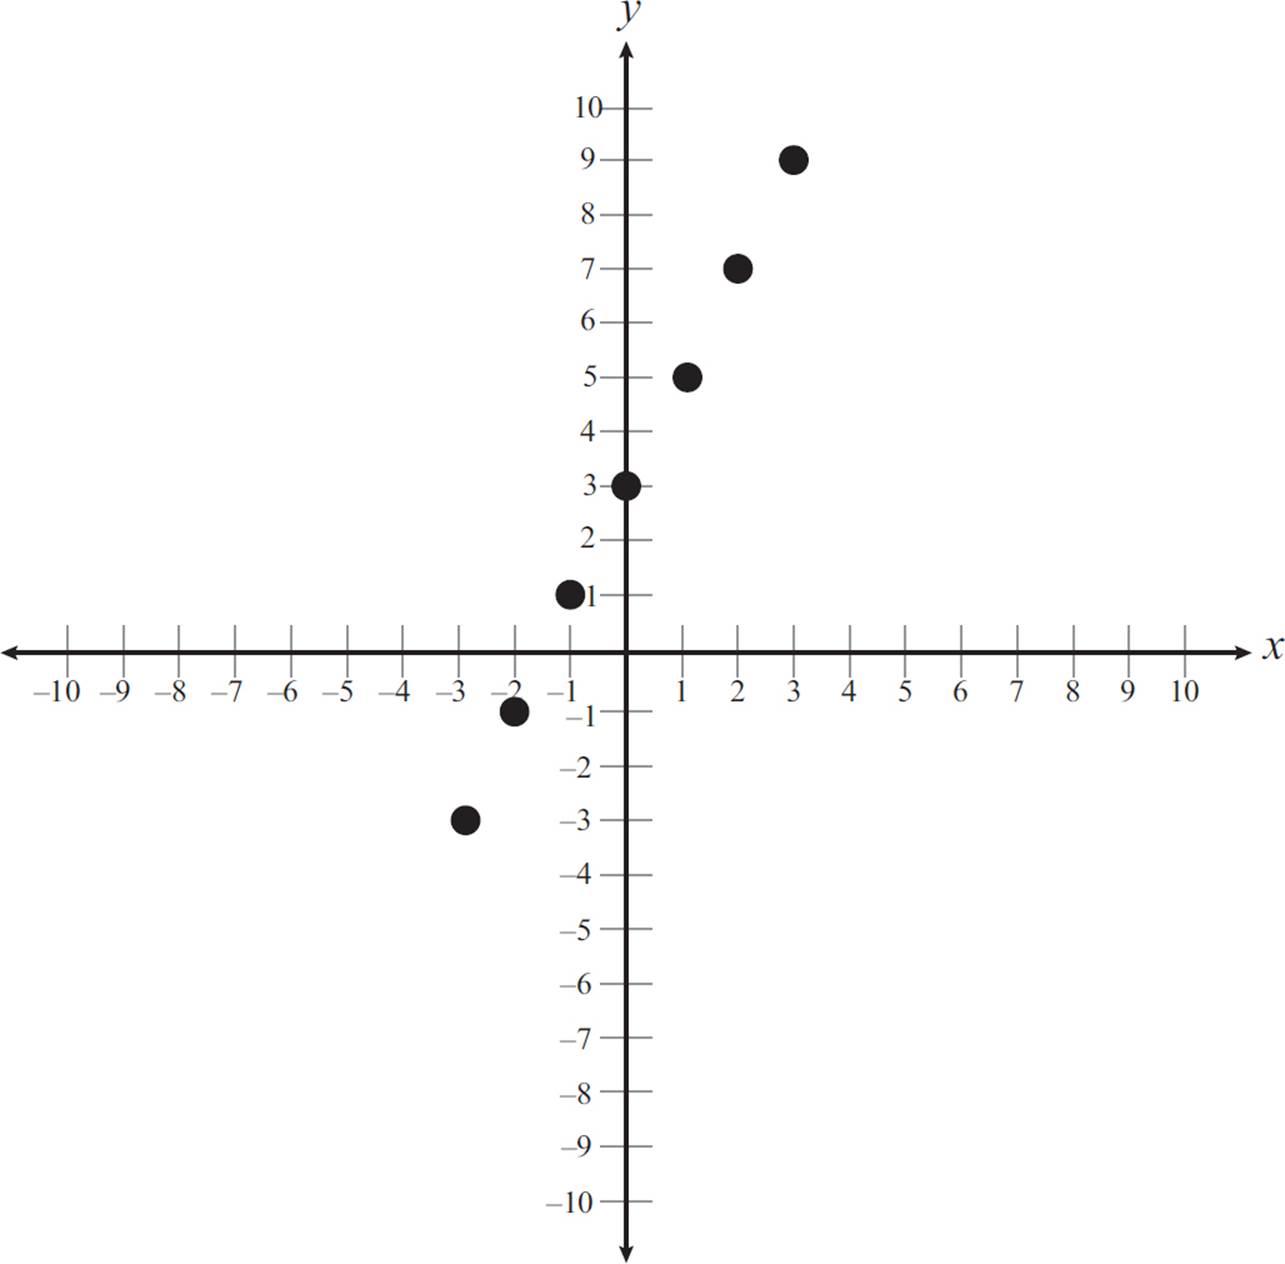
The slope is 2, and since slope is equal to rise/run, the y-coordinate increases by 2 as the x-coordinate increases by 1. Use this to plot additional points. Start with point (0, 3) and increase the x-coordinate by 1 and y-coordinate by 2 to get (1, 5). Do this again to get (2, 7) and (3, 9). Similarly, you can go backwards. Go back to the point (0, 3) and decrease the x-coordinate by 1 and the y-coordinate by 2 to get (−1, 1), and again to get (−2, −1) and (−3, −3). Plot these points as well.
Finally, draw a line that goes through all these points, as shown in the following graph.
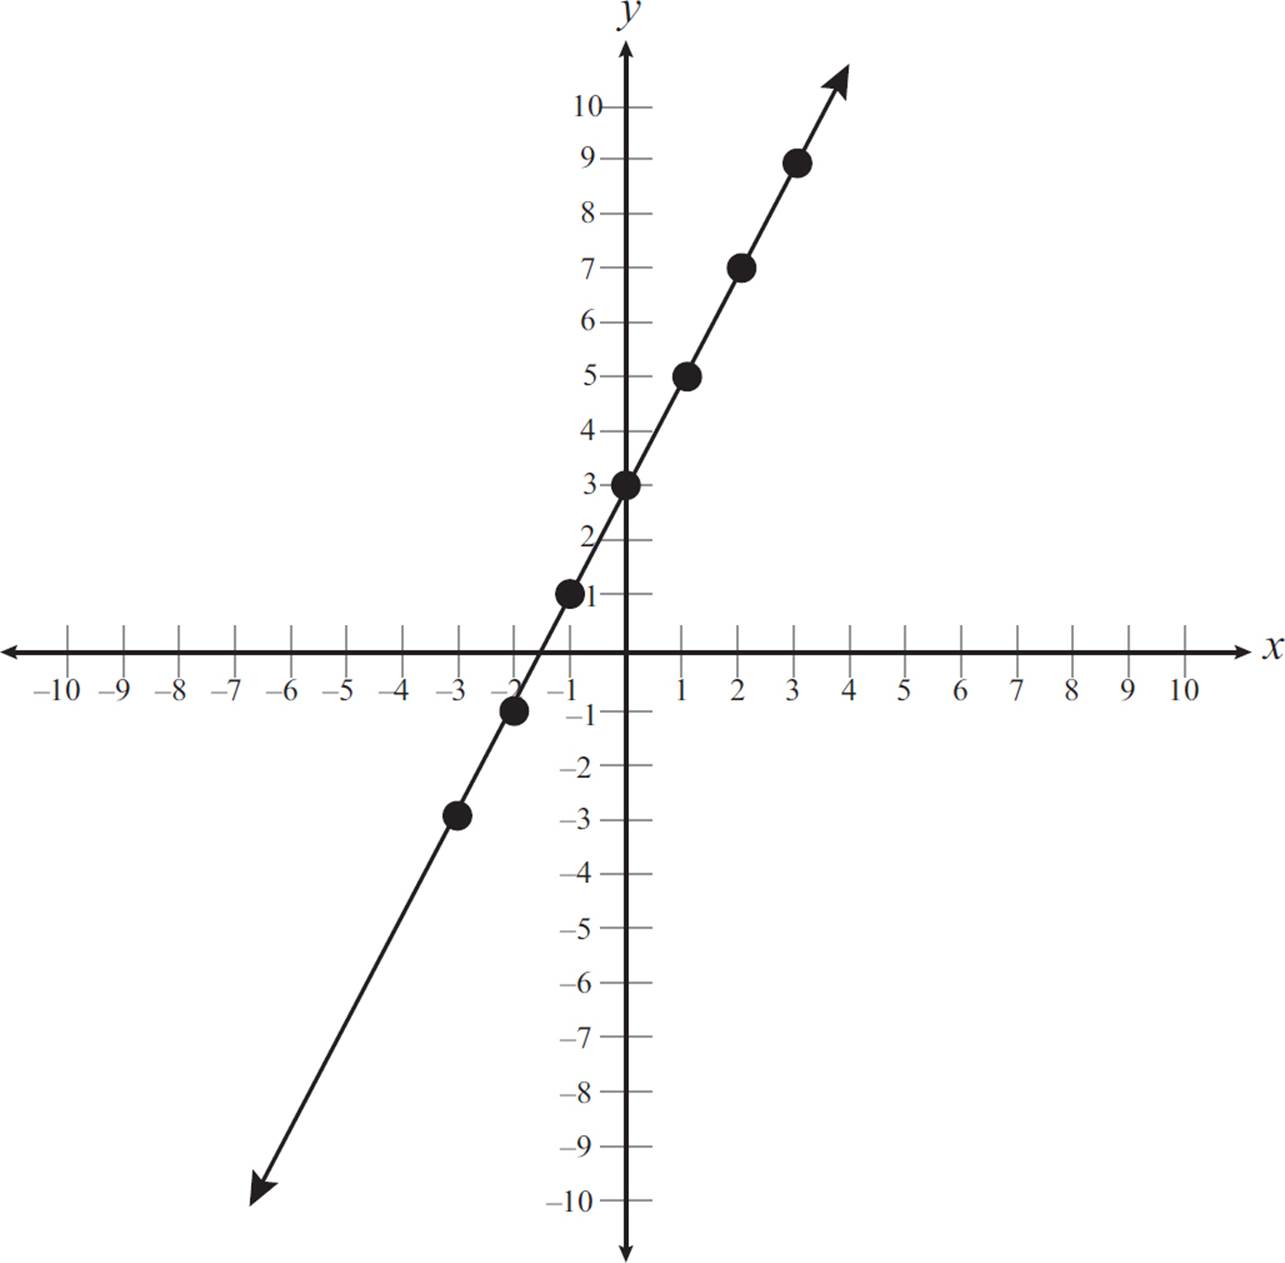
This line is a graphical representation of the two-variable linear equation y = 2x + 3.
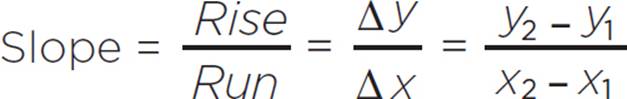
Slope can also be found from two points on a coordinate plane using the following formula:
Imagine that you were given the following graph, but not given the equation for the line. How would you find the slope?

If you know two points on a coordinate plane, the slope of a line can also be found by using the formula 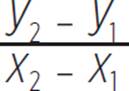 . In the previous graph, there are points at (0, 3) and (−2, −1). You can find the slope, m, by substituting those points into the following formula:
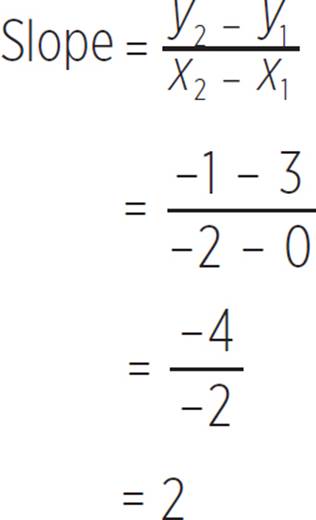
Thus, the line in this graph has a slope of 2. Note that the slope of 2 aligns with the value of m in the equation y = 2x + 3.
Now that we’ve learned about two-variable equations, graphs, and slope, let’s try a few questions that deal with these concepts.
EXAMPLE 
Rewrite the equation of the line 4x + 12 = 2y in slope-intercept form, and identify the x- and y-intercepts of the equation.
This question asks you to rewrite the equation in slope-intercept form, or y = mx + b. Start by rewriting the equation with the y-term to the left of the equals sign and the other terms to the right of the equals sign.
4x + 12 = 2y
2y = 4x + 12
Next, divide both sides of the equation by 2.
2y = 4x + 12
y = 2x + 6
That’s it! The equation 4x + 12 = 2y in slope-intercept form is y = 2x + 6. Now you need to identify the x- and y-intercepts of the equation. In order to find the x-intercept, set y = 0 and solve for x:
y = 2x + 6
0 = 2x + 6
2x = −6
x = −3
Excellent! You found that the x-intercept is (−3, 0). Now you need to find the y-intercept, which is the value of b when an equation is written in slope-intercept form, y = mx + b. Since the equation 4x + 12 = 2y has already been converted to slope-intercept form as y = 2x + 6, the y-intercept occurs at (0, 6).
Therefore, the equation 4x + 12 = 2y is written in slope-intercept form as y = 2x + 6, the x-intercept of the equation is (−3, 0), and the y-intercept is (0, 6).

Let’s build on this question.
EXAMPLE 
What is the slope of line 4x + 12 = 2y ?
You probably noticed that the equation here is the same one from Example 11. You should have also noticed that the slope is not easily identifiable in the equation 4x + 12 = 2y. So, as before, you will need to start by rewriting the equation in slope-intercept form.
4x + 12 = 2y
2y = 4x + 12
Next, divide both sides of the equation by 2.
2y = 4x + 12
y = 2x + 6
Now that the equation is in slope-intercept form, you can find the slope. Recall that when an equation is in y = mx + b form, the slope is equal to m. Therefore, the slope of the line is 2.
Now, you may be wondering if there’s another way to find the slope of a line. You’re in luck! If you have no desire to rewrite the equation in slope-intercept form, you can determine the slope of a line when it is written as a linear equation, or in the form ax + by+ c = 0. In this scenario, the slope is equal to −![]() .
.

The slope of a line in the form ax + by + c = 0 is equal to −![]()
Let’s look at the previous question again.
EXAMPLE 
What is the slope of the line 4x + 12 = 2y ?
Instead of rewriting the equation in slope-intercept form, let’s rewrite it in the linear form of an equation, or ax + by + c = 0. Start by subtracting 2y from both sides of the equation.
4x + 12 = 2y
4x − 2y + 12 = 0
Next, find the slope of the line by calculating −![]() .
.
a = 4 and b = −
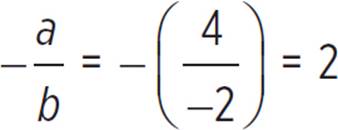
No matter how you crack it, the slope of the line is 2.

Now let’s walk through a question that tests your ability to identify visual representations of a linear equation.
EXAMPLE 
Identify the graph that represents the line 2x + 3y = 6. Provide the slope, x-intercept, and y-intercept of the equation.
A) 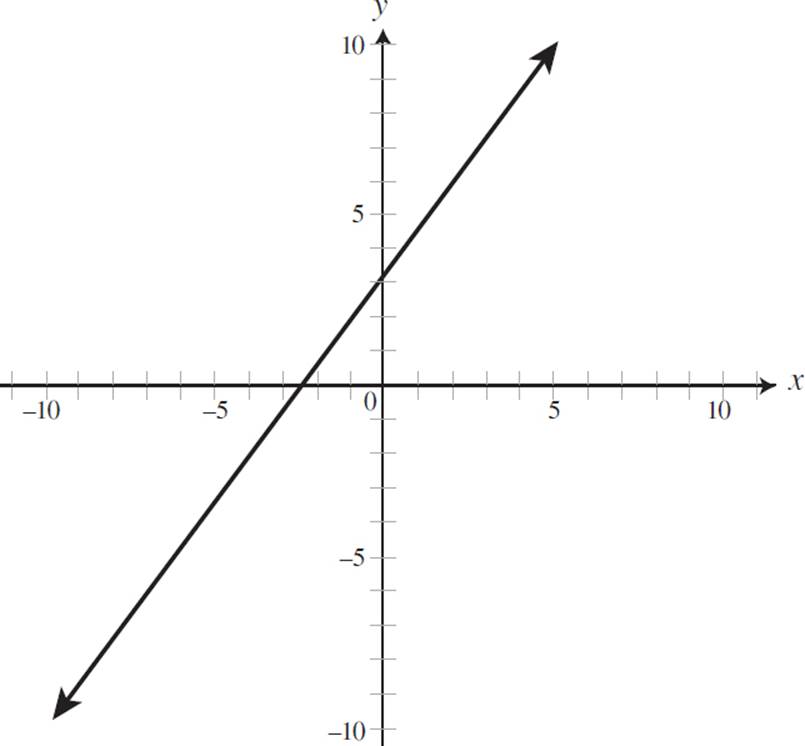
B) 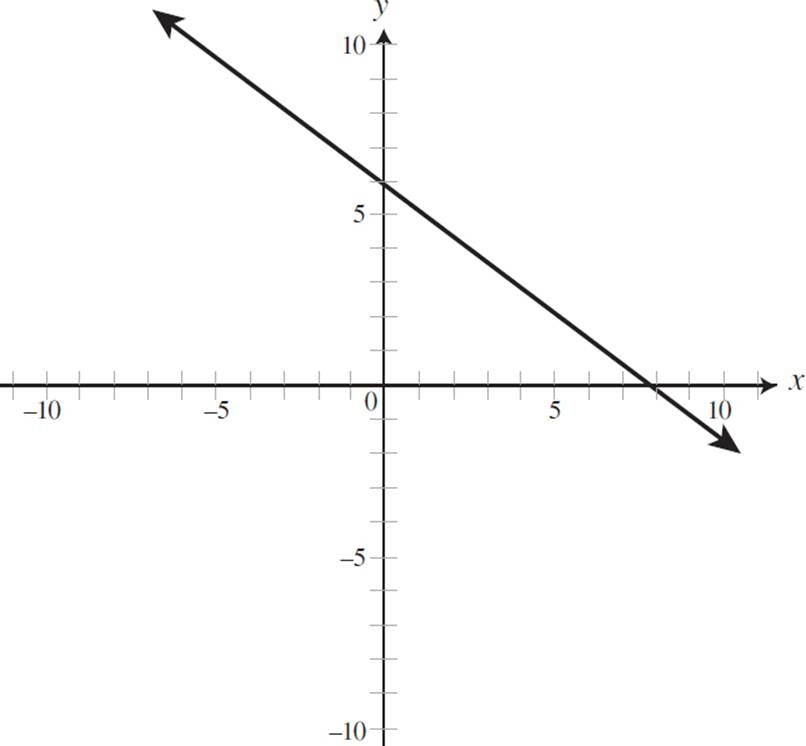
C) 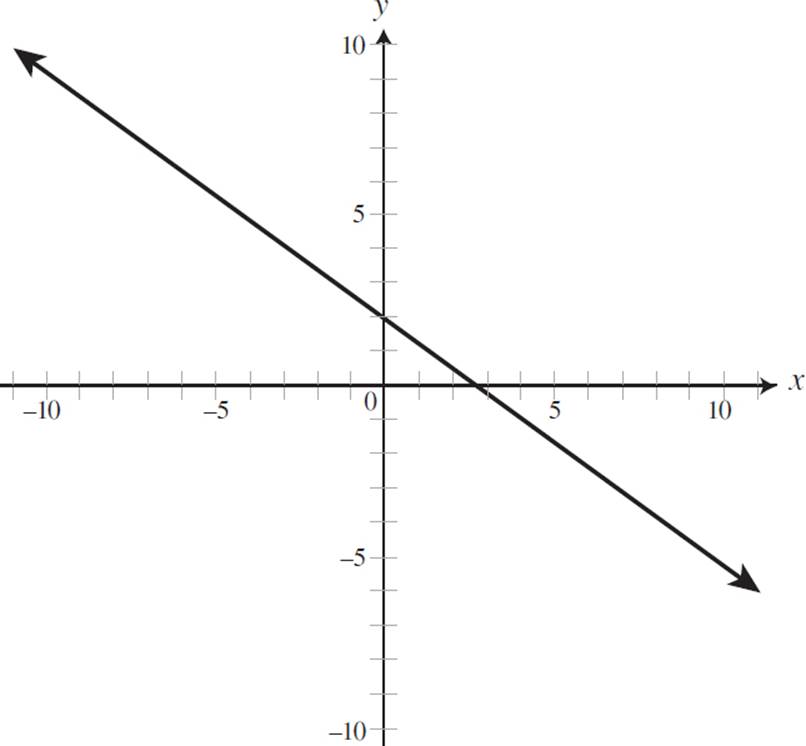
D) 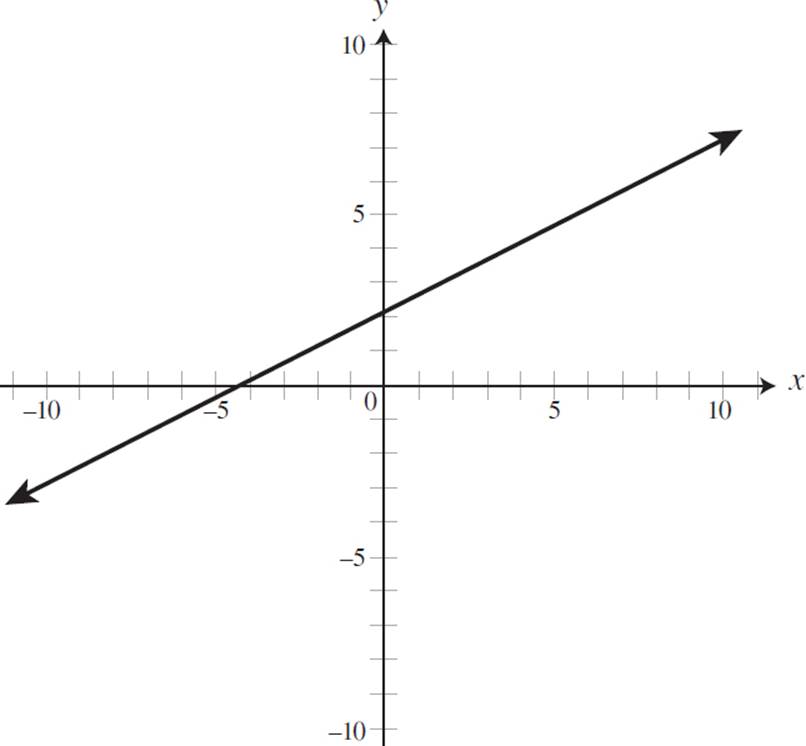
Where to begin? Start by putting the equation into y = mx + b form.
2x + 3y = 6
3y = −2x + 6
y = −![]() x + 2
x + 2
Now that the equation is in slope-intercept form, you can determine the slope and intercepts of the equation. Based on the equation, the slope of y = −![]() x + 2 is −
x + 2 is −![]() , and the y-intercept of the equation is (0, 2). Next, find the x-intercept by setting y = 0 and solving for x:
, and the y-intercept of the equation is (0, 2). Next, find the x-intercept by setting y = 0 and solving for x:
2x + 3y = 6
2x + 3(0) = 6
2x = 6
x = 3
Therefore, this equation has an x-intercept of (3, 0). Now that you have the slope and intercepts, you can identify the graph represented by the equation 2x + 3y = 6. Both (A) and (D) depict positive slopes and can thus be eliminated. Since we know that this equation has a y-intercept of 2, (B) can be eliminated. The only graph that represents an equation with a slope of −2/3, a y-intercept of (0, 2), and an x-intercept of (3, 0) is (C).

Here is how you may see slope on the ACT.
What is the slope of the line based on the equation 5x − y = 7x + 6 ?
F. −2
G. 0
H. 2
J. 6
K. −6