High School Algebra II Unlocked (2016)
Chapter 4. Trigonometric Functions
Lesson 4.4. Graphing Trigonometric Functions
REVIEW
The absolute value of a number is its distance from 0 on a number line, so the absolute value of any number 0 or greater is the number itself, and the absolute value of any negative number is its opposite, the positive version of that number. The notation |a| indicates the absolute value of a number a.
The slope of a line passing through (x1, y1) and (x2, y2) is equal to  .
.
For a function f(x), the graph of −f(x) is a reflection of f(x) across the x-axis, and the graph of f(−x) is a reflection of f(x) across the y-axis.
If we plot sine values using a standard (x, y) coordinate plane, with angle measure, in radians, on the x-axis and sine values on the y-axis, we can see the graph of the basic sine function, y = sin x.
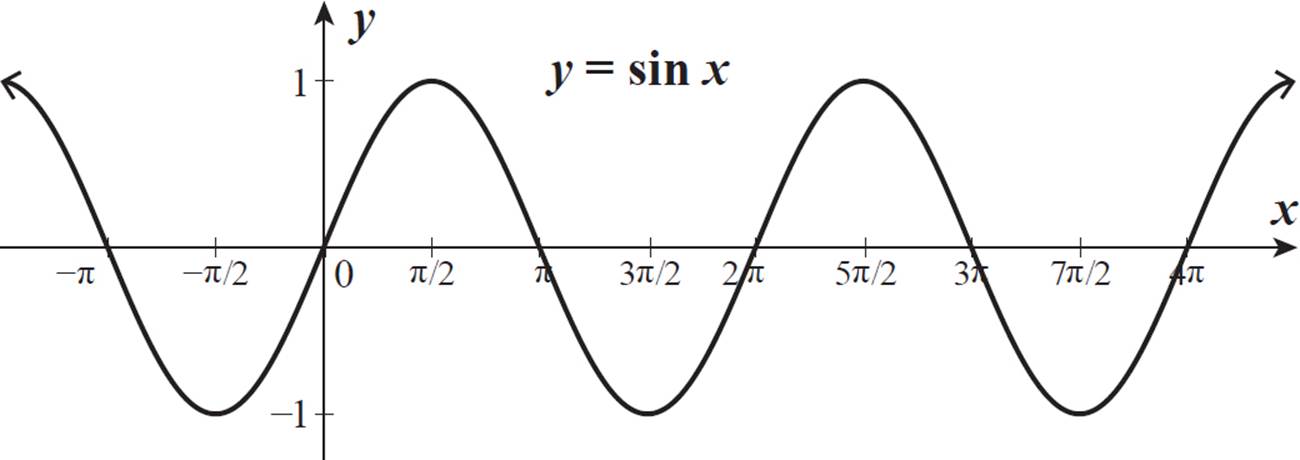
The function curve repeats the same wave pattern again and again, endlessly. This sine curve is a periodic function with a period of 2π, which means that the pattern repeats every 2π units on the x-axis. This is because a full revolution of the unit circle is 2π radians. Angle measures 2π apart are coterminal angles, with the same sine value.
All of the sine values
found in Example 7
are shown in the
graph: (0, 0),
(π/4, ![]() /2),
/2),
(π/2, 1),
(3π/4, ![]() /2), (π, 0),
/2), (π, 0),
(7π/6, −1/2),
(3π/2, −1),
and (2π, 0).

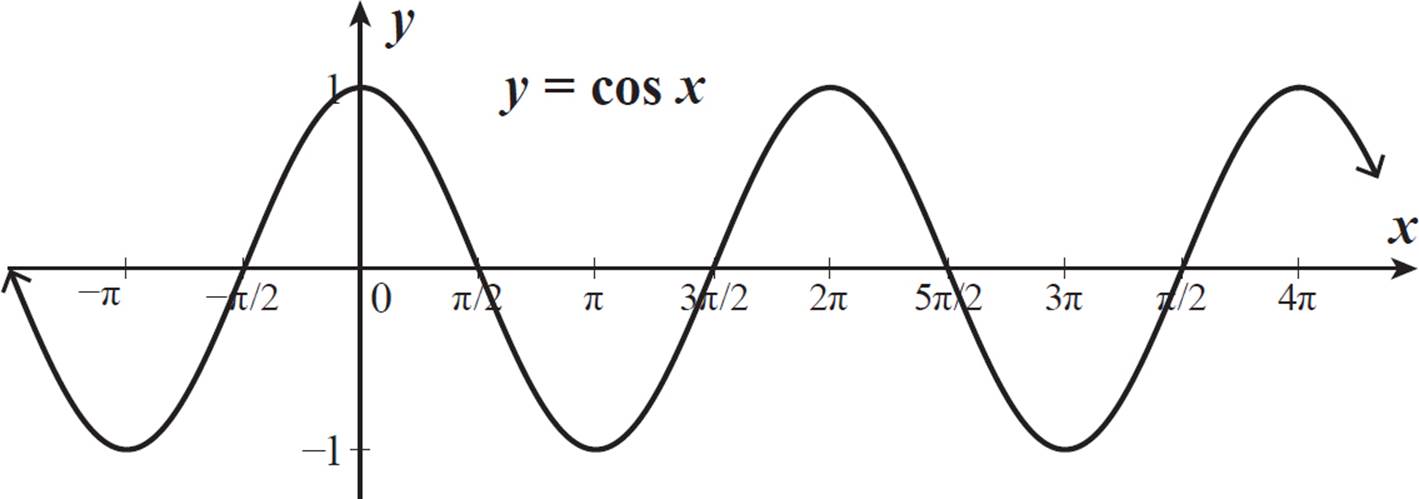
Graph the basic cosine function, y = cos x.
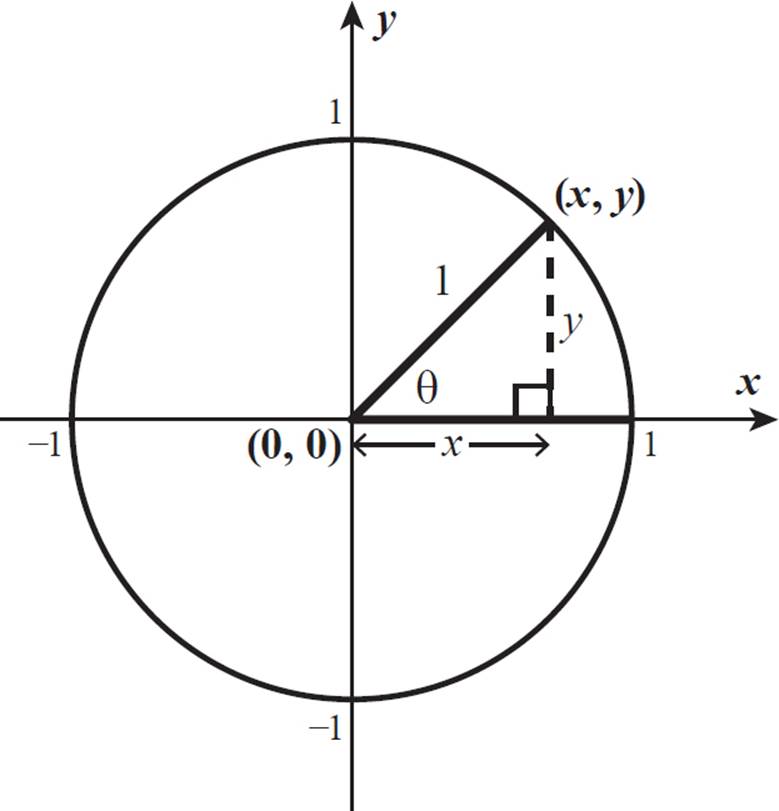
As when we were finding sine values, we can draw a vertical line from the point where the terminal side of a central angle meets the unit circle to the x-axis to create a right triangle.
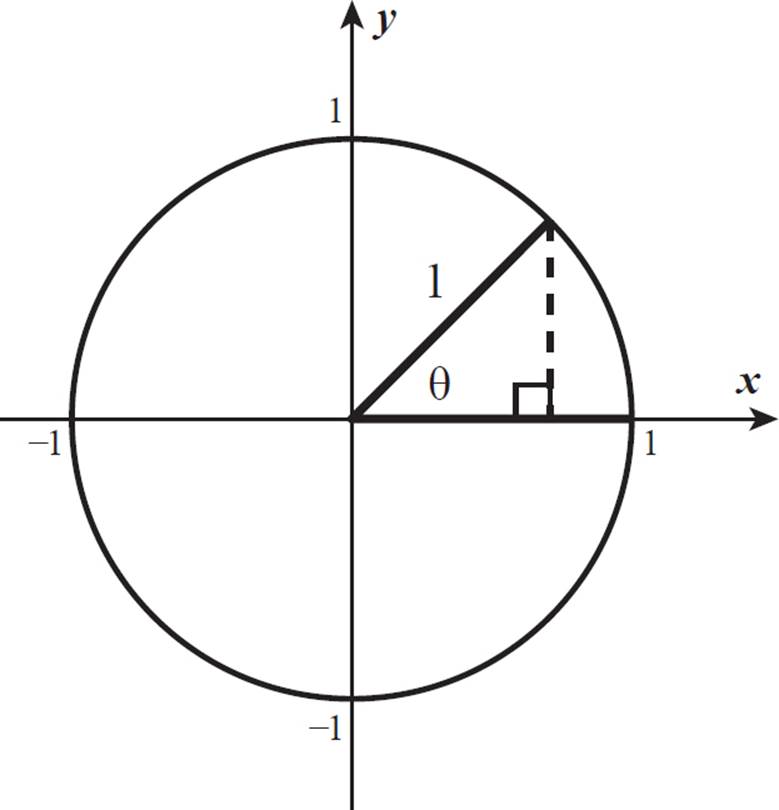
The cosine of an angle is 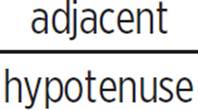 , and the hypotenuse, a radius of the unit circle, is equal to 1, so the cosine of the angle is the length of the adjacent side, the portion of the initial angle side that is part of the triangle formed.
The cosine of any central angle is equal to the x-value of the point where the terminal side meets the unit circle.
Imagine how the x-value of the point where the terminal side meets the unit circle changes for angles measuring 0 to π/2 radians. Some x-values in this range are represented by the horizontal legs of the triangles shown below.
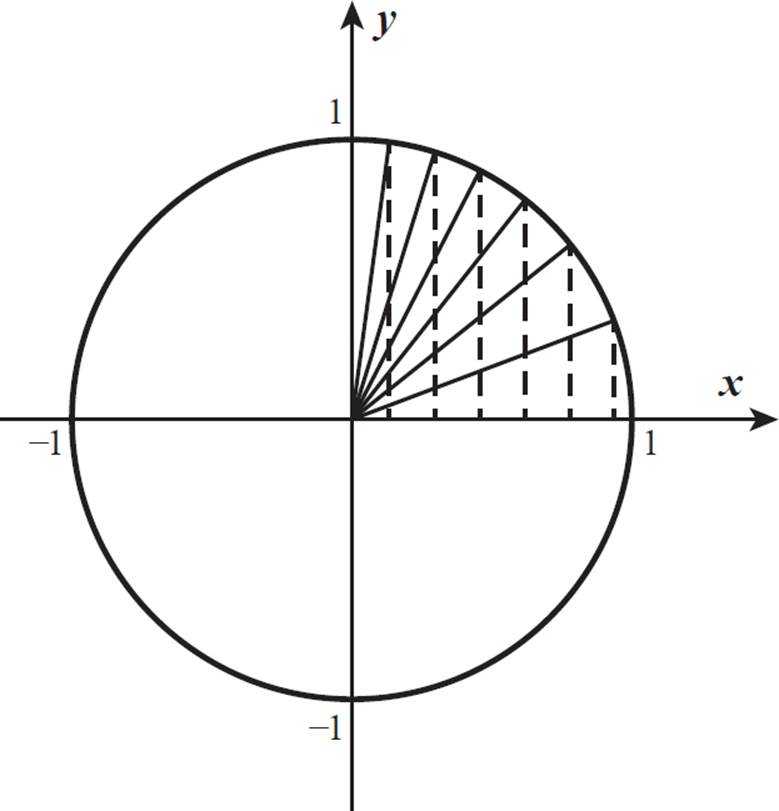
The cosine of 0 is 1, because the terminal side lies on the initial side, extending to 1 on the x-axis. The cosine value decreases from there until an angle of π/2, at which point the cosine value has shrunk to 0.
To the left of the y-axis, x-values are negative, so the cosine values of angles between π/2 and 3π/2 are negative. From cos π/2 at 0, cosine values decrease to −1 for an angle of π. From π to 3π/2, cosine values increase from −1 to 0.
In Quadrant IV, x-values are positive, so cosine values are positive. From 3π/2 to 2π, the cosine increases from 0 to 1.
Also, recall that the cosine of an angle is equal to the sine of its complementary angle, as we saw with triangle ABC at the beginning of this chapter. To put it another way, the cosine of an angle θ is equal to the sine of (π/2 − θ), and this is true for all angles (not just angles between 0 and π/2). So, the cosine function graph should have the same basic shape of the sine function graph but passing through the values we’ve found, (0, 1), (π/2, 0), (π, −1), (3π/2, 0), and (2π, 1).

The tangent function is different, because its ratio does not include the hypotenuse. Tangent =  . We can still draw a vertical line from the endpoint of the terminal side of the angle to the x-axis to form a right triangle, which we can use to calculate the tangent value.
The opposite side is equal to the y-value, and the adjacent side is equal to the x-value of the point where the terminal side meets the unit circle. The terminal side of the angle begins at the origin, (0, 0). So, the tangent of this angle is equal to y/x, or the change in y-values (from 0 to y) divided by the change in x-values (from 0 to x). In other words, the tangent of a central angle is equal to the slope of its terminal side.
When θ = 0, tan θ = 0/1 = 0. When θ = π/4, the triangle formed is an isosceles right triangle, so x = y and tan π/4 therefore equals 1. When θ = π/2, tan θ = 1/0. This fraction is undefined, so the tangent of π/2 is undefined. In other words, tan π/2 does not exist. However, as θ increases and approaches π/2, the adjacent leg becomes very tiny, causing the tangent value to become very large, approaching ∞.
In Quadrant II, the opposite leg (y-value) is positive, but the adjacent leg (x-value) is negative. So, the tangent values of angles between π/2 and π are negative, ranging from close to −∞ to close to 0. The value of tan π is 0/1, or 0.
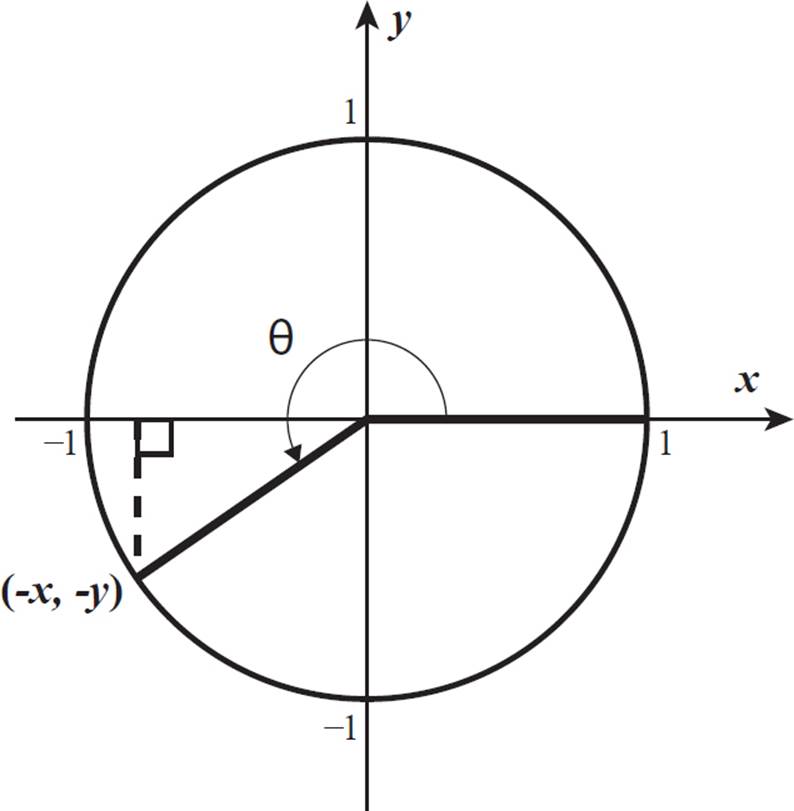
In Quadrant III, both the opposite leg (y-value) and the adjacent leg (x-value) are negative, as shown below, so the tangent value is positive. A negative number divided by a negative number produces a positive quotient.
The tangent of 3π/2 is −1/0, an undefined value, so tan 3π/2 does not exist.
In Quadrant IV, the opposite leg (y-value) is negative, and the adjacent leg (x-value) is positive. So, the tangent values of angles between 3π/2 and 2π are negative and increasing to 0, the value of tan 2π.
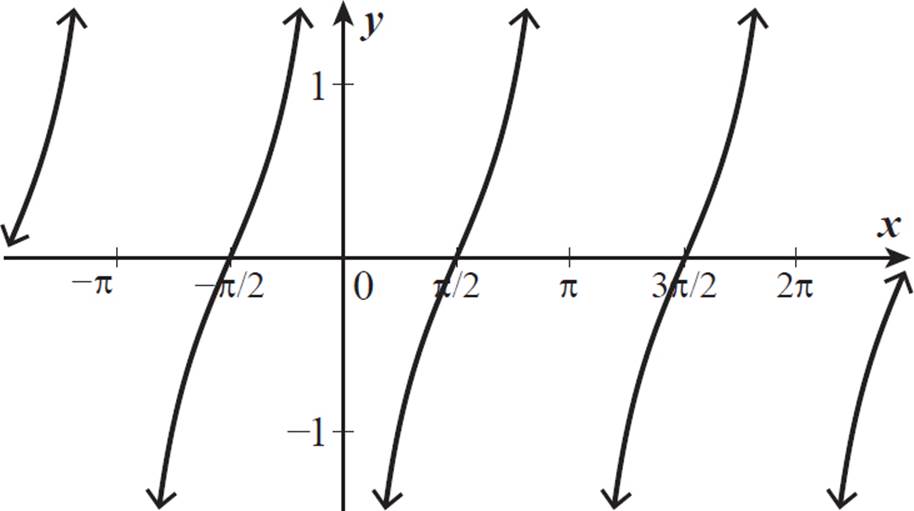
The graph of the basic tangent function, y = tan x, is shown below.
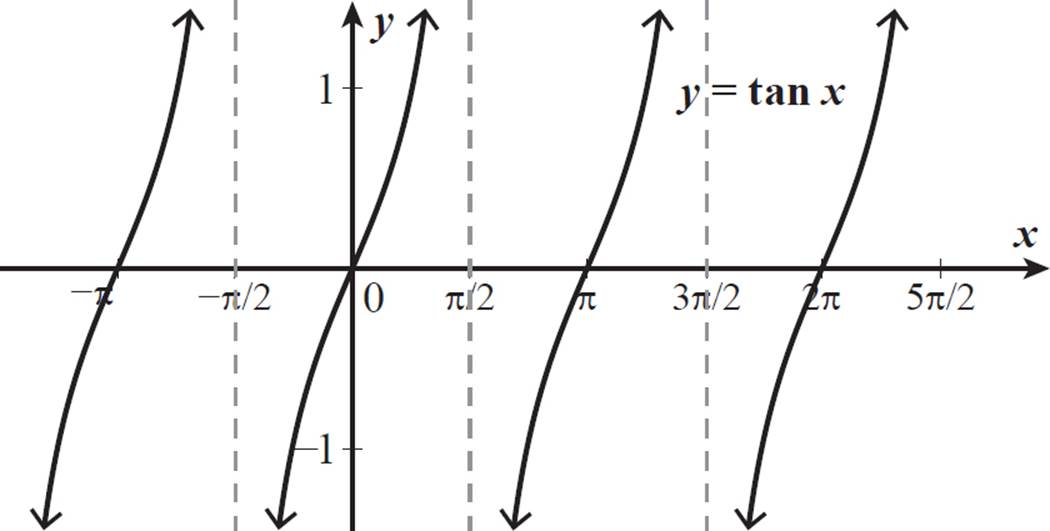
There are vertical asymptotes at −π/2, π/2, and 3π/2, as indicated by the dashed lines. The tangent value does not exist for these angle measures.
Notice that the curve pattern for tangent repeats every π units.
The tangent function has a period of π units, whereas the sine and cosine functions have periods of 2π units.
CHANGES TO PERIOD, MIDLINE, AND AMPLITUDE OF GRAPHS
The graphs of the sine, cosine, and tangent functions that we have seen so far are the parent functions, the most basic versions of each trigonometric function. As with polynomial, rational, or radical functions, additional constant terms or coefficients affect the position and scale of the graph.

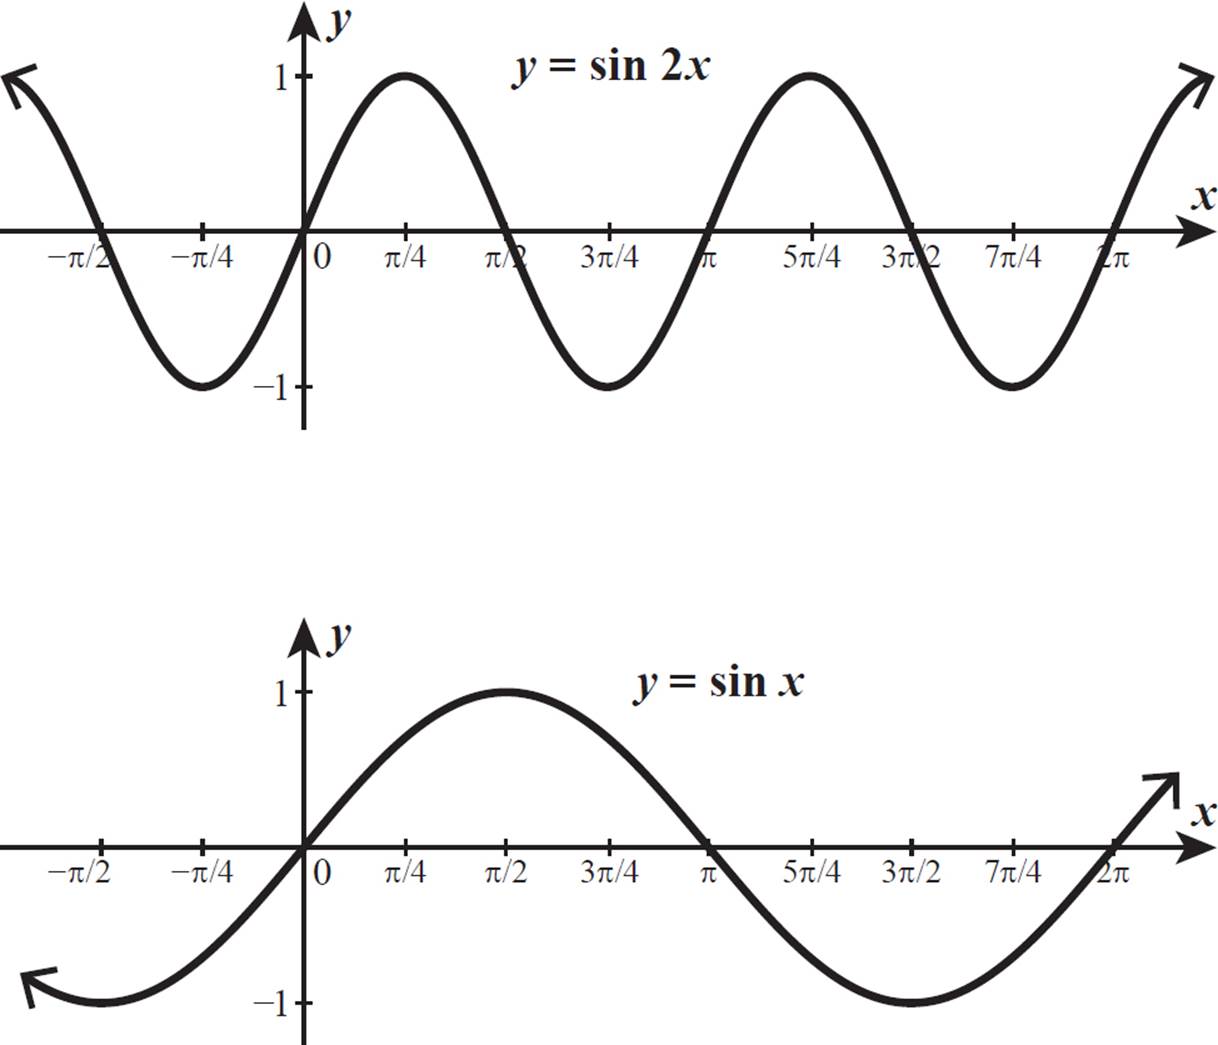
Graph the function y = sin 2x.
We know that sin 0 = 0, sin π/2 = 1, sin π = 0, sin 3π/2 = −1, and sin 2π = 0. We can use these to find points on the function y = sin 2x.
When x = 0, y = sin (2 ⋅ 0) = sin 0 = 0.
When x = π/4, y = sin (2 ⋅ π/4) = sin π/2 = 1.
When x = π/2, y = sin (2 ⋅ π/2) = sin π = 0.
When x = 3π/4, y = sin (2 ⋅ 3π/4) = sin 3π/2 = −1.
When x = π, y = sin (2 ⋅ π) = sin 2π = 0.
The graph of y = sin 2x passes through all the same y-values as the graph of y = sin x but gets to them twice as quickly. The graphs of y = sin 2x and y = sin x are shown below.
Looks can be
deceiving! Always use
the values along the
x-axis, rather than the
overall appearance of
the graph, to assess
the function’s period.
In these graphs, we
have “zoomed in”
(horizontally only) to
better compare the
two sine functions, so
this graph of y = sin x
appears more spread
out than the one at
the beginning of this
lesson, but it actually
has the same period.

The graph of y = sin 2x completes a full cycle in half the distance of the parent sine curve, y = sin x. The period of y = sin 2x is π, which is 1/2 the period of y = sin x.
Contrast this with a
coefficient of x that is
less than 1. The period
of y = sin 1/2 x,
or y = sin x/2, is 2 times
the period of y = sin
x. It stretches the full
cycle across 4π units.
The frequency of a trigonometric function is the number of cycles it completes in a given interval, so the period and frequency of a trigonometric function are inversely related. As the period increases, the frequency decreases. As the period decreases, the frequency increases, as in Example 9. For a domain interval of 2π radians, y = sin x has a frequency of 1 (one complete wave cycle), but y = sin 2x has a frequency of 2 (two complete wave cycles). Halving the period doubled the frequency.
For all of the trigonometric functions we have graphed so far, the midline has been the x-axis. The midline is the horizontal line around which the periodic function oscillates and is halfway between the maximum and minimum for sine and cosine functions. The midline of the tangent function is the horizontal line that includes the points of inflection of the graph. A point of inflection is a point where a curve changes its direction, from concave to convex or from convex to concave.
Some trigonometric functions have midlines that are above or below the x-axis.
The hertz (Hz) is the
unit of frequency
defined as one cycle
per second. In science,
the frequencies of
sound waves, light
waves, and radio
waves are usually
measured in reference
to a time unit, such
as a second. Because
there are such a huge
number of waves
per second, the
frequencies of these
waves are defined in
kilohertz (103 Hz),
gigahertz (109 Hz), or
terahertz (1012 Hz).

What equation could describe the function graphed below?
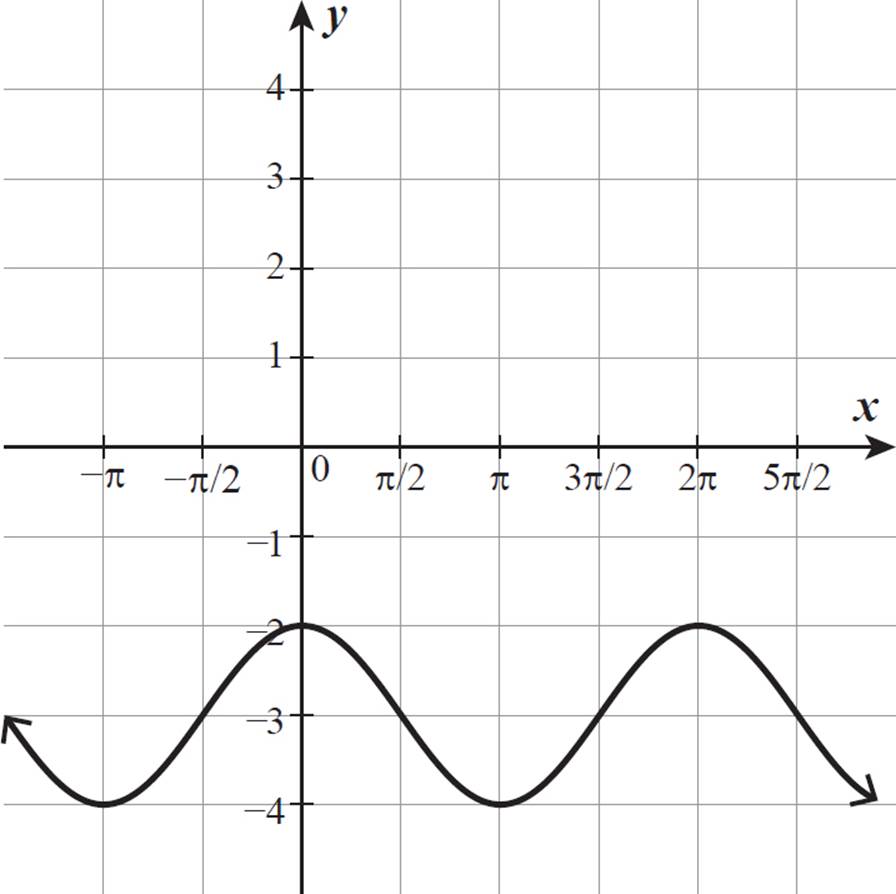
The maximum value of the function is −2, and the minimum value is −4, so the midline is the horizontal line at the average of these y-values.
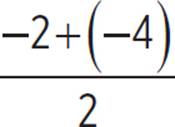 = −6/2 = −3
This function has a midline of y = −3.
The function is at its maximum when it crosses the y-axis, which is also the case for y = cos x. Compare this graph to the one of y = cos x in Example 8. The graphs have the same shape and the same period, but the one shown above is the graph of y = cos xshifted 3 units directly down. For any given x-value, this graph has a y-value 3 units less than y = cos x. Where cos x = 1, this graph is at −2; where cos x = 0, this graph is at −3; and where cos x = −1, this graph is at −4.
The function graphed here is y = cos x − 3. As with other kinds of functions, adding a constant to the original function value vertically shifts the function graph that number of units: up if the constant is positive, down if the constant is negative.
Looking at the midline
can immediately tell
you the shift of the
graph. The midline
y = −3 means that the
parent cosine graph
was shifted 3 units
down, and −3 is the
constant to add to
y = cos x when writing
the function equation.

We just saw how a trigonometric function graph can be shifted vertically. Trigonometric function graphs can also be shifted horizontally, by adding a constant to the x term within the function. In other words, cos (x + 2) represents a cosine function shifted 2 units horizontally, to the left.

As discussed in
Lesson 1.4, f(x − c)
represents f(x) shifted
c units horizontally.
Watch the sign! When
c is negative, as in
f(x − [− c]), it becomes
f(x + c) and shifts
to the left.

Graph the function y = tan (x − π/2).
Look at the graph of y = tan x to determine some values along the curve y = tan (x − π/2). When x = 0, the expression tan (x − π/2) becomes tan (− π/2), which is undefined. When x = π/2, the expression tan (x − π/2) becomes tan 0, which equals 0. For eachx-value, the function y = tan (x − π/2) is the same as the function y = tan x exactly π/2 units to the left of there. So, the function y = tan (x − π/2) is the function y = tan x shifted π/2 units to the right.
The parentheses tell us
that π/2 is subtracted
from x, not from tan x.
If you were asked to
graph the function
y = tan x − π/2, it
would instead be the
graph of y = tan x
shifted vertically
π/2 units down.

This graph is also the graph of y = tan (x + π/2), because it is the graph of y = tan x shifted π/2 units to the left. The reason y = tan (x − π/2) and y = tan (x + π/2) look identical is because they are exactly one full tangent period apart. The difference (x + π/2) − (x − π/2) is equal to π, the period of the basic tangent function.
In addition to shifting horizontally and vertically and expanding and contracting the cycles (changing the period), we can also adjust the amplitude of a trigonometric function. The amplitude is the distance between the midline and the maximum or minimum for sine and cosine functions. Tangent functions have no maximum or minimum, so they do not have amplitudes, but their scale can be similarly adjusted.
You can also think
of the amplitude as
the height of the
wave of the function,
from the midline.
Just remember that
distance is always
positive, so the
amplitude is always
positive, even when
you measure the
dip of a wave below
the midline.

Graph the function y = 4 sin x.
First, remember what the function y = sin x looks like.
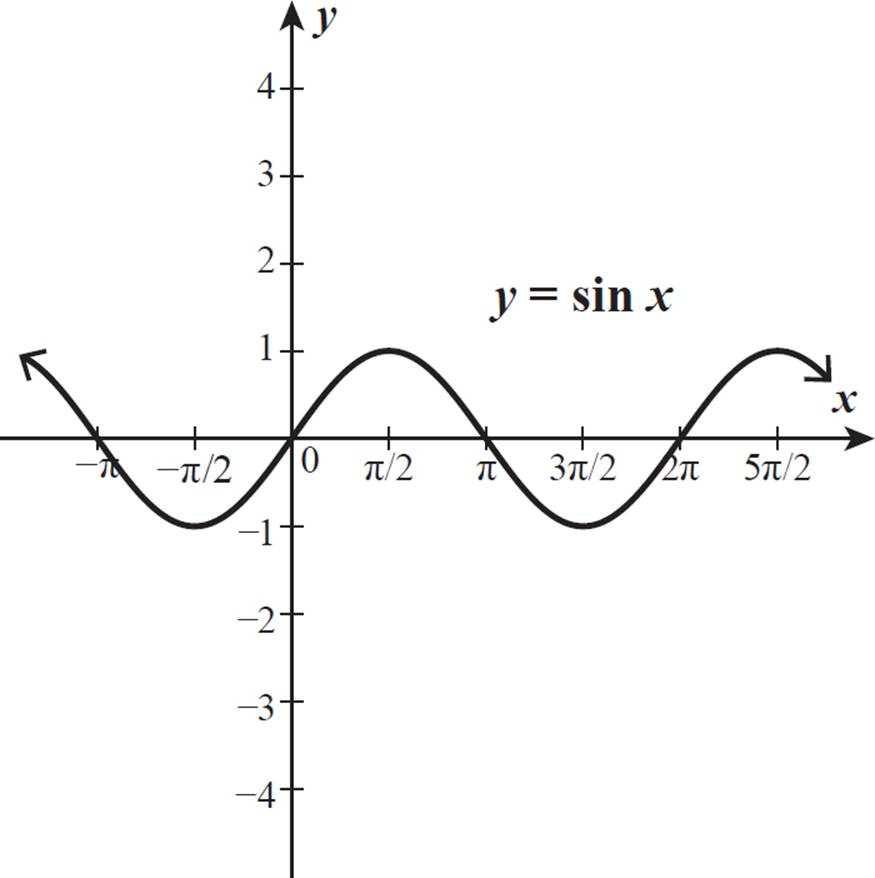
For each value of x, 4 sin x will be 4 times the value of sin x. For example, when x = π/2, sin x = 1, so 4 sin x = 4. This is where the sine curves reach their maximum. When x = π/6, sin x = 1/2, so 4 sin x = 2. When x = π, sin x = 0, so 4 sin x also equals 0. The graph of y = 4 sin x is shown below.
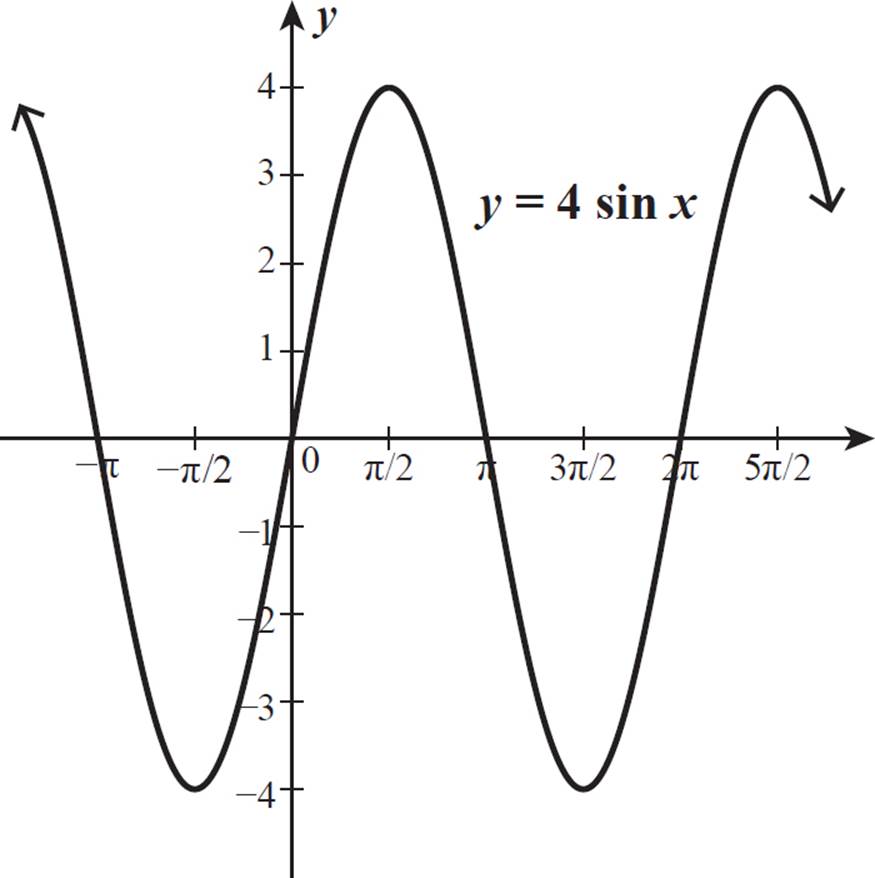

The amplitude of y = sin x is 1, because this is the distance between the midline value (0) and either the maximum (1) or the minimum (−1). The graph of y = 4 sin x also has a midline of y = 0 (the x-axis), but its maximum is 4 and its minimum is −4. The amplitude of y = 4 sin x is 4. The amplitude of the parent graph was multiplied by the coefficient of the trigonometric function value.

Graph the function y = −1/2 tan x.
First, let’s review what y = tan x looks like.
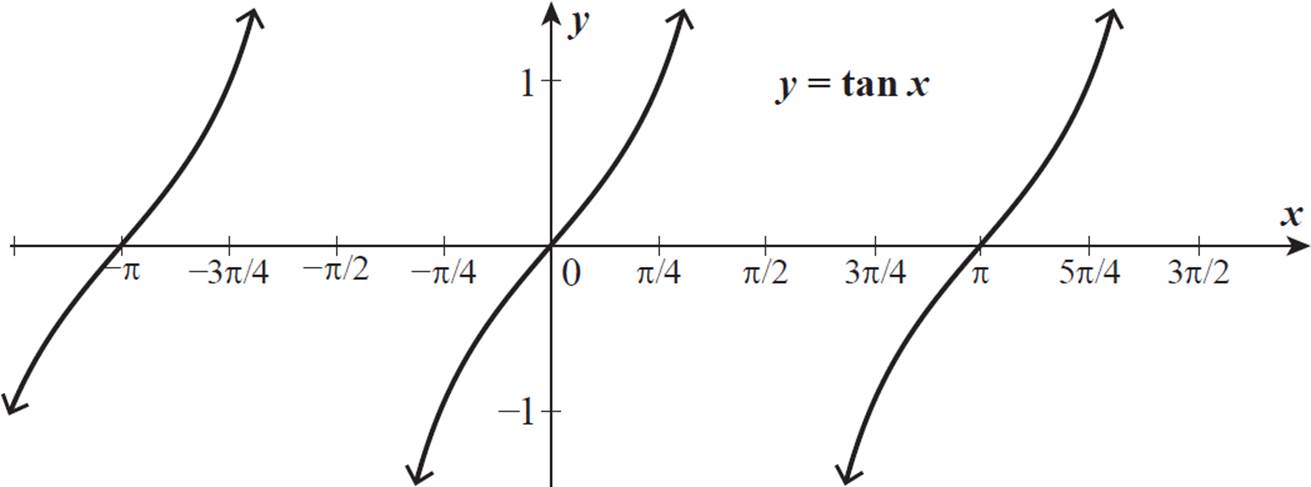
We can multiply various values of tan x by −1/2 to find points along the graph of the function y = −1/2 tan x.
When x = −π, tan x = 0. So, −1/2 tan (−π) = 0.
When x = −3π/4, tan x = 1. So, −1/2 tan (−3π/4) = −1/2.
When x = −π/2, tan x is undefined. So, −1/2 tan (−π/2) is also undefined.
When x = −π/4, tan x = −1. So, −1/2 tan (−π/4) = 1/2.
When x = 0, tan x = 0. So, −1/2 tan 0 = 0.
When x = π/4, tan x = 1. So, −1/2 tan π/4 = −1/2.
Here is the graph of y = −1/2 tan x.
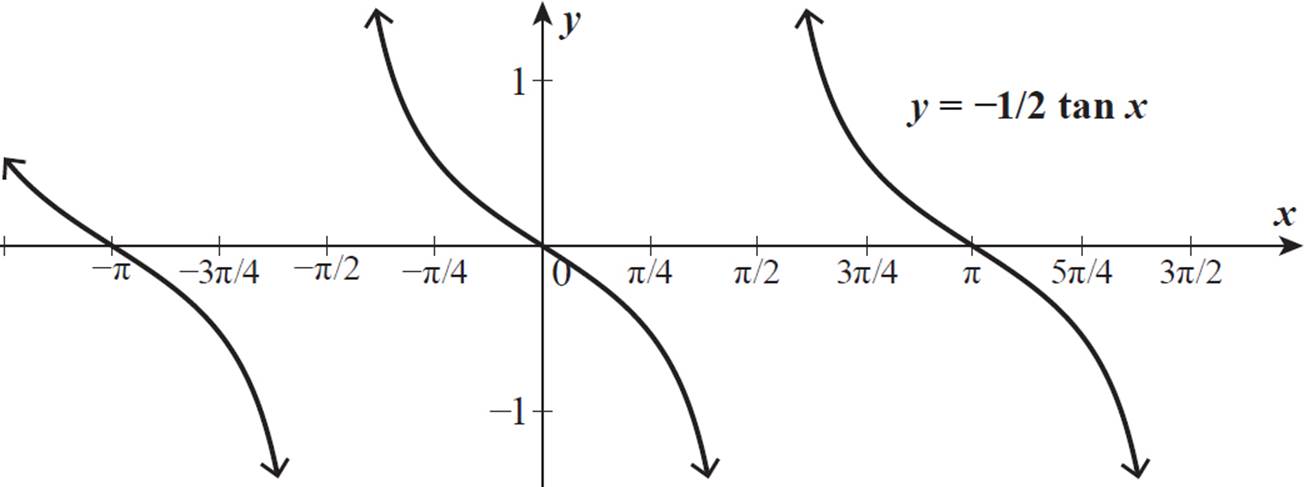

The coefficient of 1/2 pulled all points closer to the midline, so the curves are more squat, although the period of the cycle is unchanged. The negative sign in y = −1/2 tan x changed the sign of the function value of y = tan x for each x-value, from positive to negative and from negative to positive. In other words, the negative sign in the coefficient reflected the function graph across the x-axis, so each continuous curve is always decreasing in y = −1/2 tan x, whereas y= tan x is always increasing over each continuous section.
What happens when there is a negative sign in front of x instead of in front of the entire trigonometric expression? As in other types of functions, f(−x) reflects the function f(x) graph across the y-axis, because the function value for any given x-value is that of its opposite in the original function.
Try graphing y = 1/2 tan (−x) on a graphing calculator. It looks exactly the same as y = −1/2 tan x. This is because the graph of y = 1/2 tan x is symmetric with respect to the origin. Reflecting it across the y-axis produces the same result as reflecting it across the x-axis.
However, reflections are not always across the x-axis or y-axis.
Graphs of the form
y = a tan x, where a
is some real number,
are symmetric with
respect to the origin.
However, once
translated horizontally
or vertically, the
graph may not be
symmetric with
respect to the origin.

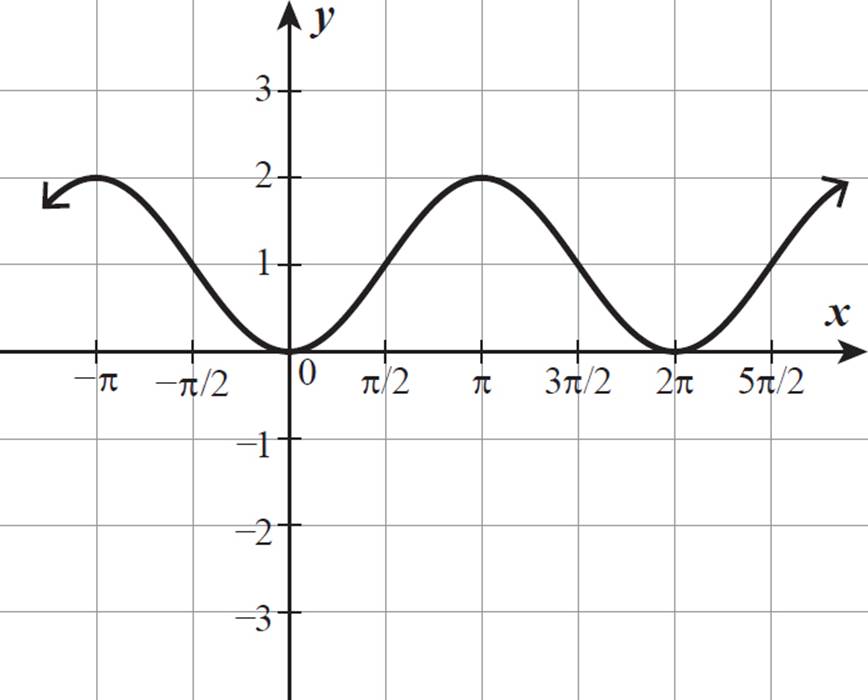
Graph the function y = −cos x + 1.
The function has a midline of 1. Let’s find some values along the curve.
When x = 0, y = −cos 0 + 1 = −(1) + 1 = 0.
When x = π/2, y = −cos π/2 + 1 = −0 + 1 = 1.
When x = π, y = −cos π + 1 = −(−1) + 1 = 2.
When x = 3π/2, y = −cos 3π/2 + 1 = −0 + 1 = 1.
When x = 2π, y = −cos 2π + 1 = −(1) + 1 = 0.
Here is the graph of y = −cos x + 1.
Another way to
approach this is to
graph the function
y = −cos x, which is a
reflection of y = cos x
across the x-axis,
and then translate
it 1 unit upward.

This is the graph of y = cos x + 1 (the parent cosine graph shifted 1 unit up) reflected across the line y = 1. So, a negative sign in front of the trigonometric expression indicates a reflection of the function across the midline of the function. In y = −1/2 tan x in Example 13, the midline was the x-axis, so the graph was reflected across the x-axis.
Similarly, the graph of y = cos −(x − π) would be the parent graph shifted π units to the right and then reflected across the vertical line x = π. Or, you could rewrite it as y = cos (−x + π), which represents the parent cosine graph shifted π units to the left to form f(x) = cos x + π) and then reflected across the y-axis to form f(−x), or cos (−x + π).

As we mentioned
in Example 8,
cos θ = sin (π/2 − θ),
which can be written
as sin −(θ − π/2).
So, the basic cosine
function graph is the
basic sine function
graph shifted π/2
units to the right and
then reflected across
the line y = π/2.
We can now summarize what we have learned about changes to the graphs of basic trigonometric functions.
A sine function of the form y = a sin b(x − c) + d or a cosine function of the form y = a cos b(x − c) + d is the respective parent trigonometric function adjusted as follows:
•The amplitude is equal to |a|. When |a| is greater than 1, the waves are taller, reaching up and down |a| units from the midline. When |a| is less than 1, the waves are shorter than 1 unit.
•The graph is shifted vertically d units: up if d is positive, down if d is negative. The midline of the function is the line y = d.
•The graph is shifted horizontally c units: to the right if c is positive (when a constant is subtracted from x), to the left if c is negative (when a constant is added to x).
•The period of the graph is multiplied by |1/b|. So, if |b| is greater than 1, the graph oscillates more quickly and looks more scrunched up, and if |b| is less than 1, the graph oscillates more slowly and looks more spread out, left to right.
•If a is negative, the graph is reflected across the midline, y = d (the x-axis when d = 0). If b is negative, the graph is reflected across the line x = c (the y-axis when c = 0).
All of the above also apply to a tangent function of the form y = a tan b(x − c) + d in relation to its parent function, except that a tangent function does not have an amplitude. Its curves, however, stretch vertically according to the value of a.
The period of a sine
or cosine function
is 2π/b, and the
period of a tangent
function is π/b.
You will need to look at various attributes of a trigonometric function at the same time, rather than in isolation as we have done so far in this lesson.

Write an equation to describe the function graphed below.
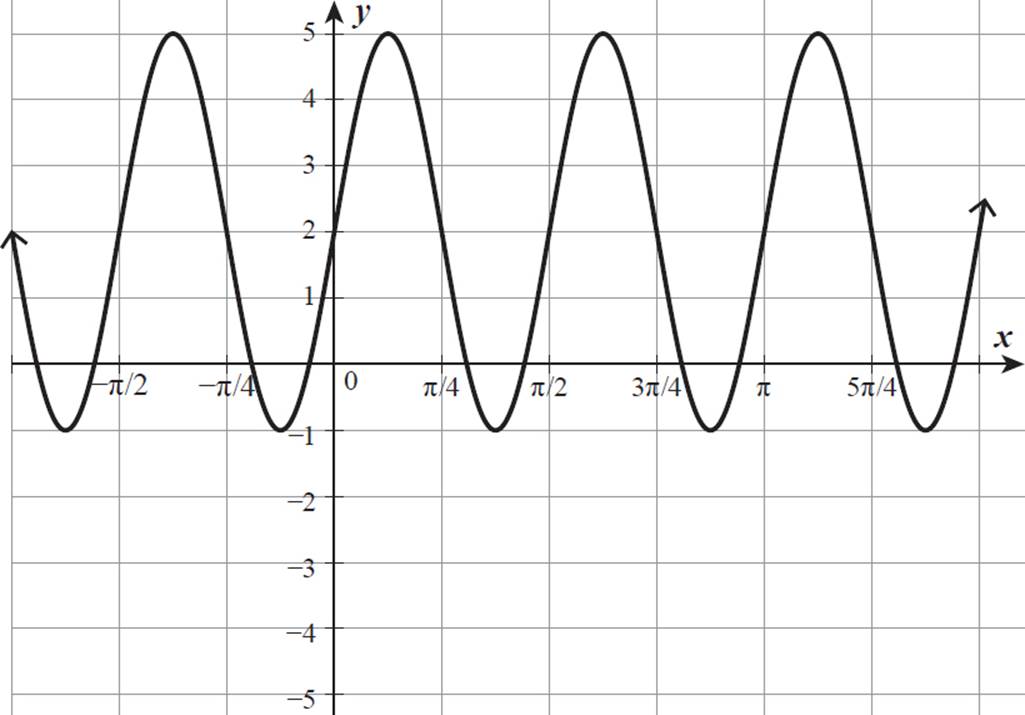
This graph shows a maximum of 5 and a minimum of −1. The average of these is  = 2, so the midline for this graph is y = 2. The difference between the midline value, 2, and the maximum, 5, or the minimum, −1, is 3. So, the amplitude is 3.
The graph begins at its midline, 2, when x = 0. The basic sine curve also starts at its midline when crossing the y-axis, so we’ll write the equation of a sine function with an amplitude of 3 and translated 2 units up. However, the period is much shorter than 2π. This graph completes a full cycle in π/2 units, which is 1/4 of 2π. So, b in y = a sin b(x − c) + d is equal to 4.
A sine function with an amplitude, a, of 3, a vertical shift, d, of 2, and a period of π/2 (b = 4) is described by the equation y = 3 sin 4x + 2. This represents the given graph.
Another way to
write an equation
describing this graph
is as a cosine function
shifted horizontally.
But, writing this
as a sine function
without any horizontal
shift is simpler.

This equation can also be written as y = 2 + 3 sin 4x. By the commutative property of addition, the sum of the trigonometric expression and the constant d may be written in either order.

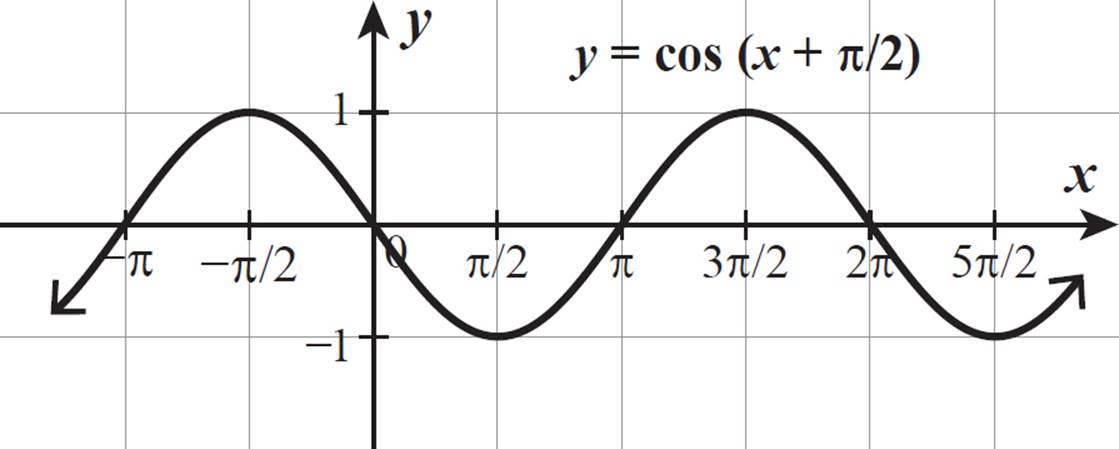
Graph the function y = cos (x + π/2). Then, write two different equations that can also be used to describe the same graph.
The constant π/2 is added to x, so the graph of y = cos (x + π/2) is the graph of y = cos x shifted π/2 units to the left. There are no other additional constants or coefficients. The graph of y = cos (x + π/2) is shown below.
We know that this curve has a period of 2π, so a cosine function that is shifted 2π in either direction from y = cos (x + π/2) will look identical to this graph.
cos (x + π/2 − 2π) = cos (x − 3π/2)
Try graphing y = cos (x − 3π/2) to check. It looks exactly like the graph of y = cos (x + π/2), so y = cos (x − 3π/2) also describes this graph.
Notice, too, that this graph passes through the origin, which is the case with the parent sine graph. Compare this graph to the graph of y = sin x. This graph is the reflection of y = sin x across the x-axis, with the same period, amplitude, and midline. So, the equation y = −sin x also describes this curve.
The functions
y = cos (x + 5π/2),
y = cos (x + 9π/2),
y = cos (x − 7π/2),
and all others shifted
some multiple of 2π
units horizontally also
describe this graph.

We have found two additional equations to describe the curve, but there are many more. For example, this graph is also the reflection of y = sin x across the y-axis, so the equation y = sin (−x) also describes it.
This graph is also that of y = sin x shifted π units to the left or right, so the equations y = sin (x + π) and y = sin (x − π) each describe this curve as well. In fact, because the cycle repeats endlessly, there are an infinite number of equations that can accurately describe this curve. The same will be true of any given sine or cosine graph, though you’ll generally want to work with the simplest answer.
Again, any function
that is y = −sin x or
y = sin (−x) shifted
some multiple of
2π units is also
represented by this
graph. For example,
the equations
y = −sin (x + 2π) and
y = sin (−x − 8π) each
describe this graph.