Idiot's Guides: Algebra I (2015)
Part III. Variations on the Line
Chapter 9. Special Graphs
In This Chapter
![]()
· Exploring vertical and horizontal lines
· Graphing linear inequalities
· Graphing absolute value inequalities
In this chapter, we’ll investigate vertical and horizontal lines, both of which deviate from the pattern we’ve been focusing on. We’ll also look at some related graphs. We’ll look at the graphs of linear inequalities, which are similar to but not quite the same as linear equations. Although they are not technically linear equations, absolute value equations are related, both in terms of how we solve them and in the appearance of their graphs. We’ll take a look at the graphs of absolute value equations and inequalities as well.
Vertical and Horizontal Lines
We’ve talked about linear functions as relationships that fit the pattern y = mx + b, a variable term and a constant term. We looked at what happened when b, the y-intercept, was equal to 0. When that happened, the line passed right through the origin. One of the things we haven’t looked at is what happens when m, the slope, is equal to 0.
Horizontal Lines
Remember that slope is a measurement of the number of steps a line rises or falls each time it moves one step to the right. Slope is sometimes defined as 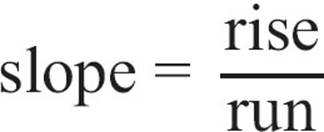 , so a slope of 0 would mean the line doesn’t rise at all, no matter how far it runs. That would mean it’s a horizontal line. Points on a horizontal line all have the same y-coordinate. The points (-4, 5) and (6, 5) both lie on the horizontal line y = 5. You can plug those points into the slope formula.
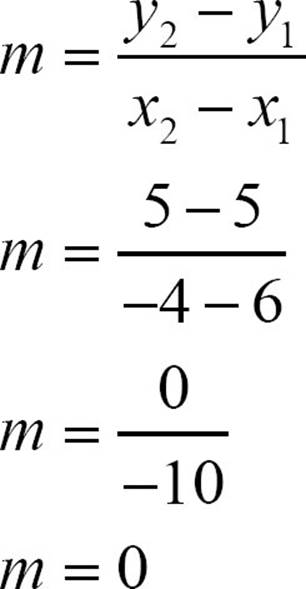
Because m = 0, the equation of the line becomes y = 0x + b or y = b. The equation of a horizontal line with a y-intercept of 5 is y = 5. The equation of a horizontal line with a y-intercept of -3 is y = –3.
![]()
ALGEBRA TRAP
Don’t confuse dividing zero by a non-zero number with dividing by zero. For any non-zero number 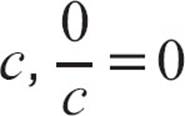 , but
, but ![]() is undefined. Zero divided by a non-zero number is zero, but division by zero is impossible.
is undefined. Zero divided by a non-zero number is zero, but division by zero is impossible.
If you look at the graph of a horizontal line like y = 5, you can see that simple equation actually describes the line very well.
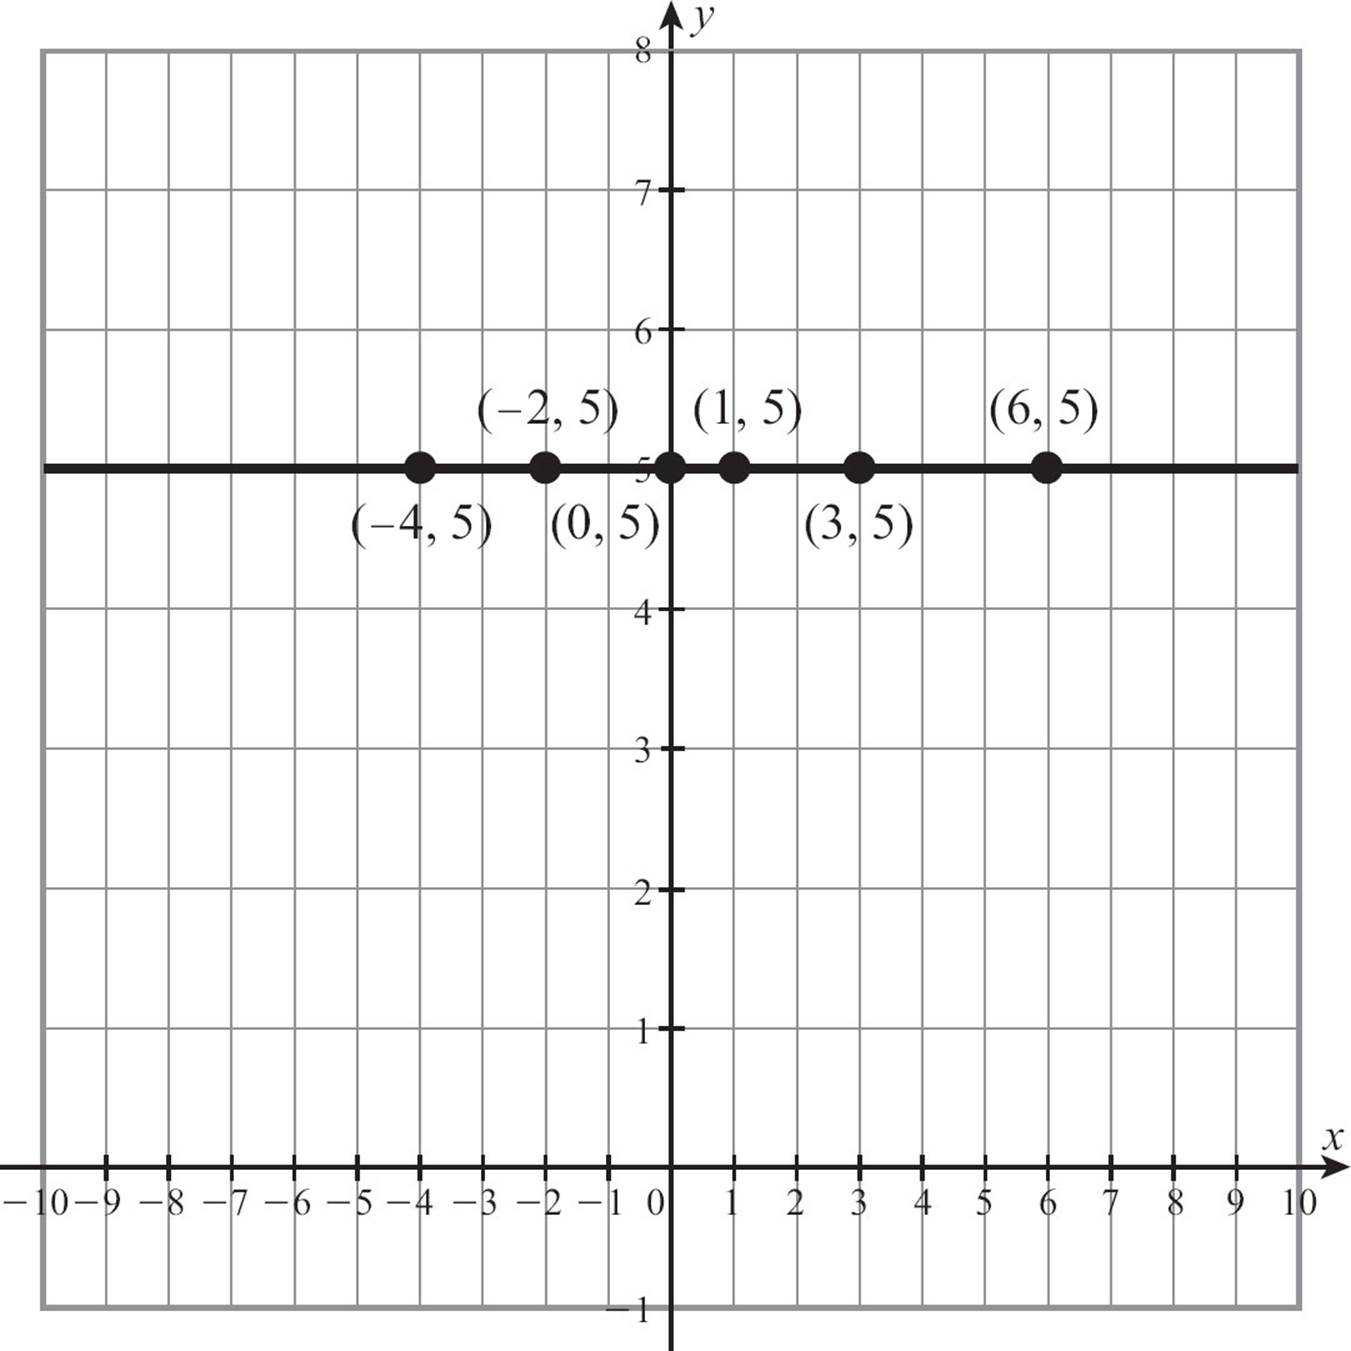
Every point on the line y = 5 has a y-coordinate of 5. Every point on the horizontal line y = –3 has a y-coordinate of -3. That’s enough information to graph the horizontal line.
Vertical Lines
If the equation of a horizontal line is always y = a constant, what does the equation of a vertical line look like? Vertical lines do rise, or fall, depending on your point of view. It’s difficult to say which because they don’t run. Their x-coordinates never change. Because all the points on a vertical line have the same x-coordinate, vertical lines have the form x = a constant, and the constant is the x-coordinate of each point on the line.
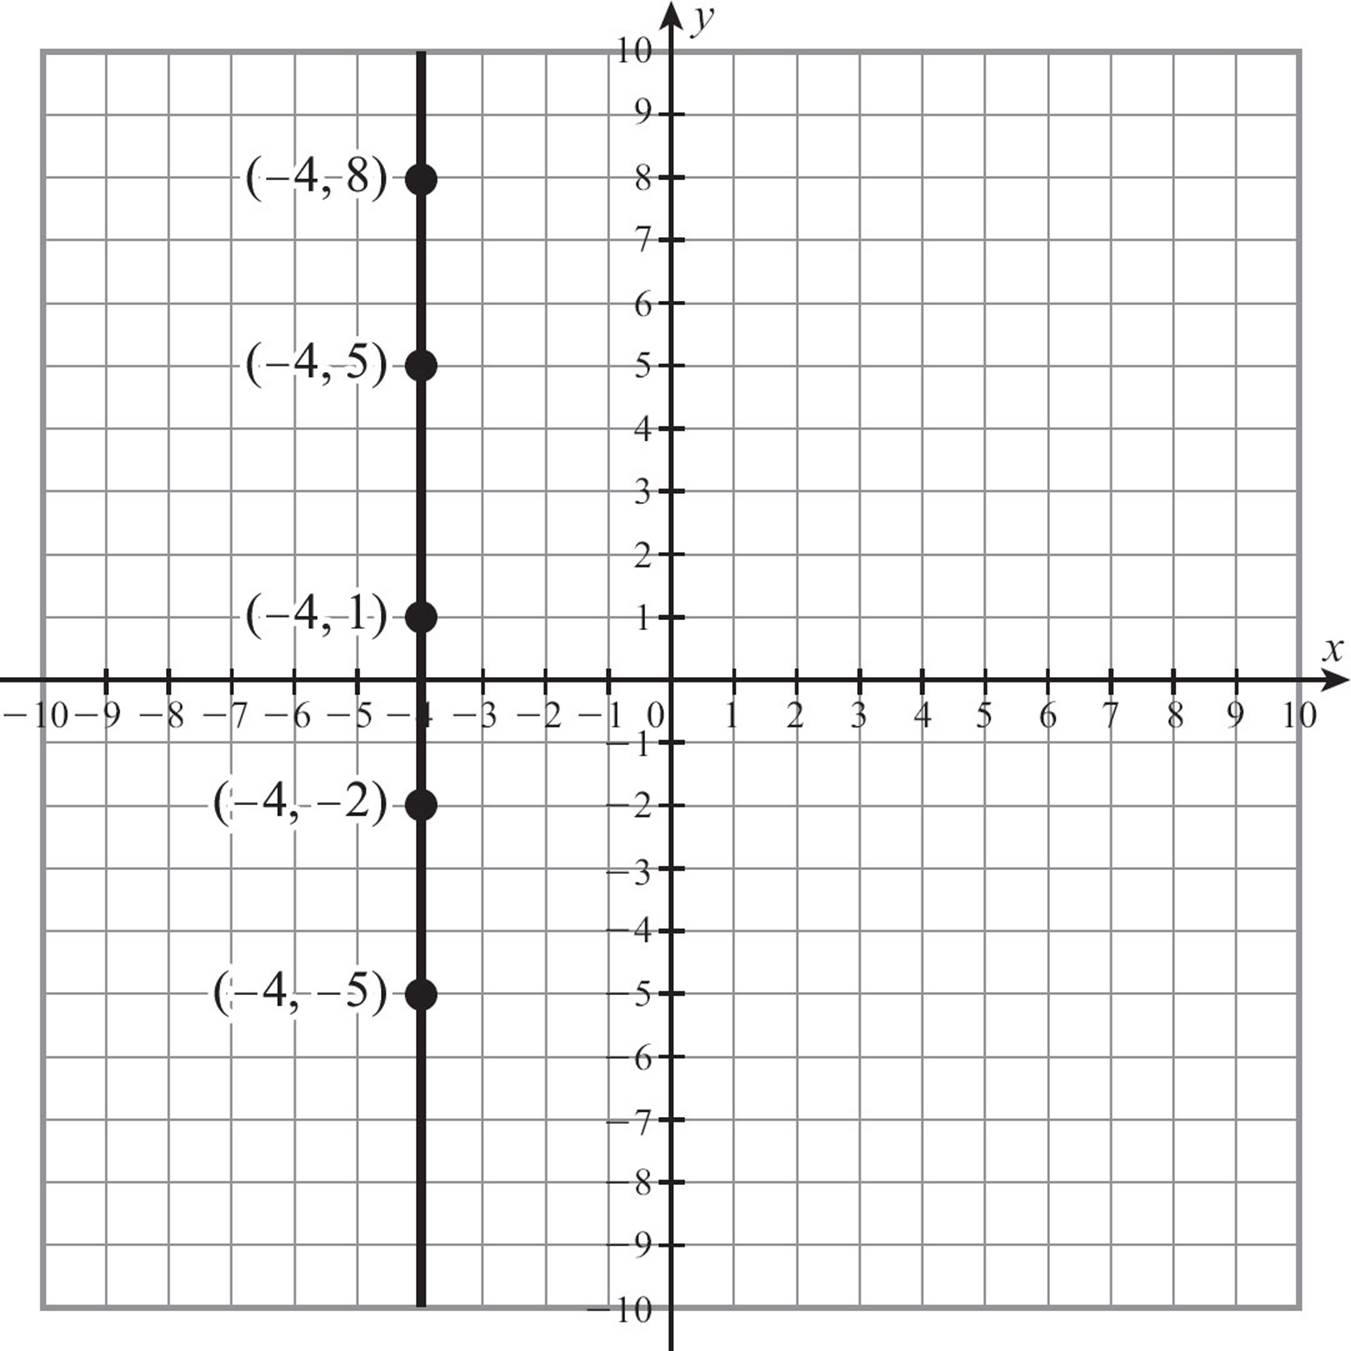
Because the vertical line rises but never runs, something unusual happens when you look at its slope.  but for a vertical line, the run is zero, and division by zero is impossible. Using the point (-4, -5) and (-4, 8), you can plug into the slope formula, but you bump into a problem.
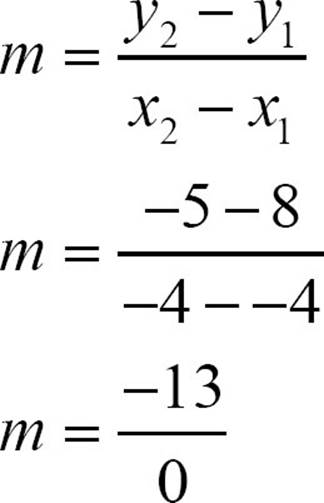
Division by zero is impossible. The expression  is undefined. A vertical line has an undefined slope, but people will often say it has no slope, meaning the same thing.
![]()
CHECK POINT
Identify each equation as the equation of a vertical line, a horizontal line, or an oblique (slanted) line.
1. y = 12
2. x = 5y
3. y = 12 + x
4. x = 7
5. x − 6 = 0
Graph each line.
6. x = −4
7. y = −3
8. x + 4 = 6
9. y + 7 = 4
10. x = 1
After we talked about solving linear equations, we looked at solving linear inequalities and saw that it was very much the same process, with one key addition. When we multiplied or divided both sides by a negative number, the direction of the inequality sign reversed. We needed that additional exploration because the situations we investigate don’t always tell us exactly what things equal. Often real problems talk about “at least” this much or “not more than” that much.
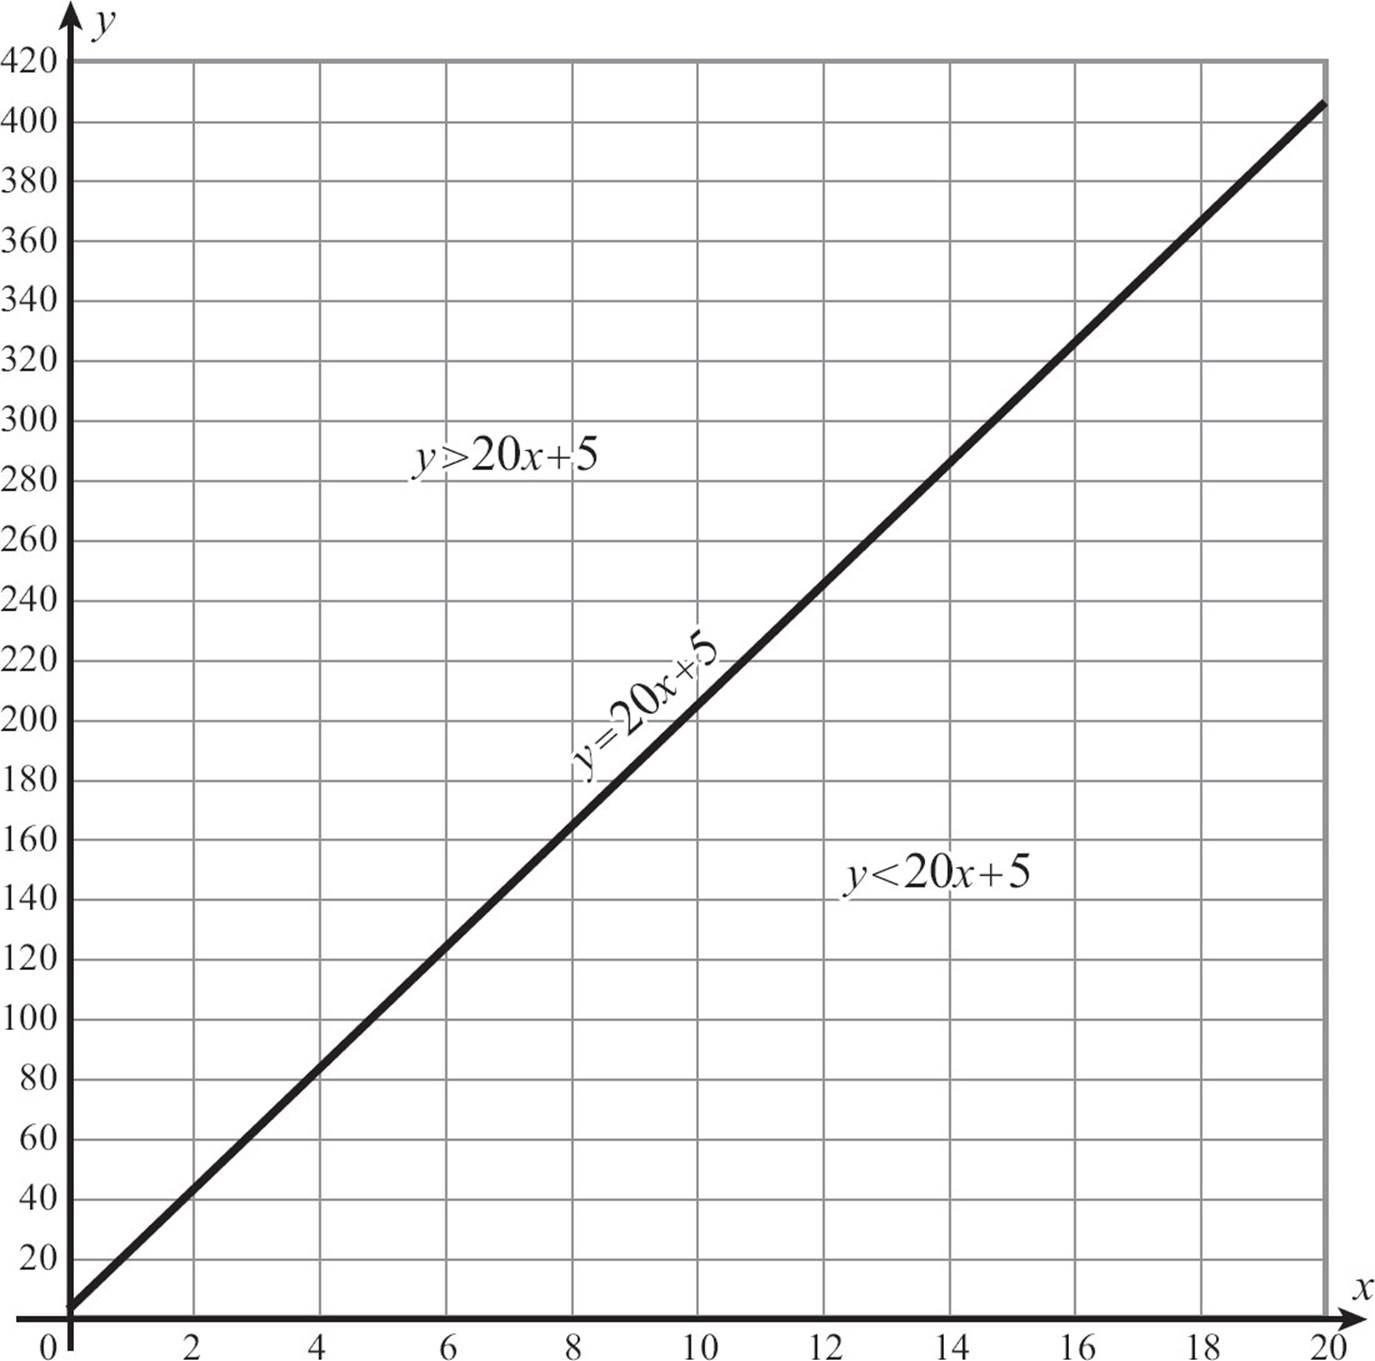
Now that you know how to graph the equation of a linear function, it makes sense to think about what happens when inequalities creep into that graphing process. If you design some t-shirts for your softball team, and order them from a custom printing service, you probably pay a one-time start-up fee plus a cost for each shirt. If the start-up fee is $5 and each shirt is $20, the cost of your order of x shirts would be y = 20x + 5. Generally, however, such services will discount the price for larger orders. If you have enough people on your team, that $20 per shirt price may be reduced, so the total cost of your order is better represented as y ≤ 20x + 5. How do you graph that?
Graphing Linear Inequalities
Just as solving inequalities is very similar to solving equations, graphing inequalities has a lot in common with graphing equations. The graph of an equation like y = 20x + 5 is a picture of all the points whose y-coordinates are exactly equal to 20x + 5. If you want to graph y ≤ 20x + 5, you want those points, but you also want the points whose y-coordinates are smaller than 20x + 5. You could start our graph by drawing the graph of the equation y = 20x + 5, but then you’d also need to show those other points.
![]()
DEFINITION
A linear inequality is a statement that defines a relation (not a function) in which the output is less than, or greater than, or less than or equal to, or greater than or equal to, some expression involving the input value.
When you create the graph of a linear inequality, you actually divide the coordinate plane into three sections: the points on the line, the points above the line, and the points below the line. The points on the line y = 20x + 5 are the points whose y-coordinate is exactly 20x + 5. The points above the line have larger y-values, so they are the points where y > 20x + 5;, and the points below the line are the points whose y-coordinates are smaller than 20x + 5, so they are the points where y < 20x + 5.
Graphing a linear inequality is similar to graphing linear equations but with two additional considerations. You start by graphing the line as though you were graphing an equation. The first additional element comes up as you go to draw the line. If the inequality is a “less than or equal to” inequality or a “greater than or equal to” inequality, your solution should include the points of the line, so draw a solid line. If the inequality doesn’t include the “or equal to” part, you don’t want to include the line in your solution, but you need to know where it is, because it serves as a boundary between the points you want and the points you don’t want. So go ahead and draw it in, but use a dotted line.
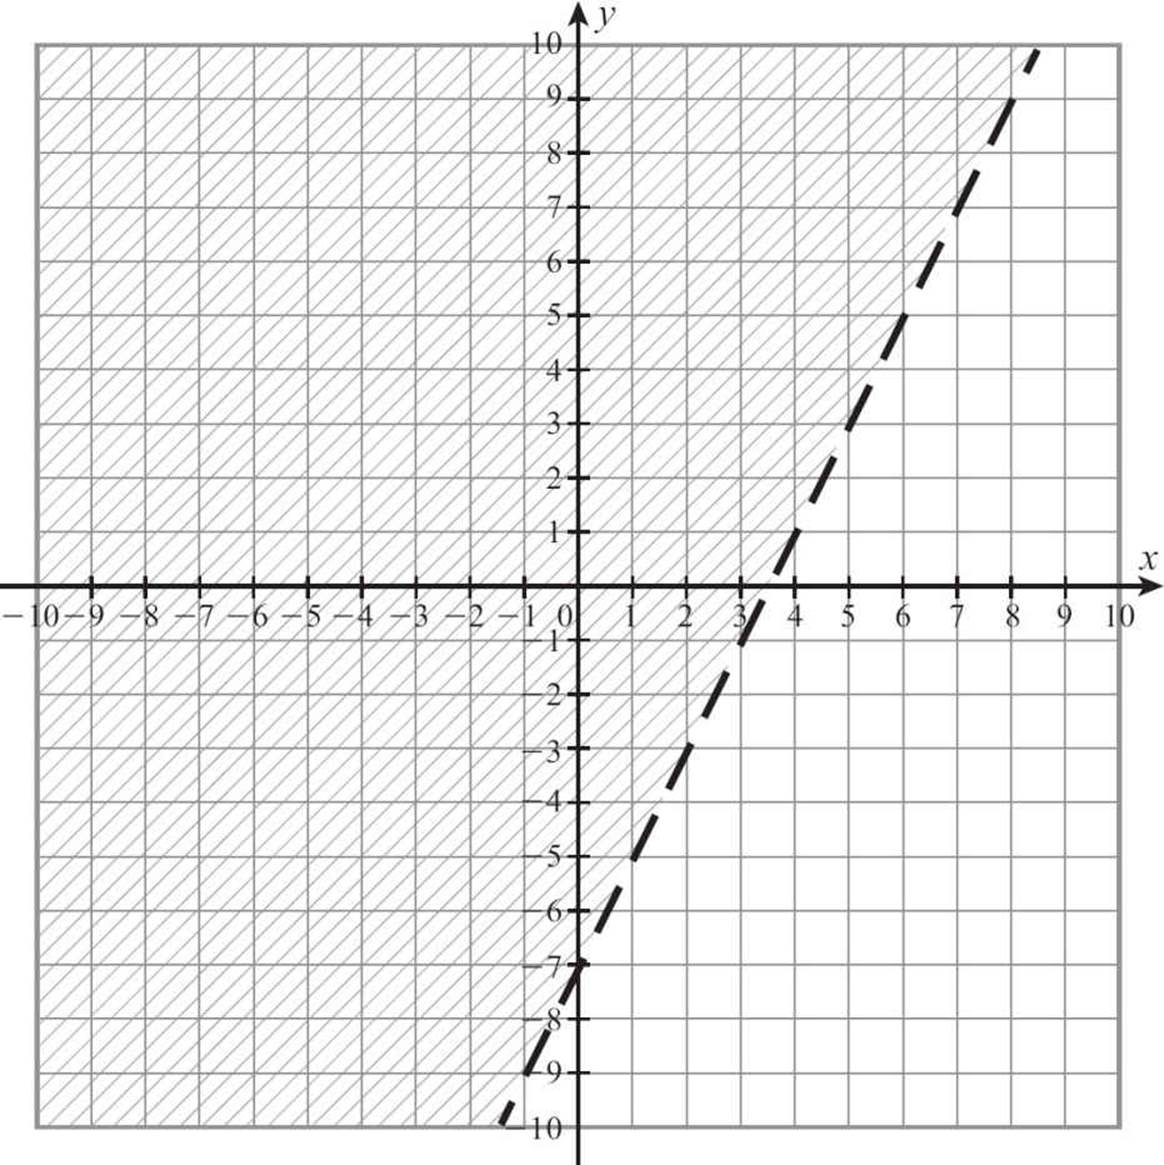
To draw the graph of y > 2x − 7, start from the y-intercept of -7, count out the slope of up 2, 1 right, a few times, placing dots. You’ll shade some points in a moment, but because you have y > 2x − 7, not y ≥ 2x − 7, you don’t want to include the points on the line. Draw a dotted line, not a solid line, to signal that you don’t mean to include this line.
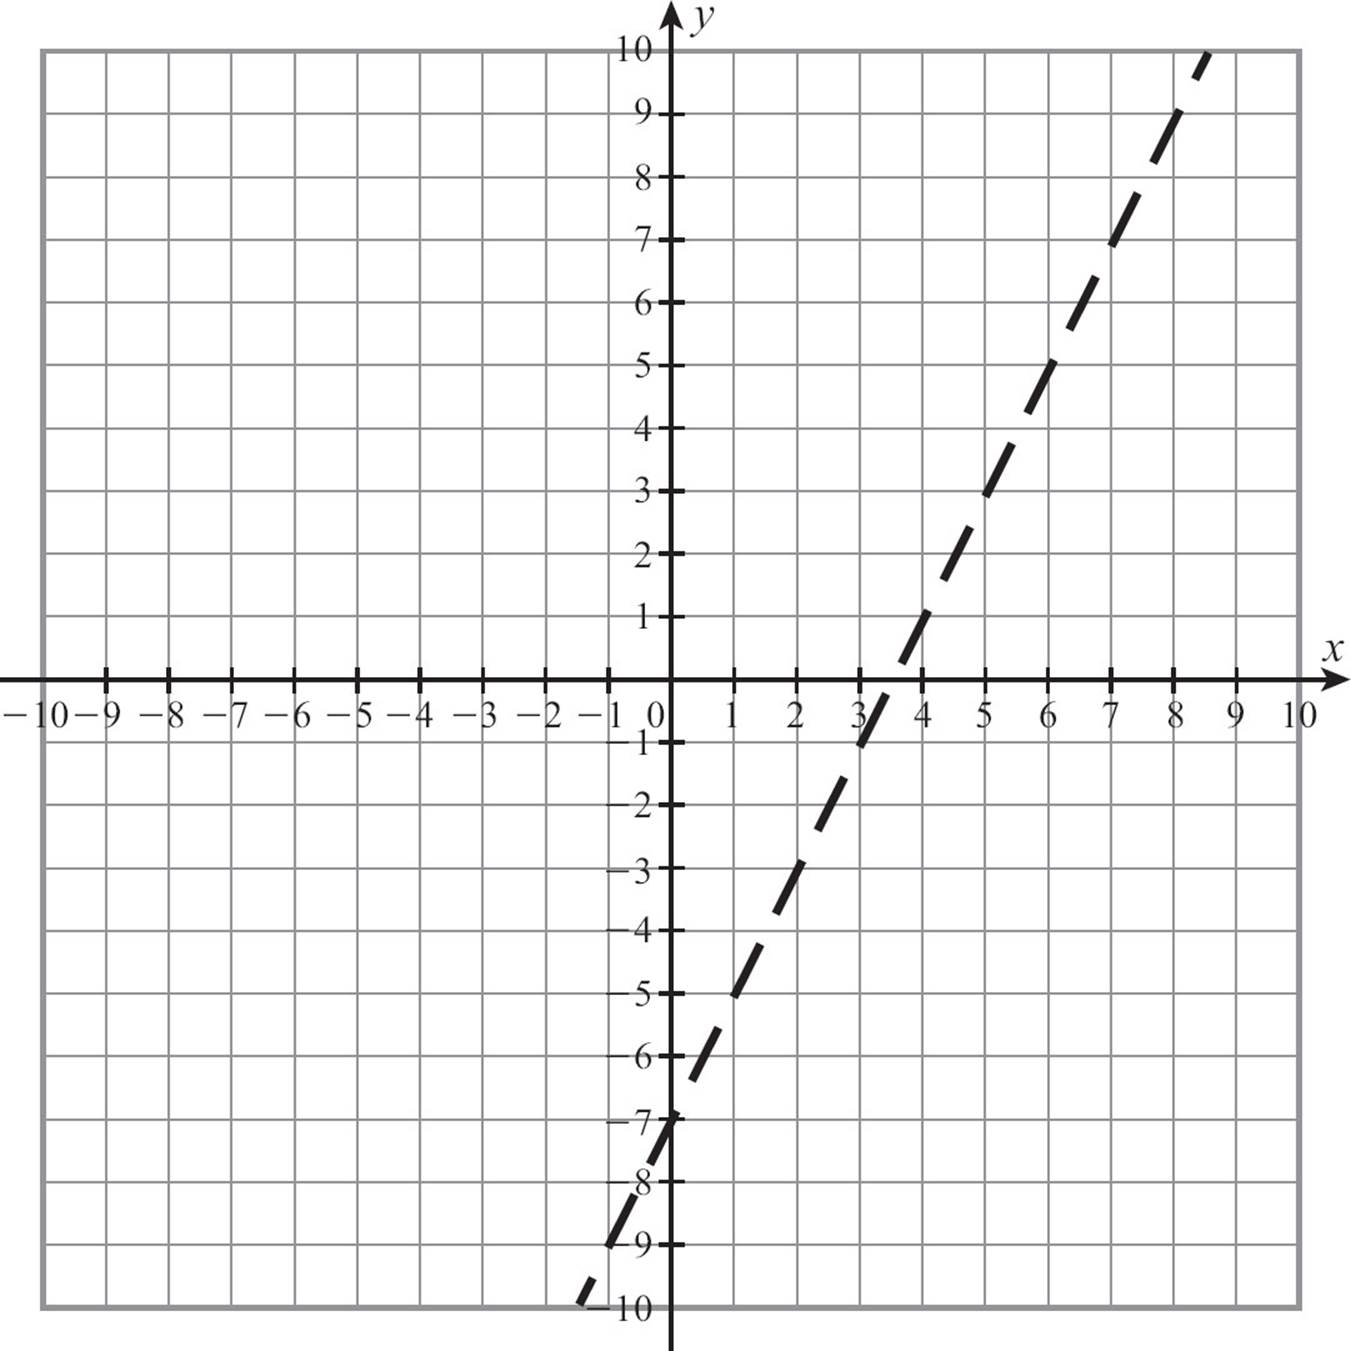
Once you know where to find the points for which the y-coordinate is exactly 7 less than twice the x-coordinate, you need to find and shade the points for which the y-coordinate is more than 2x − 7. When the inequality is in slope-intercept form, with the y isolated, you can say that the points where y is greater are above the line. If you can’t put the inequality in that form, don’t guess at where to shade. Pick a point—the origin is often an easy one to choose, as long as it is not on your line—and plug the x- and y- coordinates of that point into the inequality.
y > 2x − 7
0 > 2 · 0 − 7
0 > − 7
If the result you get is true, the point you chose is in the region you need to shade. Substituting 0 for x and 0 for y gave you a true statement, so the origin (0, 0) is in the shaded region. Shade that side of the line. If the statement had come out false, you would shade the opposite side of the line.
Follow these steps to graph a linear inequality.
1. Isolate y.
2. Graph the line. Draw the line very lightly.
3. If the inequality is an “or equal to” make the line a solid line. If not, use a dotted line.
4. If the inequality begins with y ≥ or y >, you will shade all the points above the line. If it begins with y ≤ or y <, you will shade all the points below the line.
5. To be certain that you’re shading the correct area, choose a point from the region you think should be shaded, and substitute its coordinates for x and y in the original inequality. If the result is a true statement, that is the correct region to shade.
![]()
CHECK POINT
Graph each inequality.
11. y ≤ 2x − 1
12. 
13. y < −3x + 5
14. 
15. x < 3
16. y − 5 ≥ 0
17. x + y ≤ 8
18. 2x − y > −6
19. 4x − 3y < 12
20. x ≤ 2x + 8
Graphing Absolute Value Inequalities
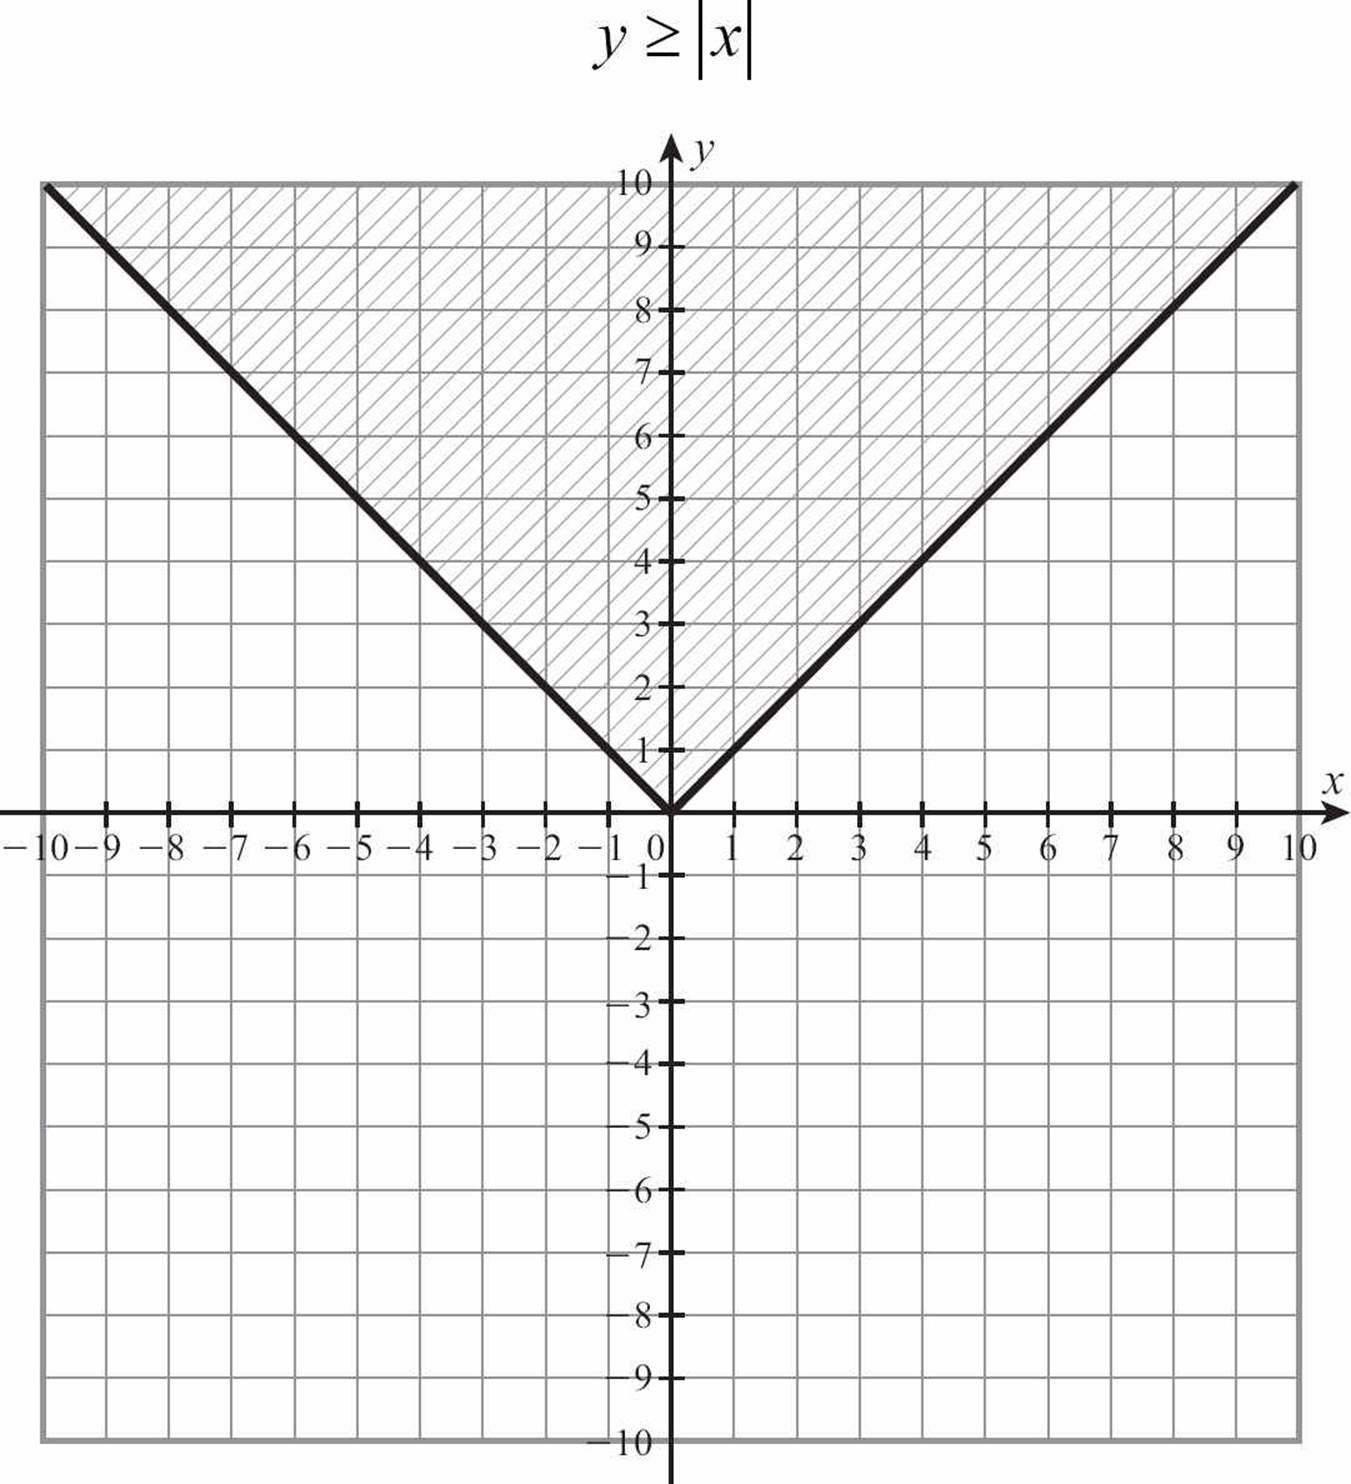
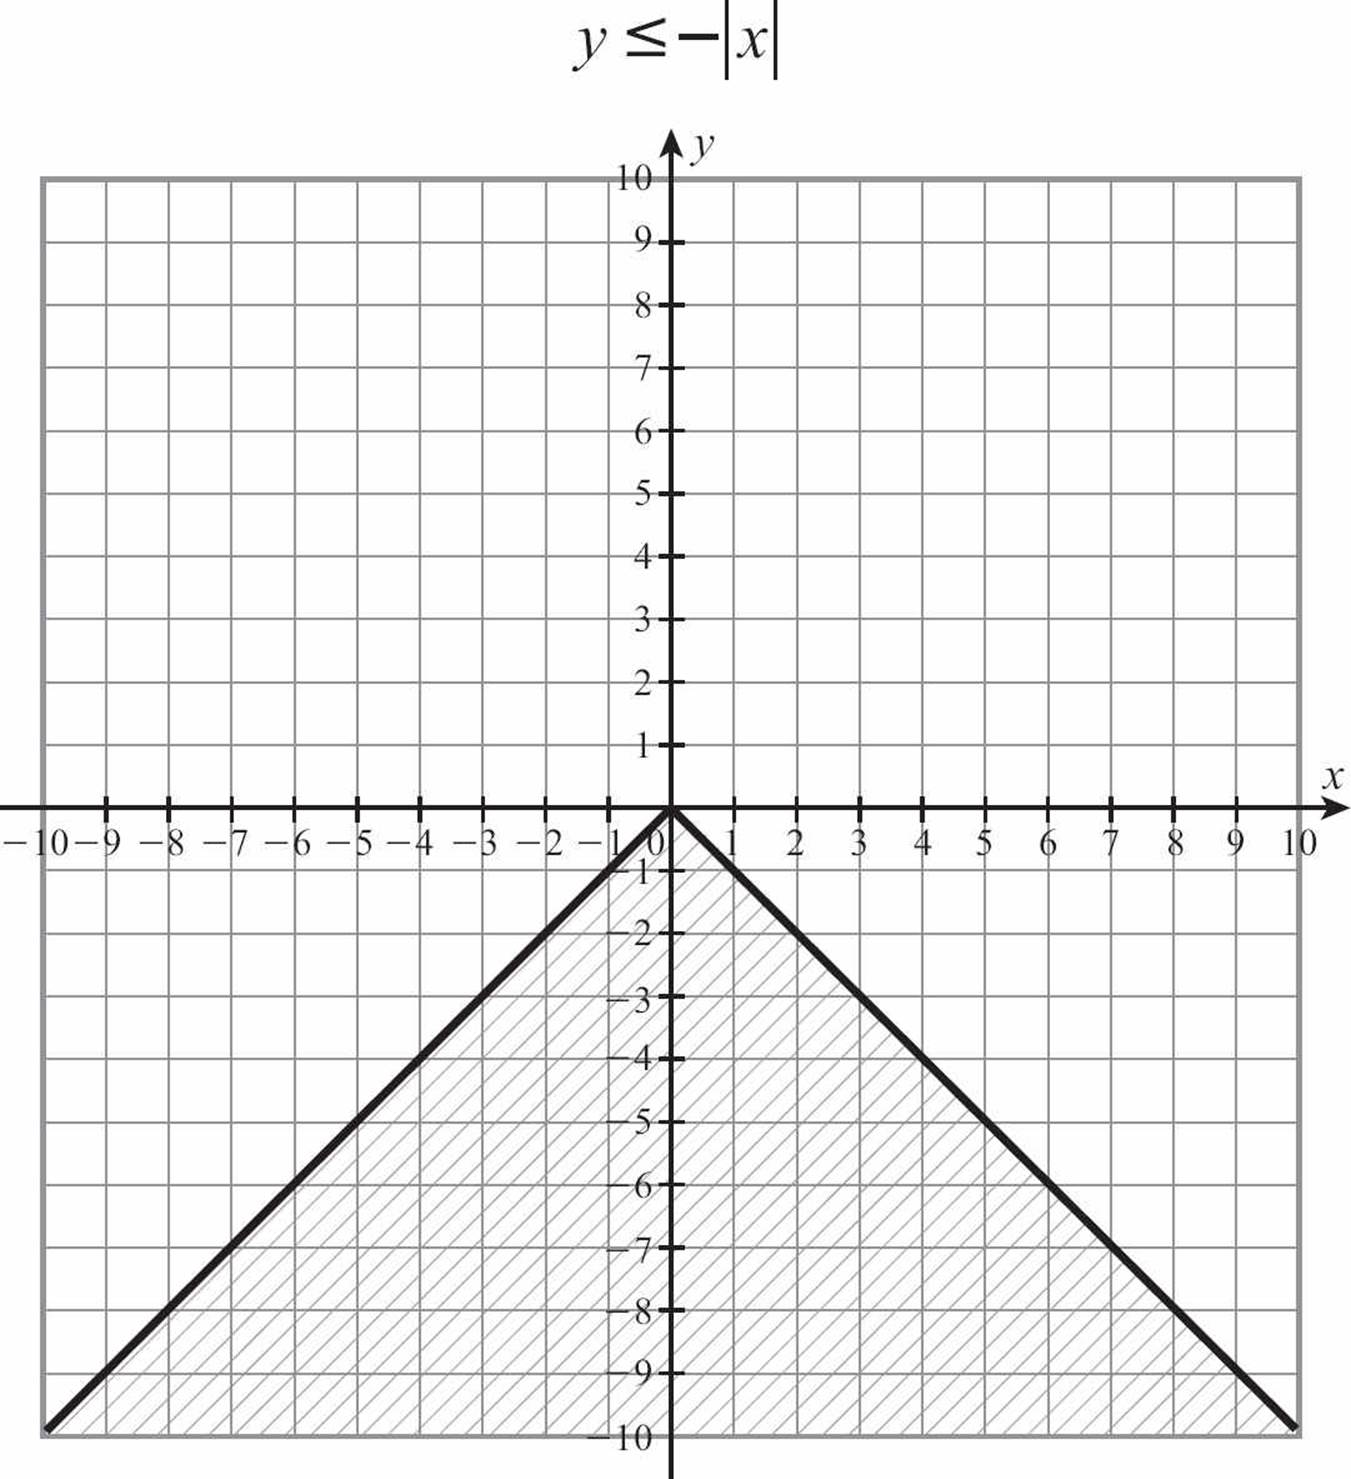
Just as you can graph a linear inequality by adding a few steps to the process for graphing a linear equation, you can graph an absolute value inequality with just a few more steps than it takes to graph an absolute value equation. Whether you choose to graph an absolute value equation by a table of values or you use some shortcuts to produce the graph, creating that V-shaped graph is the place to start when you’re called upon to graph an absolute value inequality.
Once you have the basic graph in place, the remaining steps are the same ones you would take with linear inequalities. First, you must examine the inequality sign to see if it includes an “or equal to.” If your inequality sign is ≥ or ≤, you’ll draw the V-shaped absolute value graph with a solid line. If the inequality sign is > or <, you’ll use a broken or dotted line to show that you don’t want to include the points on the V.
The last consideration is where to shade, and this is when graphing absolute value inequalities gets a little bit tougher than graphing linear inequalities. The rule is the same. If you want the points whose y-coordinates are smaller, shade down. If you want the points with larger y-coordinates, shade up. The shape of the absolute value graph, however, can make the choice confusing at times.
![]()
THINK ABOUT IT
A line drawn in the coordinate plane creates two half-planes, but that name is somewhat misleading. Each region goes on forever. There’s no edge to the paper, or corner to page to define the boundaries of the sections. You really can’t take half of forever.
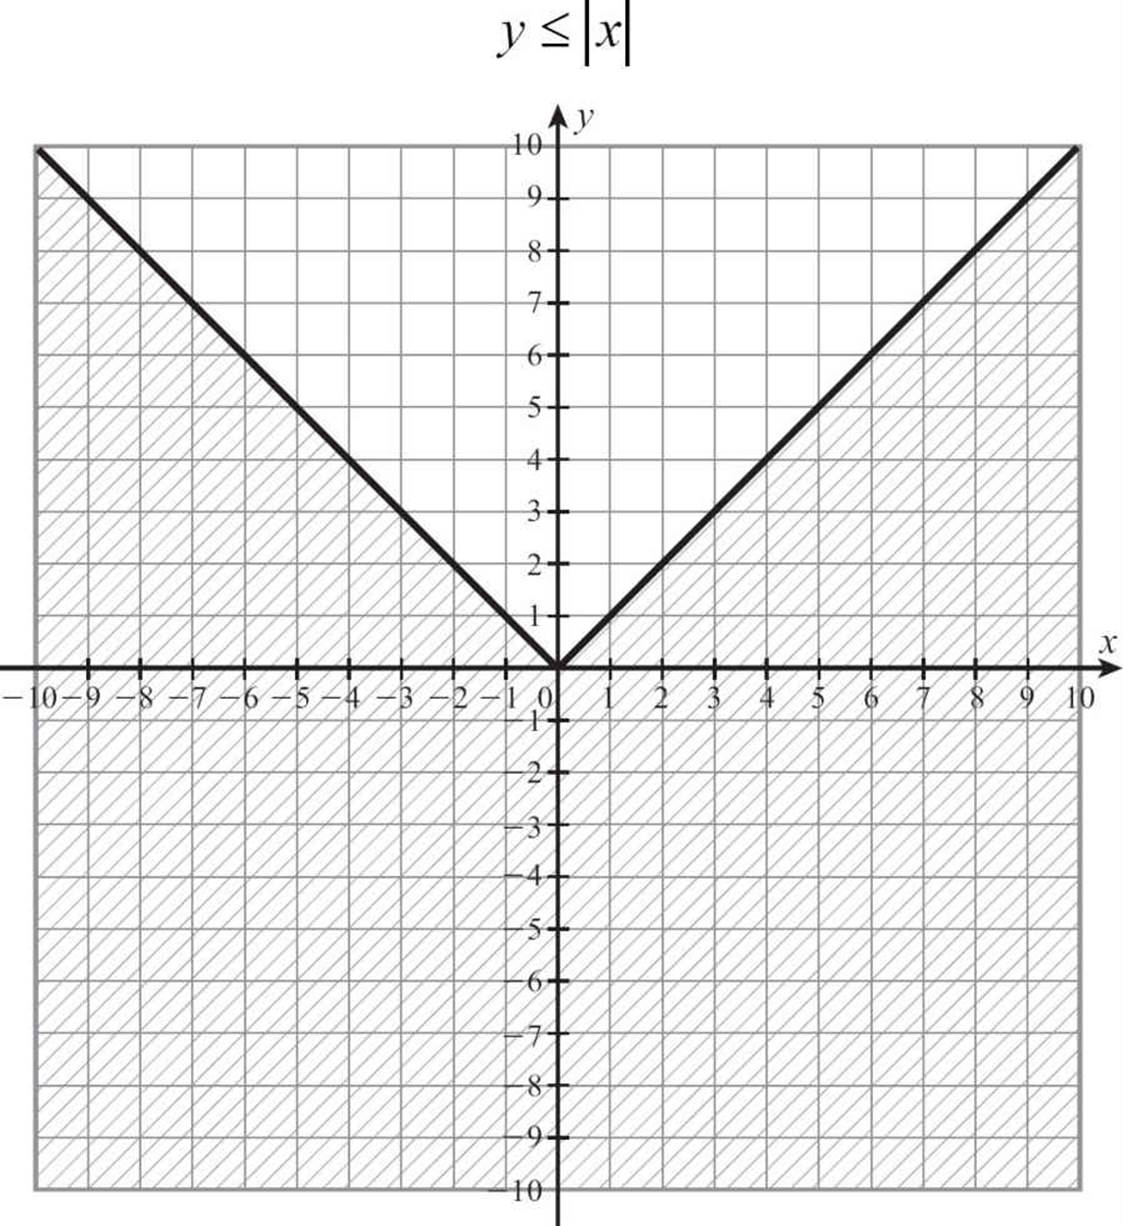
A line clearly divides the coordinate plane. There are points above the line, points on the line, and points below the line. The same is actually true of an absolute value graph. There are points on the V, points above the V and points below the V, but we don’t really think in terms of above and below a V. We might think about inside and outside the V, as if it were a cup.
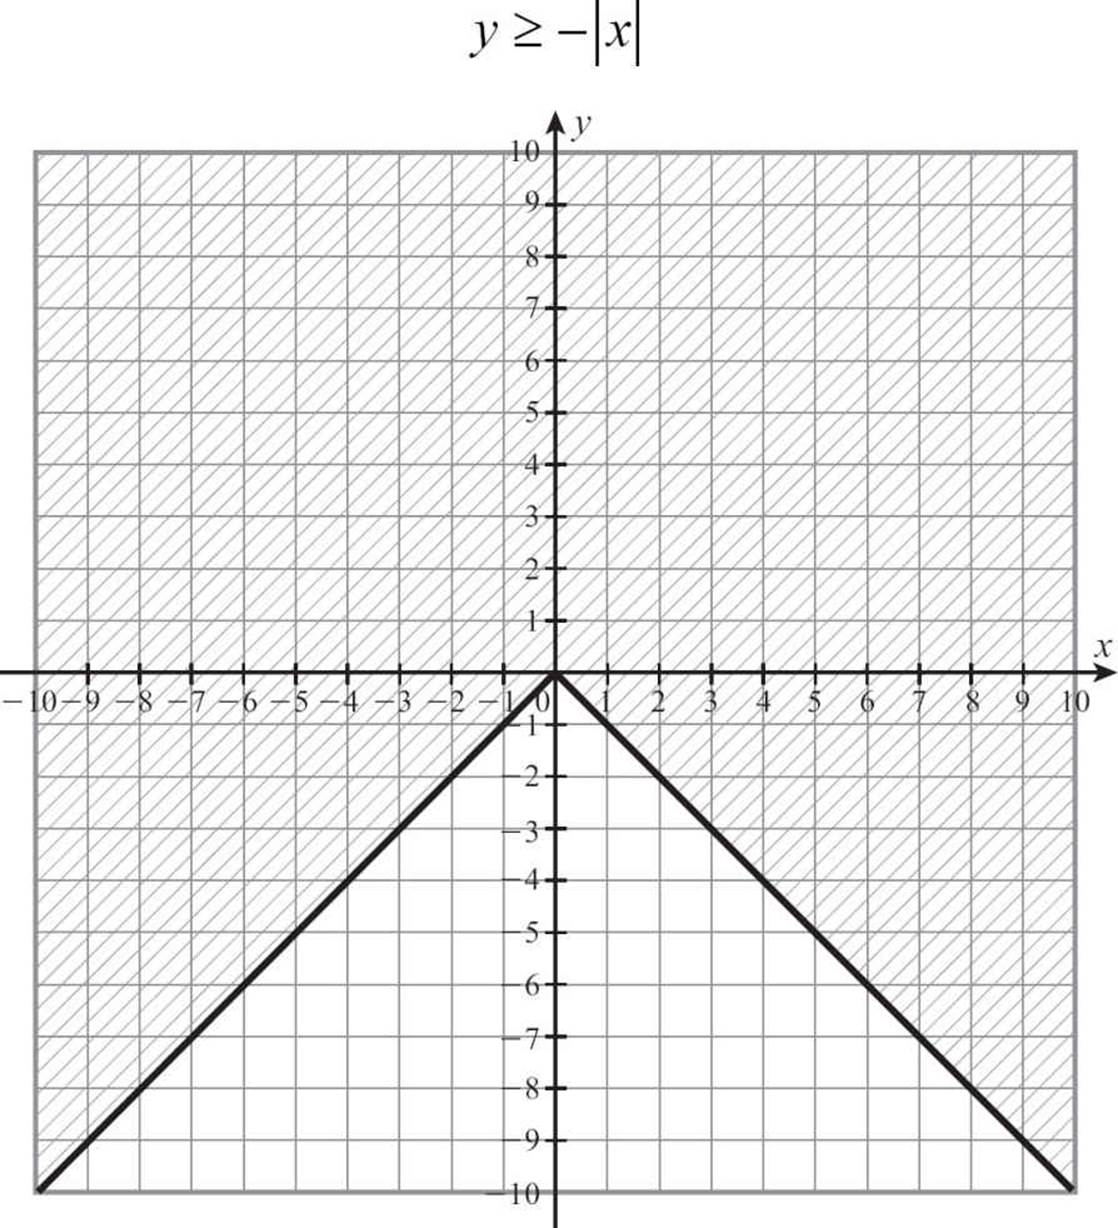
The problem with that image is that if the V is in its upright position, the points with greater y-coordinates are inside the V, but if the V is inverted, the points with smaller y-coordinates are inside. That could get too confusing.
The better plan is to plot the absolute value equation, using a solid or dotted line as appropriate. If the inequality says that y is greater than the expression, place your pencil on the V and pull the shading up. If y is less than the absolute value expression, place your pencil on the V and pull down.
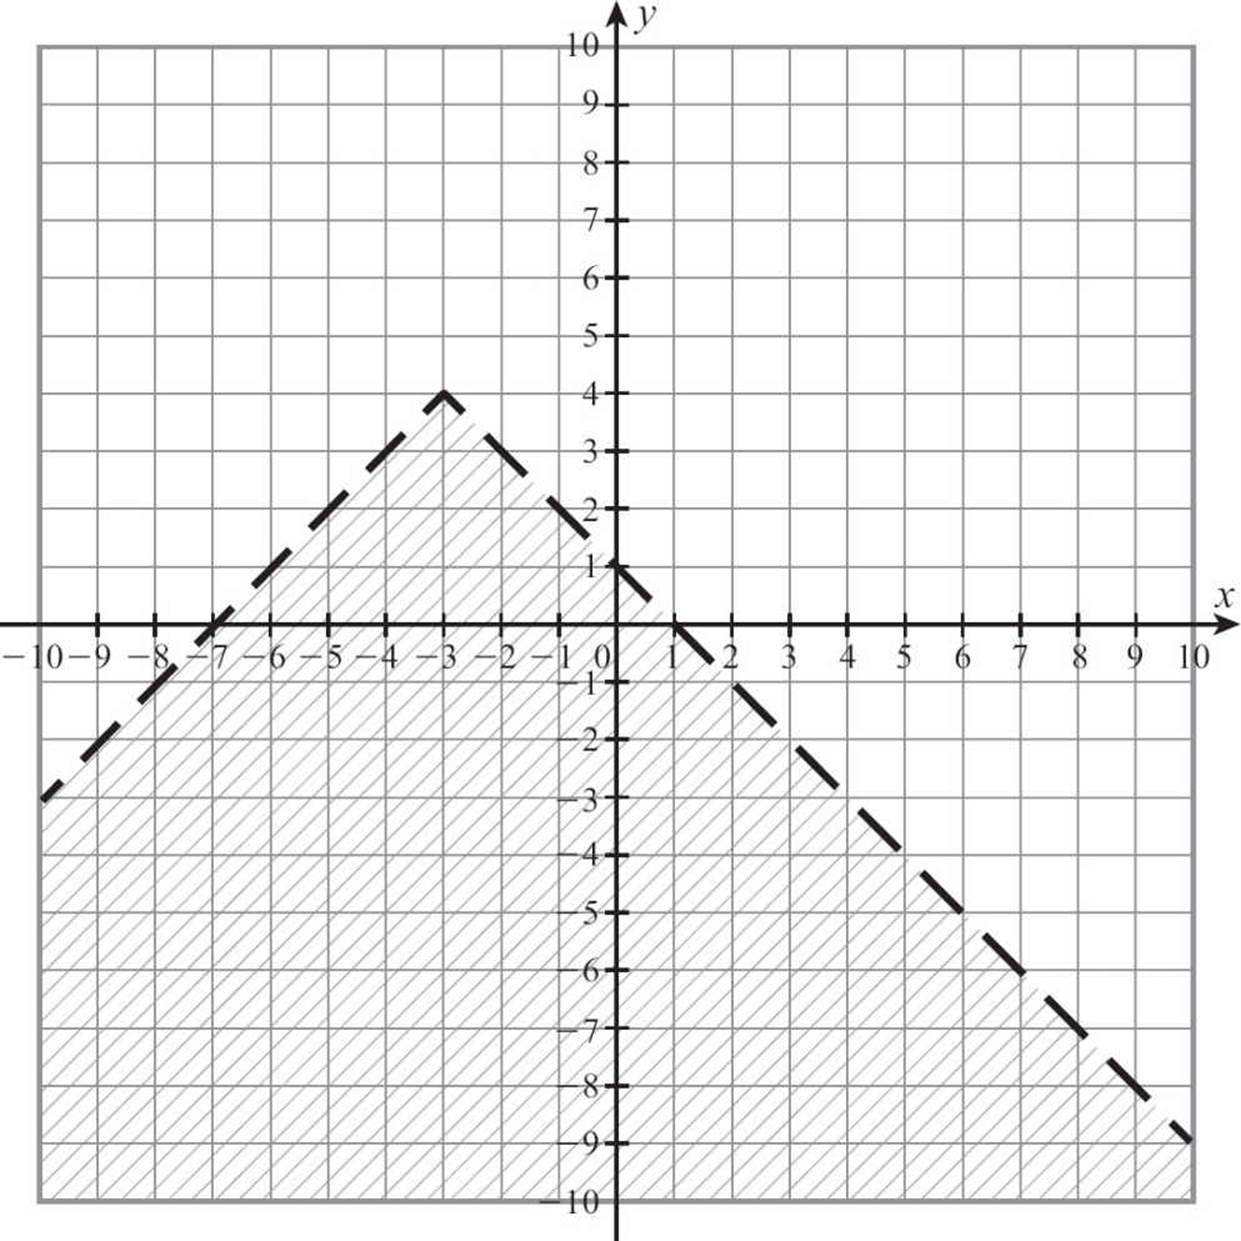
Let’s look at the process by graphing the absolute value inequality y < 4 –|x + 3|.
1. Start by putting the inequality in the most convenient form. y < 4 − |x + 3| will be easier to graph if you write it as y < − |x + 3| + 4.
2. Inspect the inequality for clues to the graph. The negative sign in front of the absolute value sign tells you the graph will open down, and the absence of any coefficient on x or multiplier in front says the slopes will be 1 and –1. The x + 3 tells you the graph will move 3 units left and the 4 added on the end moves the graph up 4 units.
3. Make a table of values if you don’t feel you have enough information.
4. Sketch the graph.
5. Check the inequality sign. There is no “or equal to” in y < −|x + 3| + 4, so use a dotted line to draw the V.
6. Check the direction of the inequality. This one is “less than,” so you will shade down.
Here’s your graph.
![]()
CHECK POINT
Graph each absolute value inequality.
21. y < |x − 7|
22. y ≥ |x + 3|
23. y > |x| − 4
24. y ≤ |x| + 1
25. 
26. y ≥ |2x| − 3
27. 
28. 
29. y ≥ −2|x| + 5
30. y > −3|x + 4| + 5
The Least You Need to Know
· Horizontal lines have a slope of O. The equation of a horizontal line is y = a constant.
· Vertical lines have an undefined slope. The equation of a vertical line is x = a constant.
· To graph a linear inequality, graph the line using a solid line if the inequality is ≤ or ≥, and a dotted line if the sign is < or >. Shade up if y is greater than the expression. Shade down if y is less than the expression.
· To graph an absolute value inequality, graph the absolute value equation using a solid line if the inequality is ≤ or ≥, and a dotted line if the sign is < or >. Shade up if y is greater than the expression. Shade down if y is less than the expression.