Idiot's Guides: Algebra I (2015)
Part V. Radical, Quadratic, and Rational Functions
Chapter 16. Quadratic Functions
In This Chapter
![]()
· Graphing quadratic functions by building a table of values
· Using clues in the equation to graph parabolas quickly
· Graphing quadratic inequalities
· Finding the equation of a parabola from its graph
· Using quadratic functions to solve vertical motion problems
Have you ever seen something about to fall and wondered if you have enough time to catch it before it hits the ground? Have you ever tossed a ball in the air and caught it as it came down? Quadratic functions can be used to describe those situations.
The motion of objects dropped or thrown is just one situation that can be described by quadratic functions. In the previous chapter, we learned a variety of ways to solve equations in the form ax2 + bx + c = 0. In this chapter, we’ll look at functions of the form f (x) = ax2 + bx + c or y = ax2 + bx + c. We’ll investigate quick ways to graph them, and how to find the equation that matches a graph. Once we have those skills, we can return to vertical motion problems and gather some information about those dropped and thrown objects.
Graphing Quadratic Functions
A picture, it is said, is worth a thousand words, and when it comes to functions, that may well be true. You can quickly learn a lot by looking at the graph of a quadratic function. Let’s start by looking at the simplest possible quadratic function, y = x2, and make a table of values. The result is a picture of the characteristic shape of quadratic graphs. The graph of a quadratic function will always have a cup shape known as a parabola.
![]()
DEFINITION
A parabola is a cup-shaped graph characteristic of quadratic functions. Technically, it is defined as a set of points each of which is equidistant from a predetermined point and line. This gives a very specific shape to the cup.
Here’s the table of values for y = x2.
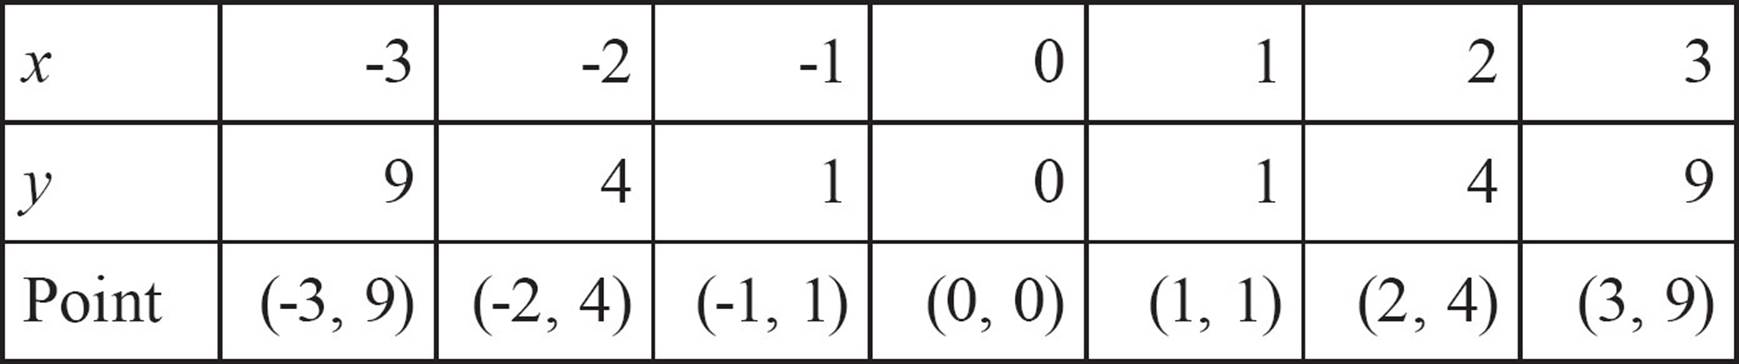
And when you plot those points and connect them, here’s the graph of y = x2.
The parabola is a symmetric cup-shaped graph. The turning point of the parabola is called the vertex. In this example, the vertex is the origin, (0, 0). A vertical line passing through that vertex is the axis of symmetry. Every point on the parabola has a reflection on the parabola. Imagine that the axis of symmetry is a mirror, and a point on the parabola like (2, 4) has a mirror image, (-2, 4). If you were to fold the graph along the y-axis, the two sides of the parabola would match each other perfectly.
![]()
DEFINITION
The vertex of a parabola is the turning point of the graph. The axis of symmetry is an imaginary line passing through the vertex. The two sides of the parabola are reflections of each other across the axis of symmetry.
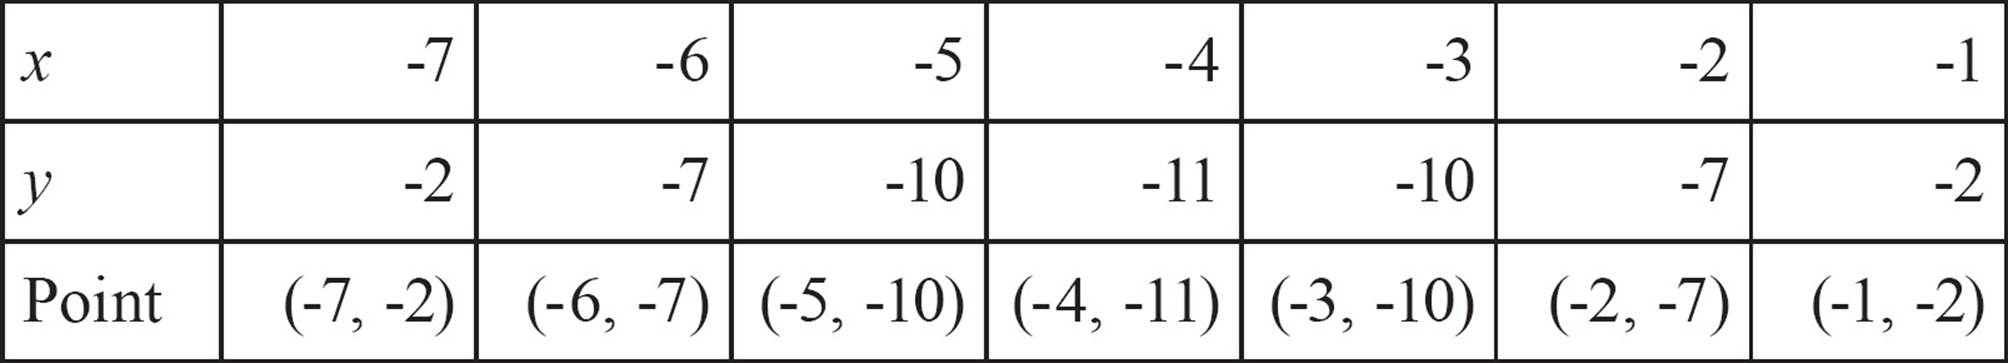
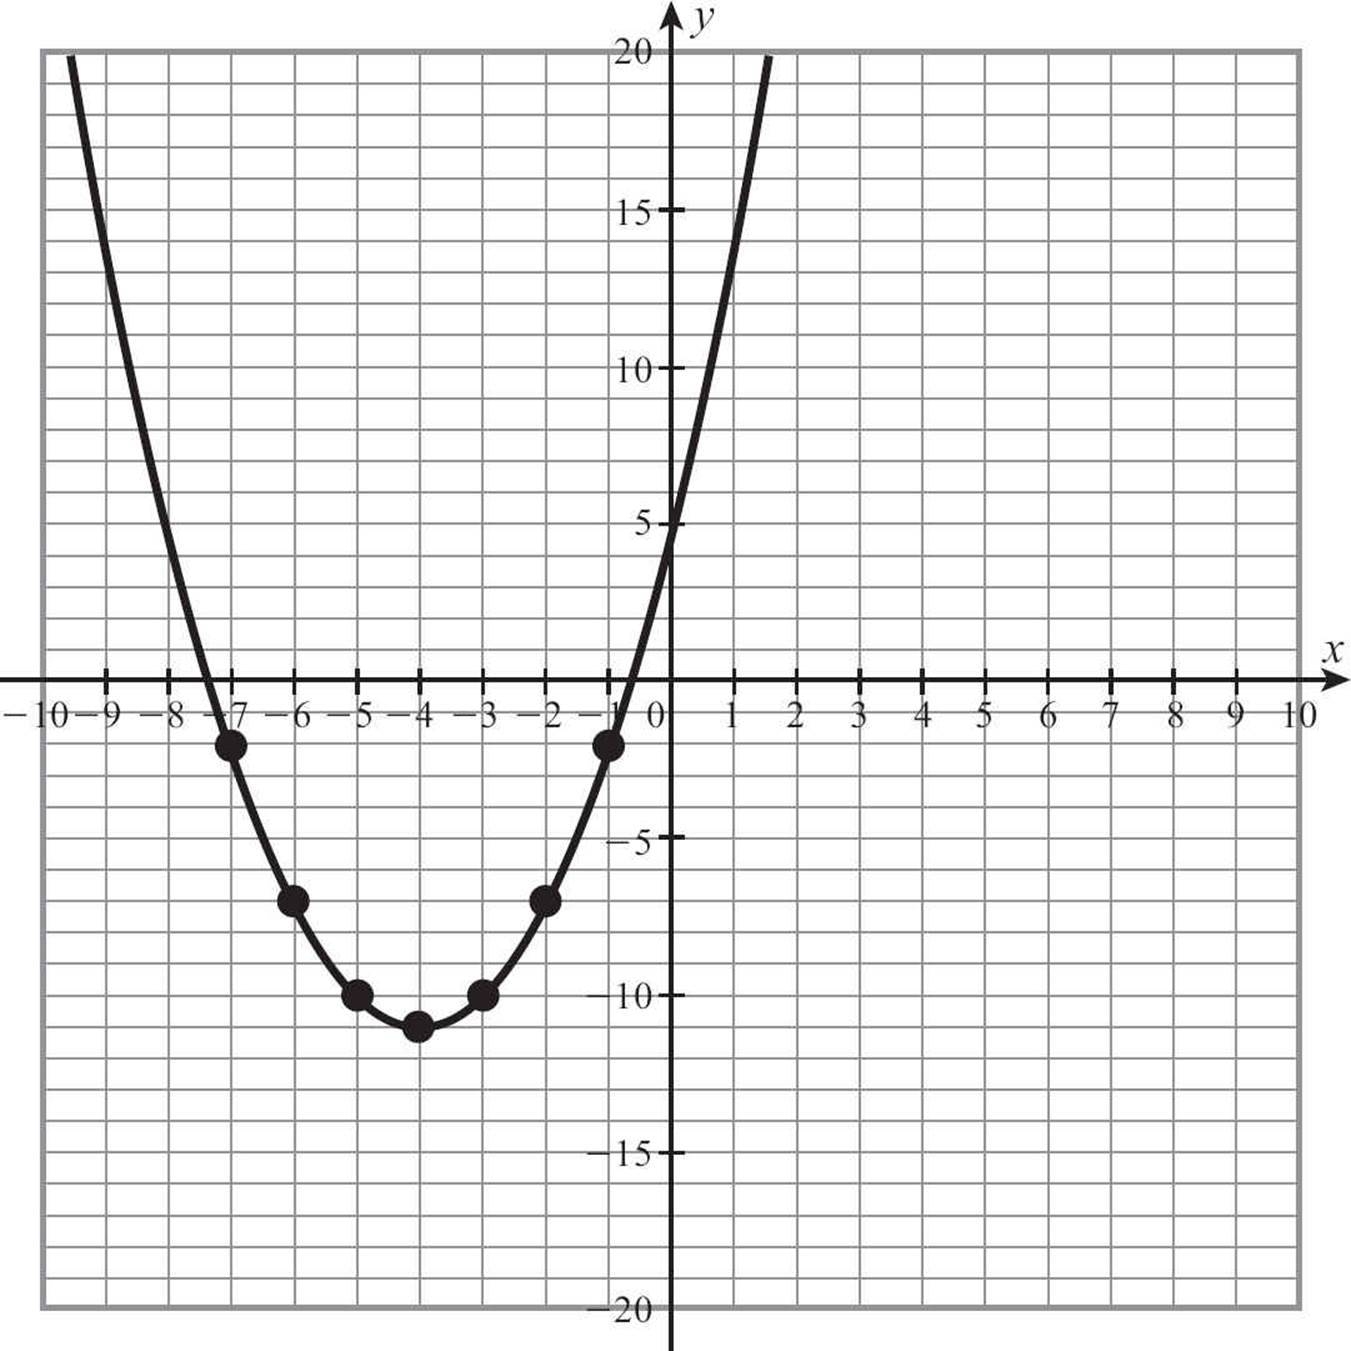
Here’s a table of values and graph for another quadratic function, the function y = x2 + 8x + 5.
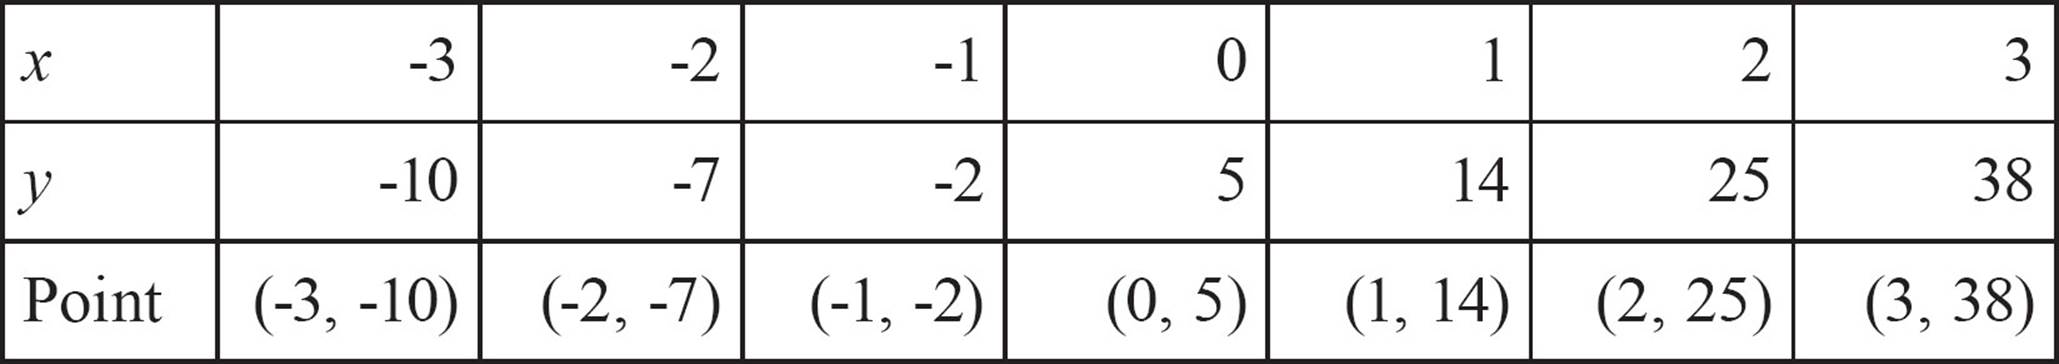
This graph doesn’t appear to have that parabola shape. It looks like a line with a little bit of a bend in it. Why isn’t it a parabola?
The answer is simple. It is a parabola, but the cup shape has moved and is “off-screen” at the moment. Here’s a different view that might make things clearer. This one shows the parabola y = x2 as well as y = x2 + 8x + 5.
The values for x in the table for y = x2 + 8x + 5 were all on the same side of the parabola, so you can’t see the graph turn and form the cup-shape. That could be a problem, so we need to be smarter about making our table.
Vertex and Table of Values
To avoid graphing parabolas that don’t look like parabolas, the table of values must include points on both sides of the vertex. To do that, you need to know, before you start graphing, where the vertex is.
The parabola defined by the equation y = ax2 + bx + c has an axis of symmetry that is a vertical line passing right through the vertex. The equation of that vertical line is  . For the function we graphed earlier, y = x2 + 8x + 5, a= 1 and b = 8, so the axis of symmetry is the vertical line
  or x = −4. The vertex is on that vertical line, so the turning point has an x-coordinate of -4.
![]()
TIP
If the quadratic equation does not have an x-term, the axis of symmetry is the line x = 0, the y-axis, because the value of b in  is zero.
To be sure that you see the cup-shape you expect for a parabola, you need to choose some x-values less than -4 and some greater. You could choose -5, -6, and -7 for the points less than -4 and -3, -2, and -1 for the greater points. If you build a table with those values, you’ll see the graph turn.
If you had started out with these values, your first look at the graph of y = x2 + 8x + 5 would have looked like this.
![]()
TIP
The parabola is not made up of lines. It’s a curve. After you plot points, don’t try to connect the dots with straight lines. Sketch the curve through the points smoothly. It may help to sketch the curve at the vertex first, then extend up (or down) on both sides.
It may seem odd to choose only negative values for x. When we graphed lines, we usually chose both positive and negative values. The nature of the graph of a quadratic function means that it’s more important to create a graph that shows the interesting parts of the graph, especially the vertex.
To graph a quadratic function of the form y = ax2 + bx + c,
1. Find the equation of the axis of symmetry using 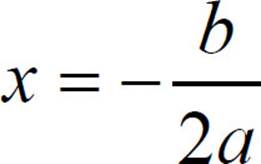 . This tells you the x-coordinate of the vertex.
2. Choose a few x-values less than the x-coordinate of the vertex, and a few greater than that coordinate.
3. Build a table of values, with the values you’ve chosen, including the vertex.
4. Plot the points and connect them with a smooth curve.
![]()
TIP
One principal characteristic of the parabola is that it is symmetric. Every point, except the vertex, has a mirror image on the other side of the axis of symmetry. When you plot your points, expect to see this symmetry. If you don’t, it may be time to check your table of values for errors in arithmetic.
Vertex and Intercepts
Solving a quadratic equation can also help you get an appropriate graph of a quadratic function. If you want to graph quadratic functions of the form y = ax2 + bx + c, you can replace y with 0, giving you the quadratic equation 0 = ax2 + bx + c, which you know how to solve. Solving it will result in two values for x, each of which pairs up with the 0 you put in for y, to give you two points on the graph.
![]()
TIP
Finding the x-intercepts by solving the quadratic equation is helpful for getting a graph quickly. If the quadratic equation has only one solution, however, it will only have one x-intercept because its vertex just touches the x-axis. If it has no solution, it will float above or below the x-axis and never cross it, so there will be no x-intercepts. In either of those situations, you’ll need to create a table of values.
Specifically, those two points, because their y-coordinate is 0, are the x-intercepts of the graph. You’ll have (in most cases) two points on the x-axis that you know the graph will pass through. If you also find the vertex, and find the y-intercept by substituting 0 for x, you may be able to graph the function without a table of values. Let’s look at an example.
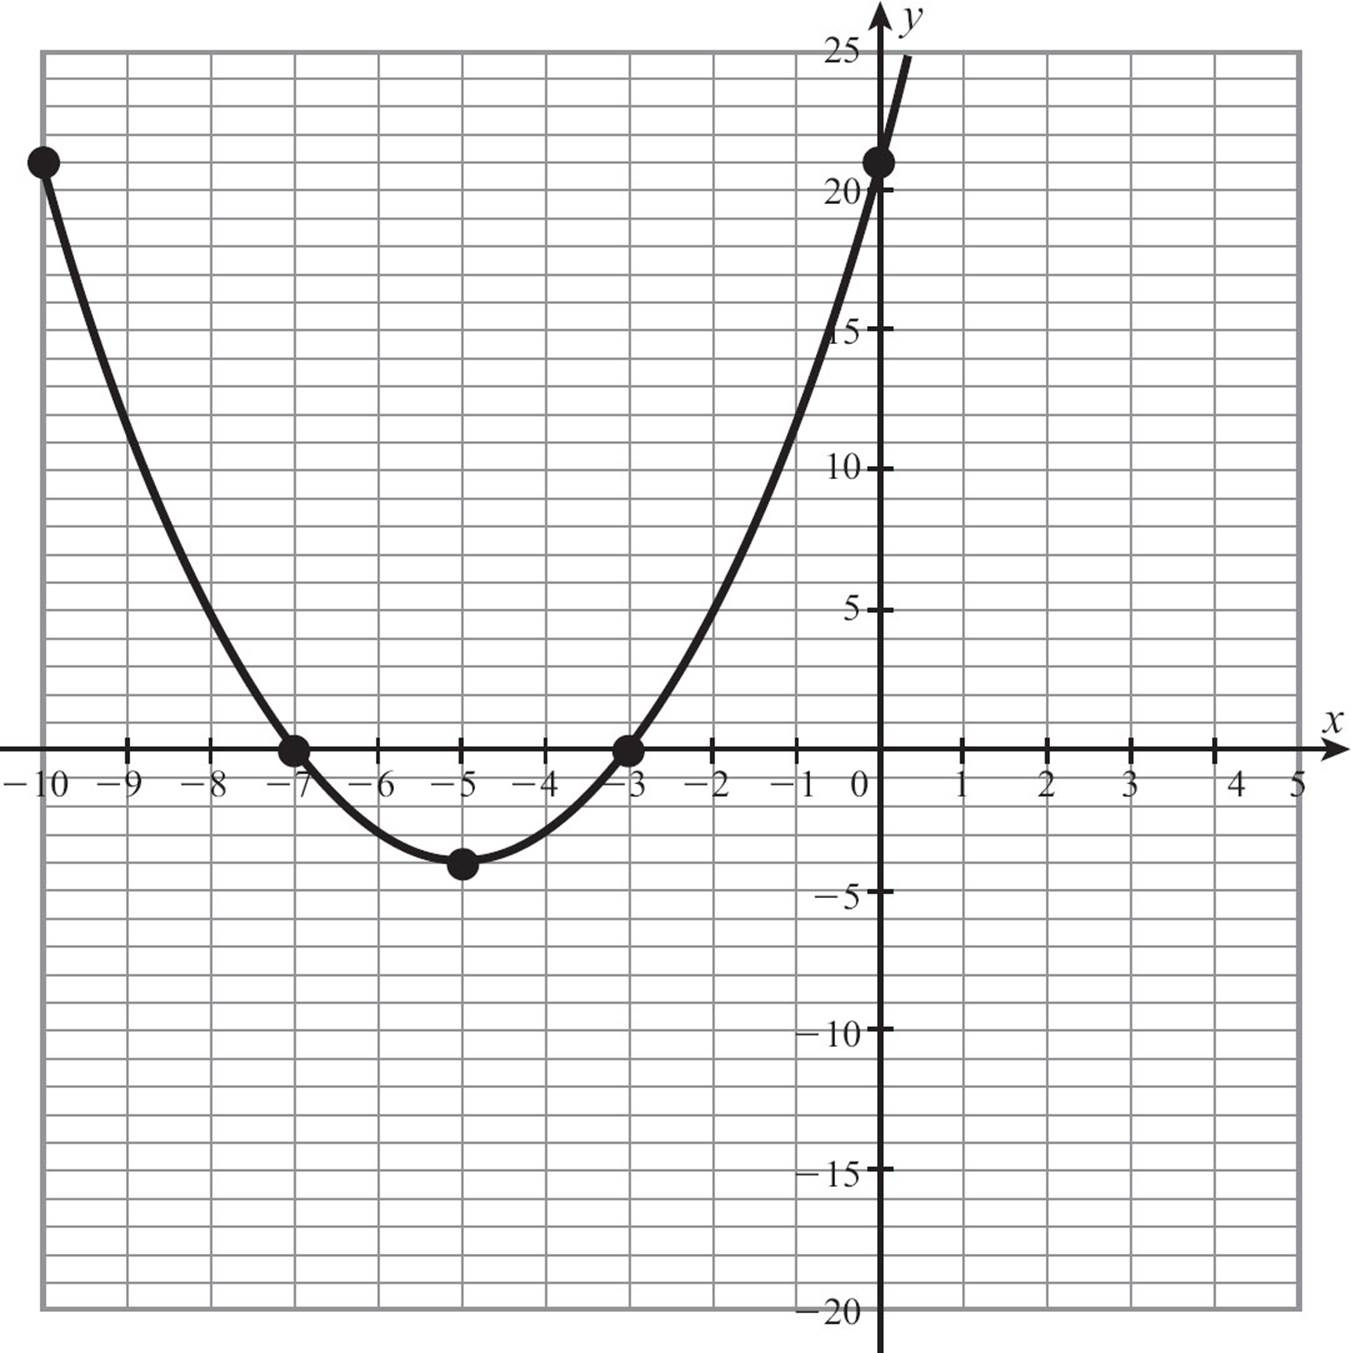
To graph y = x2 + 10x + 21, you need to extract three pieces of information: the vertex, the x-intercepts, and the y-intercept.
For the x-coordinate of the vertex, use with a = 1 and b = 10. The x-coordinate of the vertex is 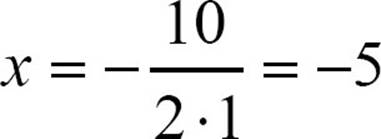 . Find the y-coordinate of the vertex by plugging -5 into the equation, just as you would do if you were making a table of values. y = x2 + 10x + 21 = (− 5)2 + 10 (− 5) + 21 = 25 − 50 + 21 = − 4. The vertex is (−5, −4).
To find the x-intercepts of the graph, solve the equation 0 = x2 + 10x + 21 by factoring.
The x-intercepts are (-3, 0) and (-7, 0).
Finally, to find the y-intercept, replace x with 0 in y = x2 + 10x + 21. y = 02 + 10 · 0 + 21 = 21. The y-intercept is (0, 21).
![]()
TIP
The y-intercept of the graph of a quadratic equation is always the constant term.
Let’s get those points on a graph.
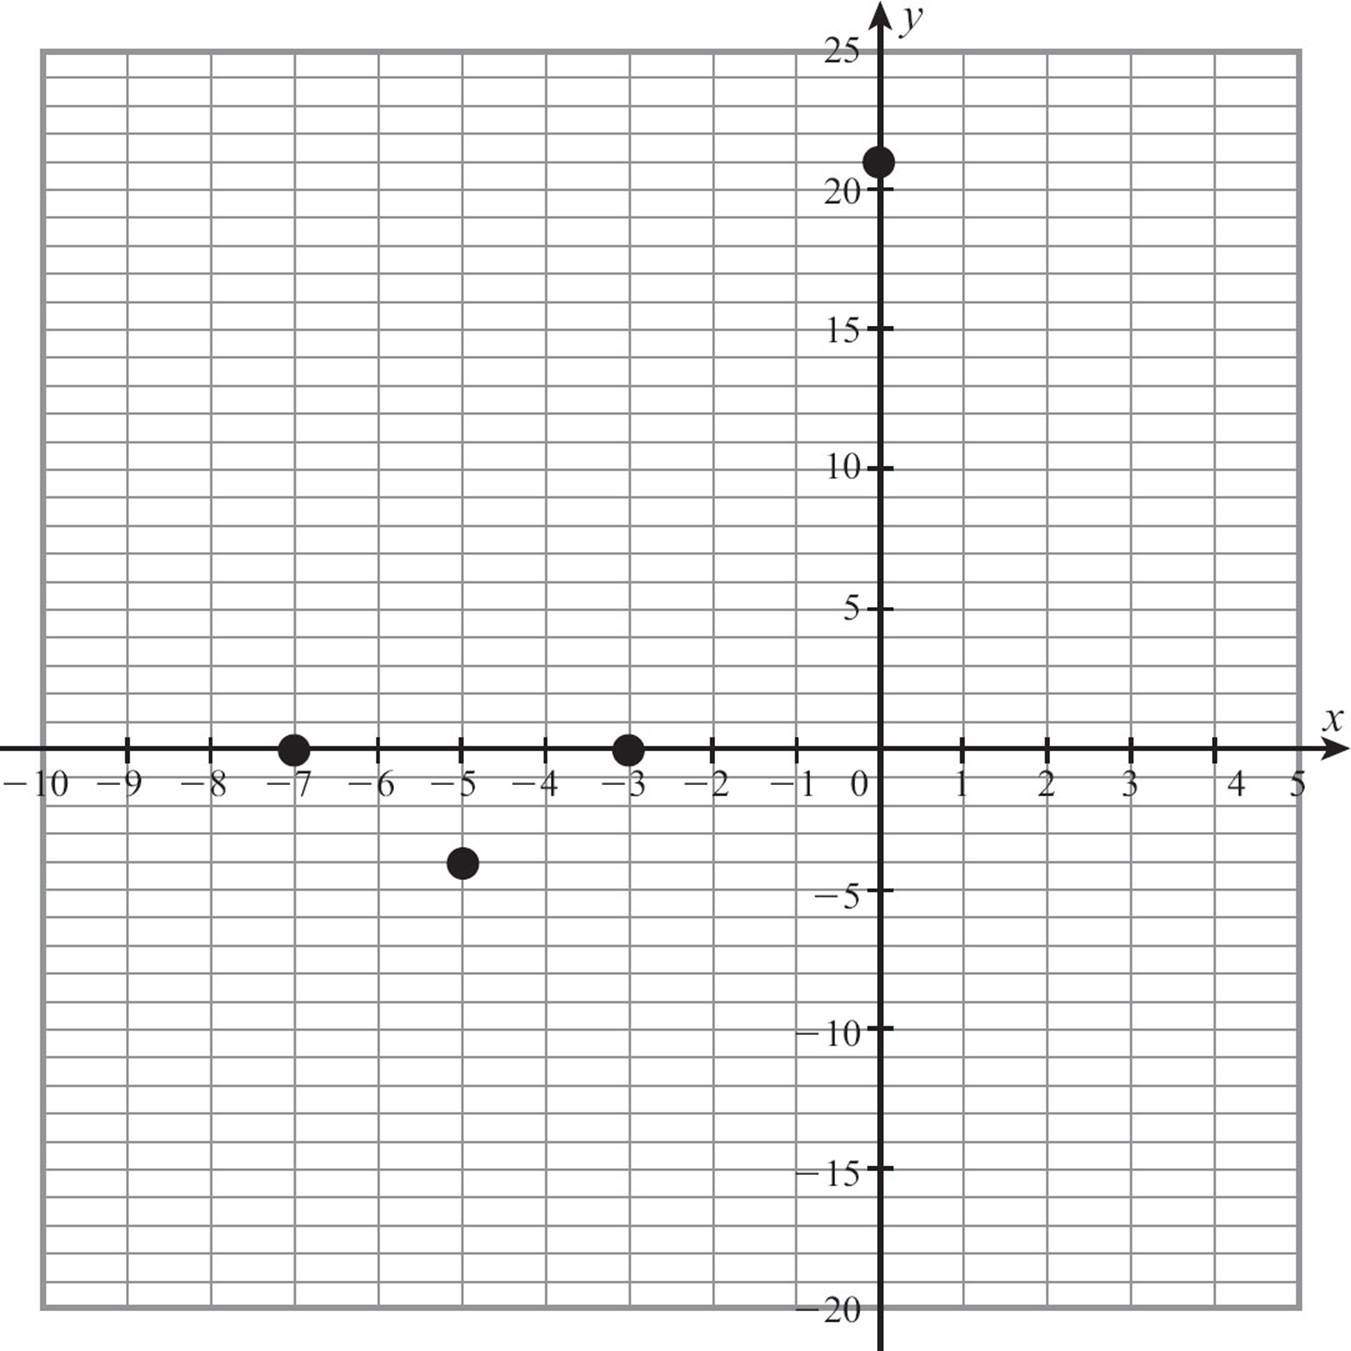
Can you see the cup-shape of the parabola forming? You can use the fact that parabolas have an axis of symmetry to predict that if (0, 21) is on the graph, so is (-10, 21), and that will help make the parabola clearer. Connect the points with a smooth curve and you’re done.
Let’s tackle one more example. This time let’s graph y = 4 − x2. You’re used to working with functions in the form y = ax2 + bx + c, so let’s examine this one and make sure you have the correct values for a, b, and c. You can rewrite y = 4 − x2 as y = 1x2 + 0x + 4, and then it’s clear that a = −1, b = 0, and c = 4.
When you try to find the vertex, b = 0 so = 0. The x-coordinate of the vertex is 0 and if you plug that into the equation y = 4 − x2, you find that the y-coordinate of the vertex is 4. The vertex is (0, −4), and coincidentally, (0, −4) is also the y-intercept.
Solve 4 − x2 = 0 to find the x-intercepts. You can use the square root method or the factoring method (or the quadratic formula, but that’s working too hard). Let’s use the square root method and say 4 − x2 = 0 so 4 = x2 and x = ±2. The x-intercepts are (2, 0) and (−2, 0).
When you plot those points, you can see the parabola forming, but this time, it’s upside down.
![]()
CHECK POINT
Graph each quadratic function by finding the vertex, the x-intercepts, the y-intercept, and if necessary, making a table of values.
1. y = x2 + 4x − 5
2. y = x2 − 2x − 3
3. y = 4 − 3x − x2
4. y = x2 − 8x
5. y = 32 + 4x − x2
6. y = x2 + 4x − 21
7. y = 2 x2 − 18
8. y = 2x2 + 10x + 12
9. y = − 2x2 − 12x − 18
10. y = 4x2 + 4x + 1
Graphing Shortcuts
You’ve already learned two particularly quick methods for graphing linear equations: x- and y-intercepts, and slope and y-intercept. To graph quadratic functions, you need a little more information, because the shape of the graph is more complex. You can use the vertex and the intercepts, but the equation has a few other clues that will help you sketch the graph quickly.
The value of a in y = ax2 + bx + c gives you two pieces of information. Its sign tells you whether the parabola opens up, forming a cup that would hold liquid, or opens down, spilling the liquid. If a is positive, the parabola opens up. If a is negative, the parabola opens down. The graph of y = x2 + 10x + 21 opened up because the value of a was +1, but the graph of y = 4 − x2 opened down because of the -1 in the a position.
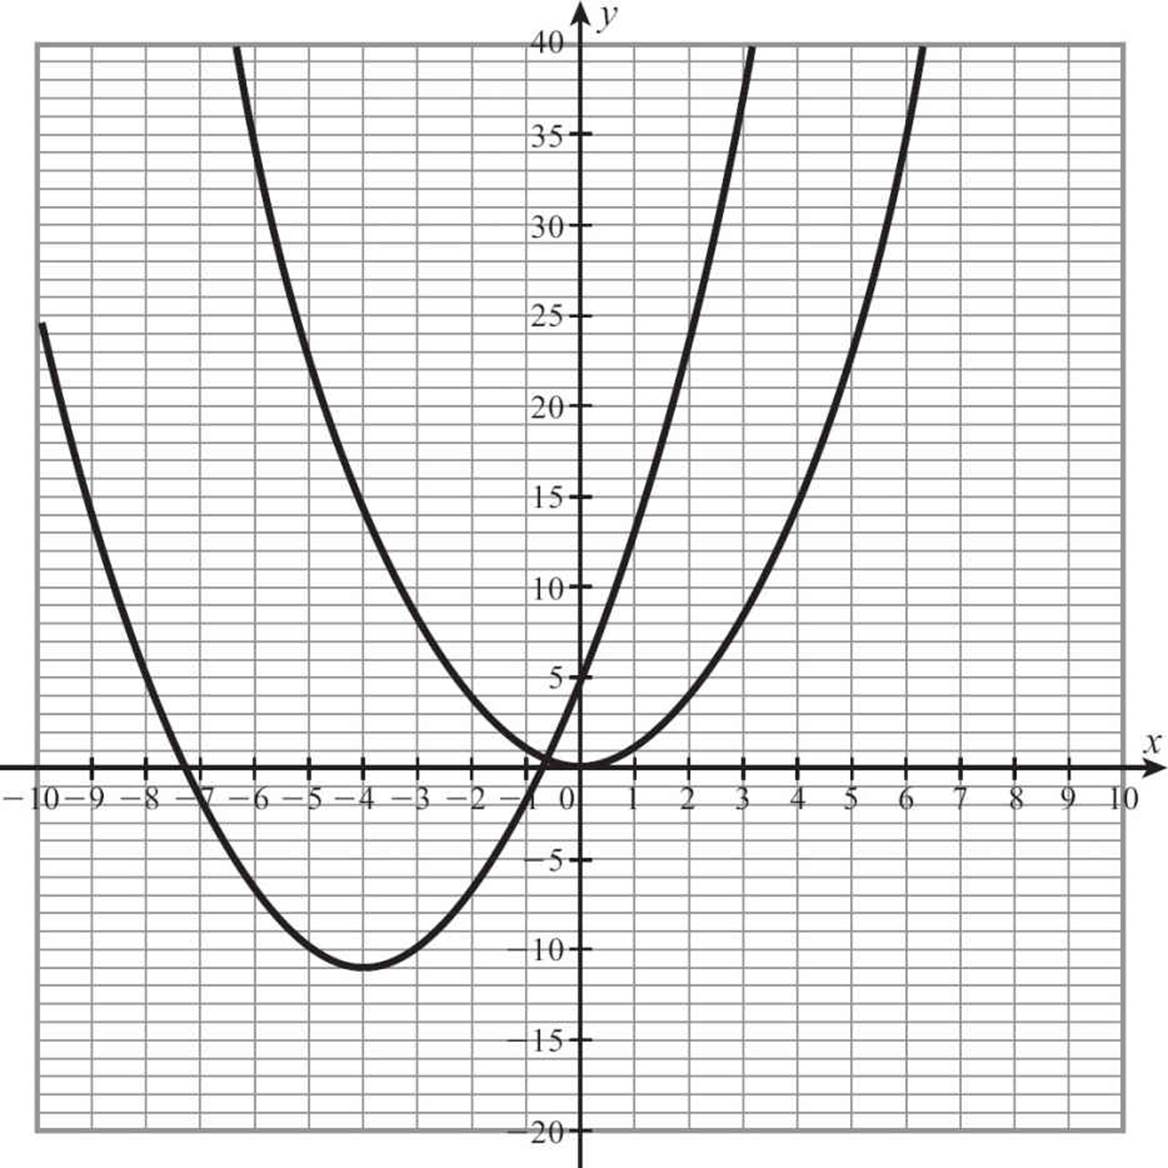
The value of a also tells about the width of the parabola, whether it’s narrow or wide. The larger the absolute value of a, the narrower the parabola will be. Look at the following graph, which shows y = x2, y = 3x2, and 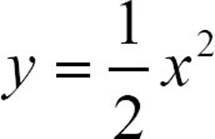 .
.
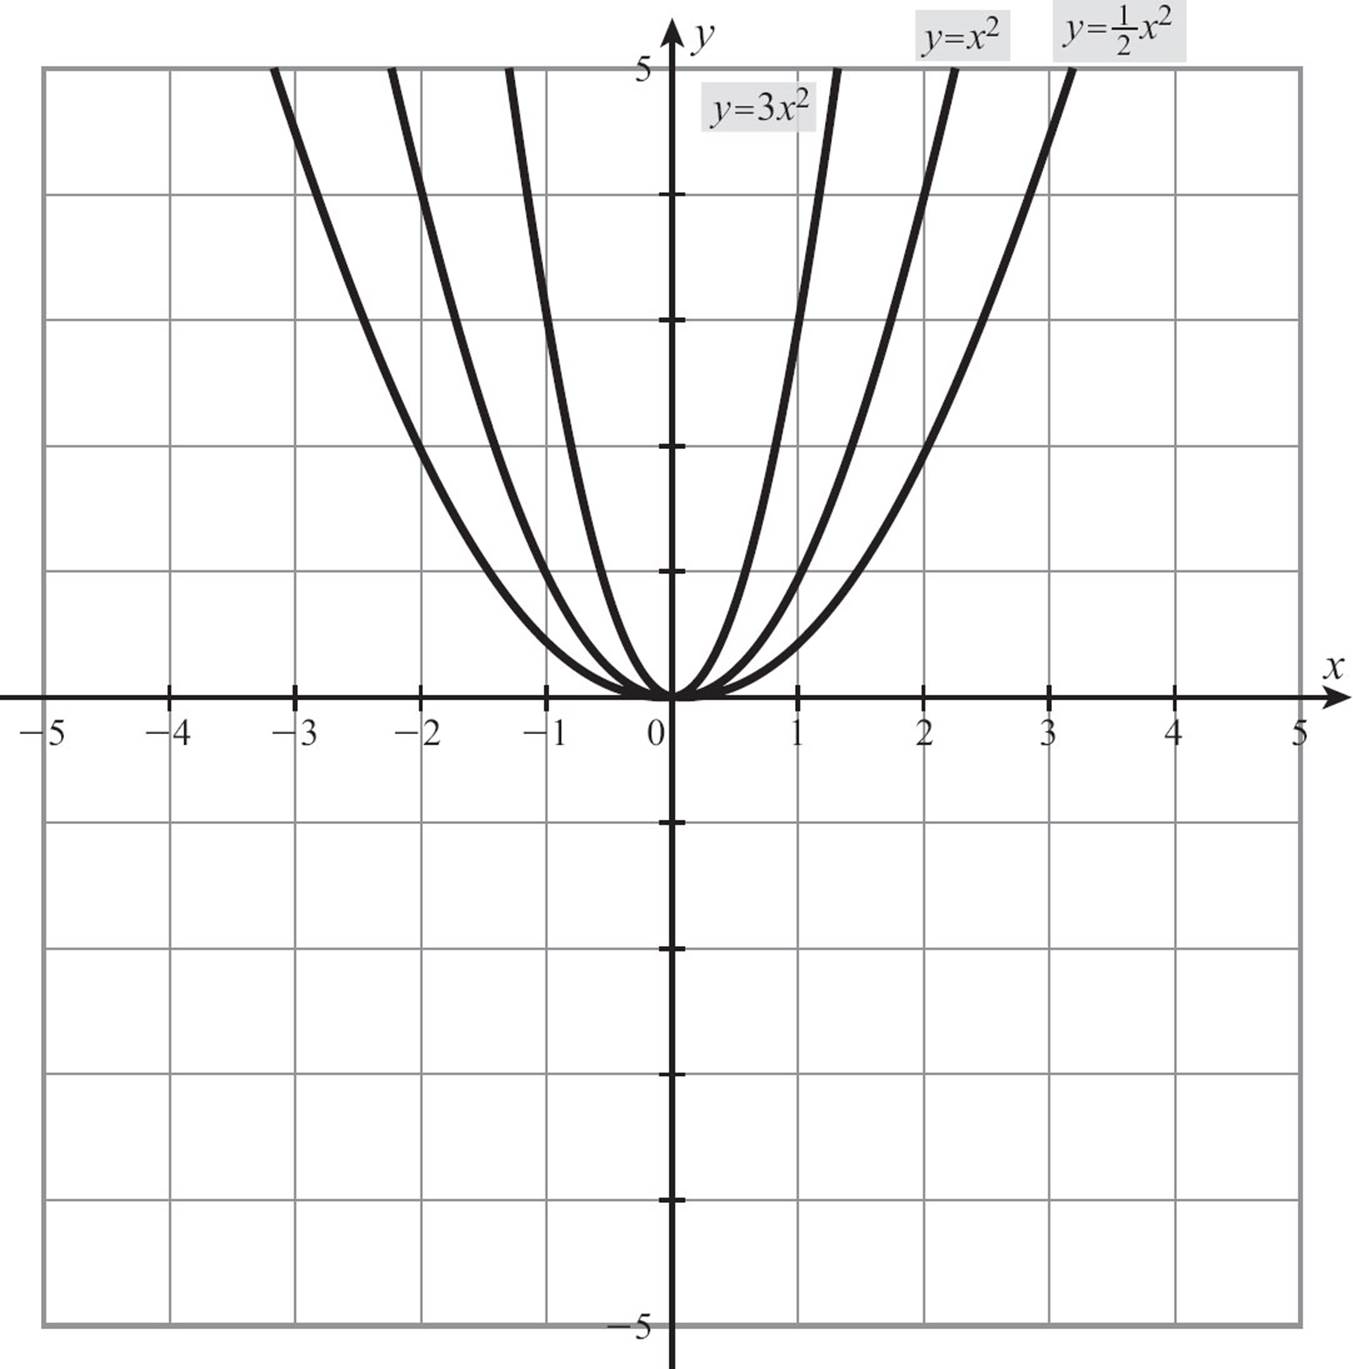
It’s nice to know whether you’re going to have a narrow or a wide parabola, but that’s not much help unless you know how wide or how narrow. In fact, the value of a can help you answer that, if you know an old trick called the odd number rule.
Think about the odd numbers: 1, 3, 5, and so on. Then look at the graph of y = x2, and imagine putting one finger of each hand on the vertex. Now move one finger one box right and the other one box left. Your fingers are on the points (1, 0) and (-1, 0). How far do you need to move your fingers upward to get to the parabola? One unit up on each side should do it, so move to (1, 1) and (-1, 1). Now move out one unit on each side again, to (2, 1) and (-2, 1). How far to the parabola now? Three units up? Can you guess what will happen if you do it again? You’ll have to go 5 units up, and the next time 7, then 9, and on through the odd numbers.
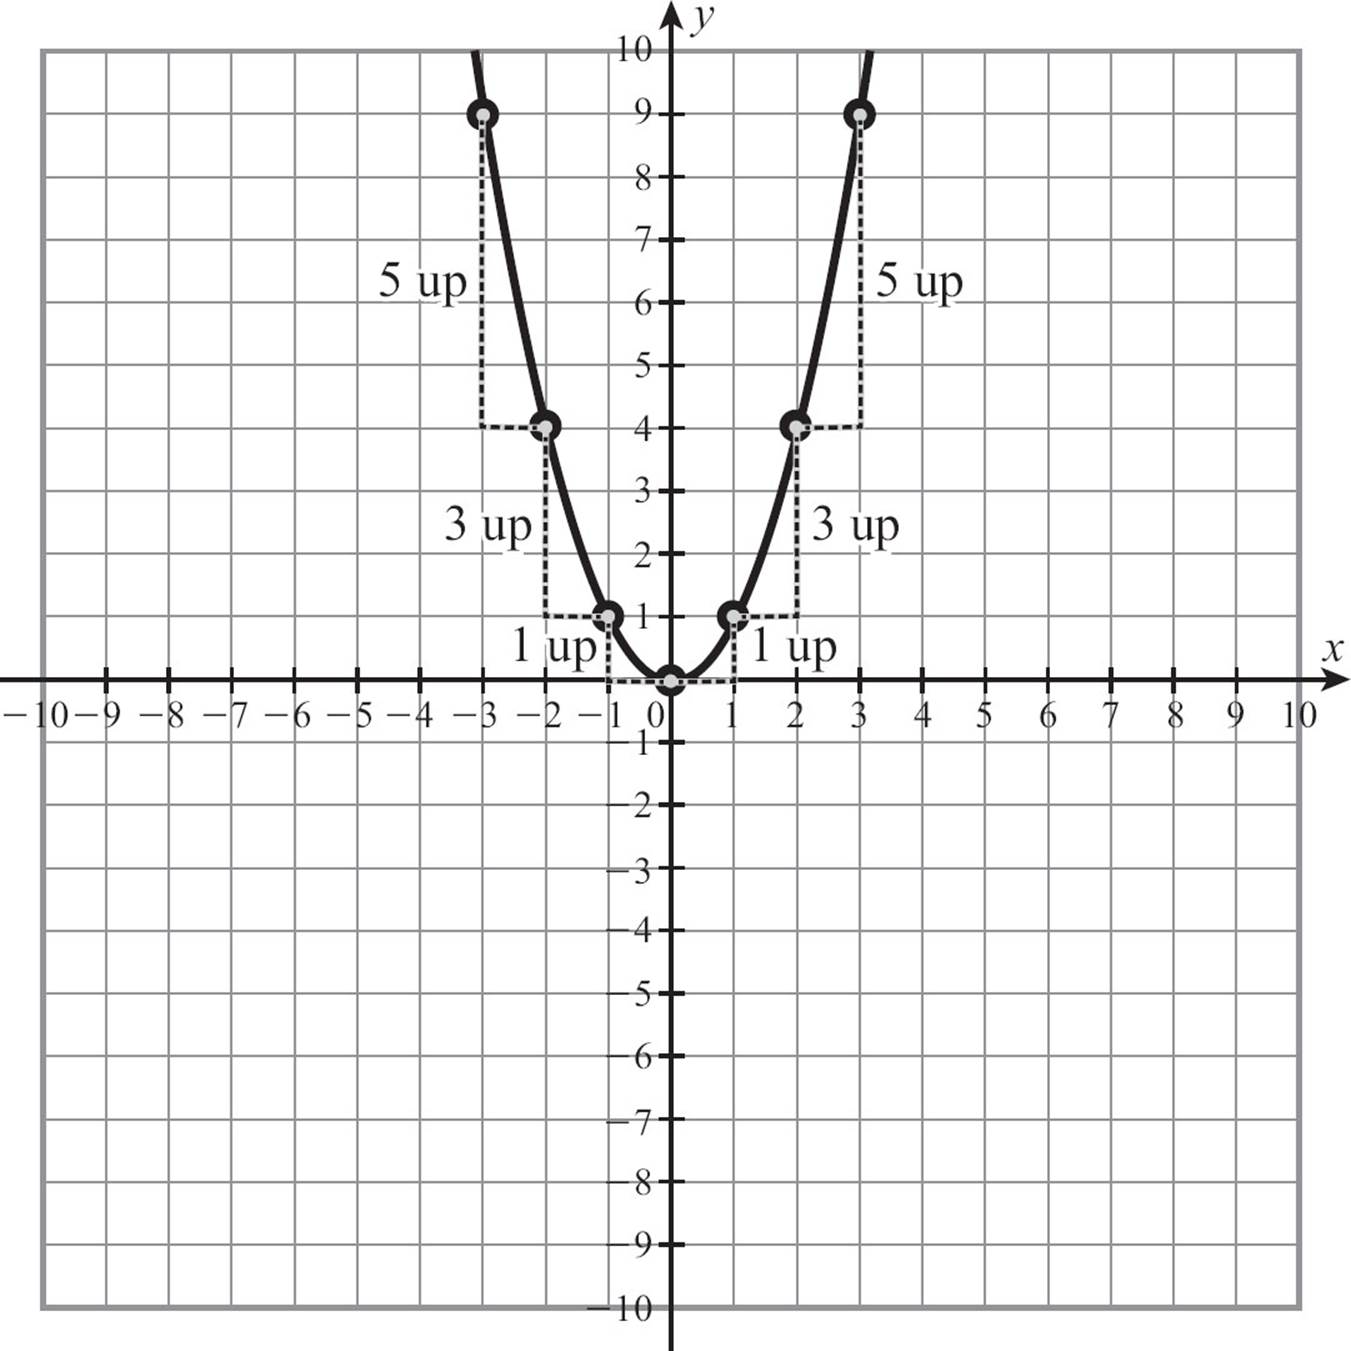
Any time a = 1, you’ll see this 1, 3, 5, … pattern. If a is not 1, take the odd numbers and multiply each one by a. So when you graph y = 3x2, you find the vertex, (0, 0), and multiply the odd numbers by 3. 3·1, 3·3, 3·5,... becomes 3, 9, 15, … You can start from the vertex and count out 1, up 3, out 1, up 9, out 1, up 15, to set points of the graph.
You already know how to find the x-coordinate of the vertex using . Finally, c, the constant term, is the y-intercept. If you use the vertex and these helpers, you can often sketch the graph of a parabola without a lot of prep work.
![]()
CHECK POINT
Graph each quadratic function by using shortcuts wherever you can. If necessary, make a table of values.
11. y = 2x2
12. y = 3x2 − 4
13. y = 5 − x2
14. y = x2 + 6x
15. y = x2 − 2x − 3
16. y = 3 − 2x −x2
17. y = 9 − 2x2
18. y = x2 − 1
19. y = 9 − x2
20. y = 2x2 − 6x
Graphing Quadratic Inequalities
When you learned to graph linear functions, you also explored linear inequalities, relations that are not functions and are best communicated by showing a graph. Let’s use the knowledge, along with what you’ve just learned, to graph quadratic inequalities, and use those graphs to understand the solution set of the inequality.
The quadratic function y = 6 + 4x − 2x2 can be graphed fairly quickly if you recognize that a = −2, b = 4, and c = 6, and use those to find the vertex and y-intercept. The x-coordinate of the vertex is 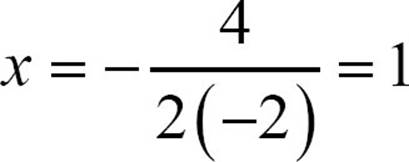 , and the y-coordinate is y = 6 + 4·1 − 2·12 = 8 . The vertex is (1, 8) and the y-intercept is (0, 6). Then you can make a table or solve 0 = 6 + 4x − 2x2 to find the x-intercepts.
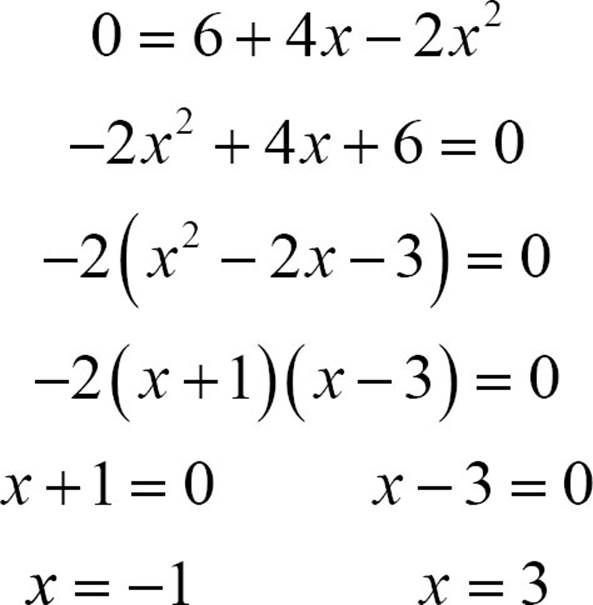
Here’s the graph of the quadratic function y = 6 + 4x − 2x2.
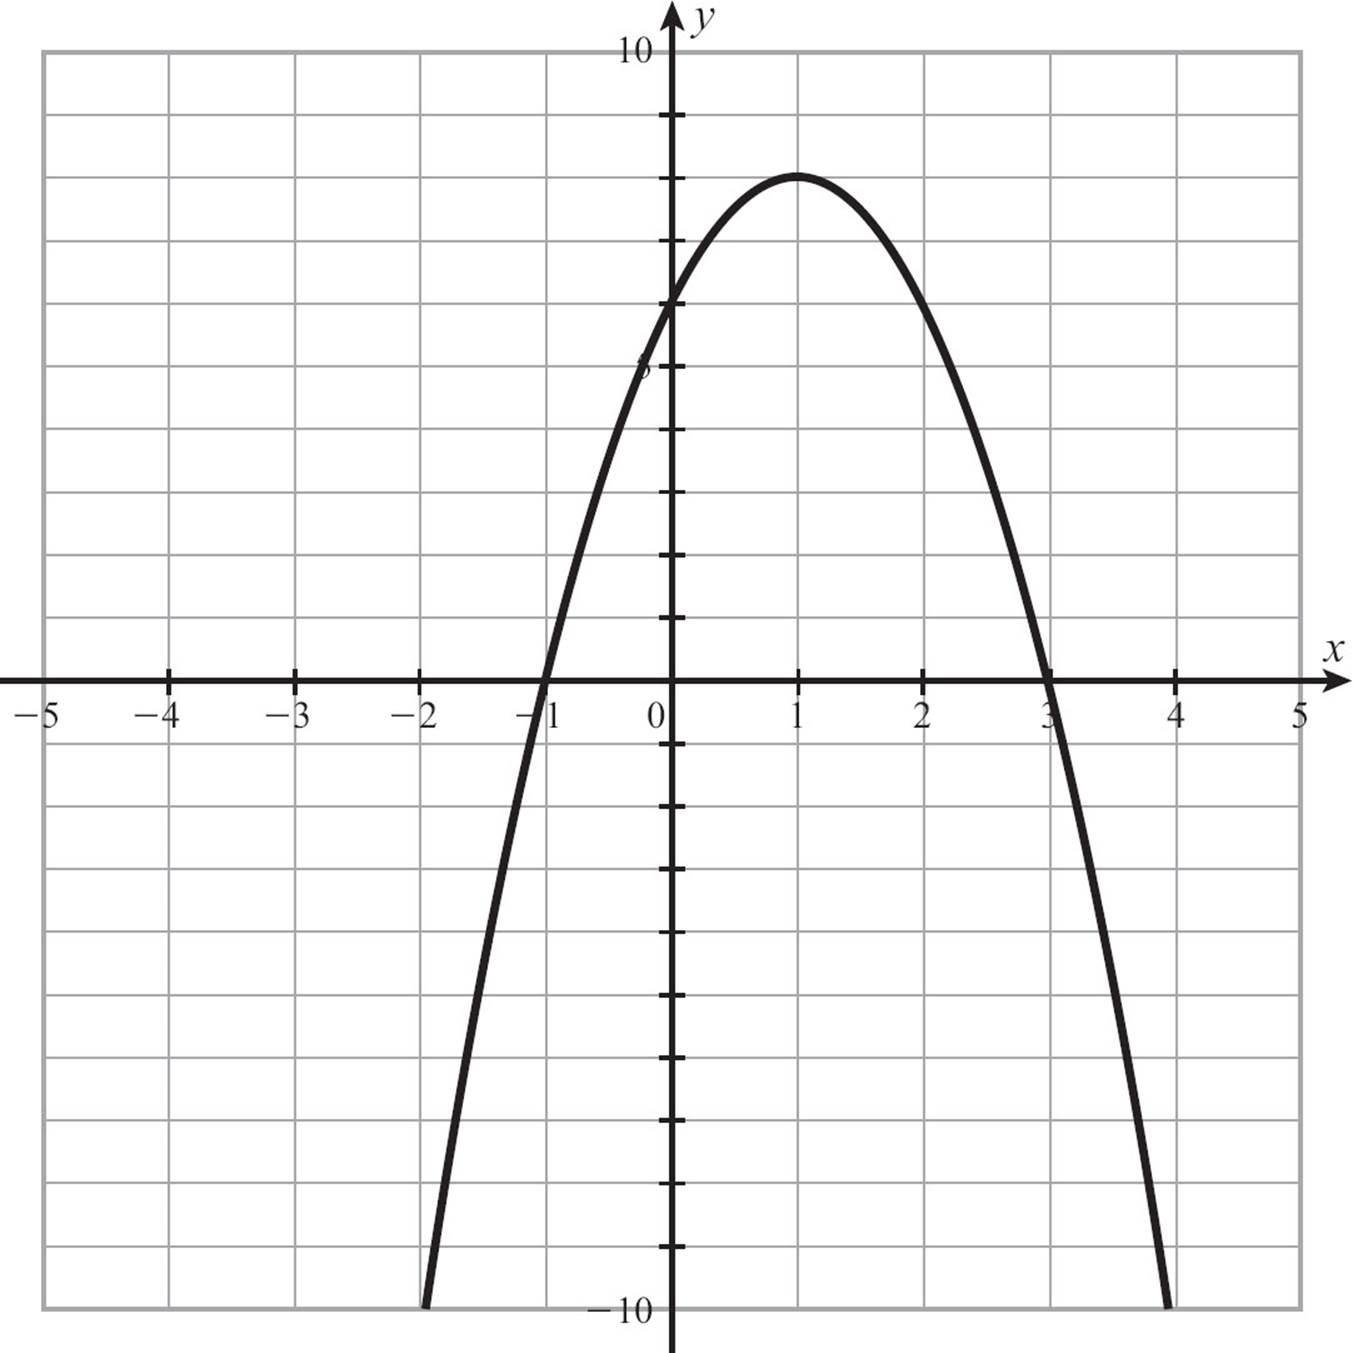
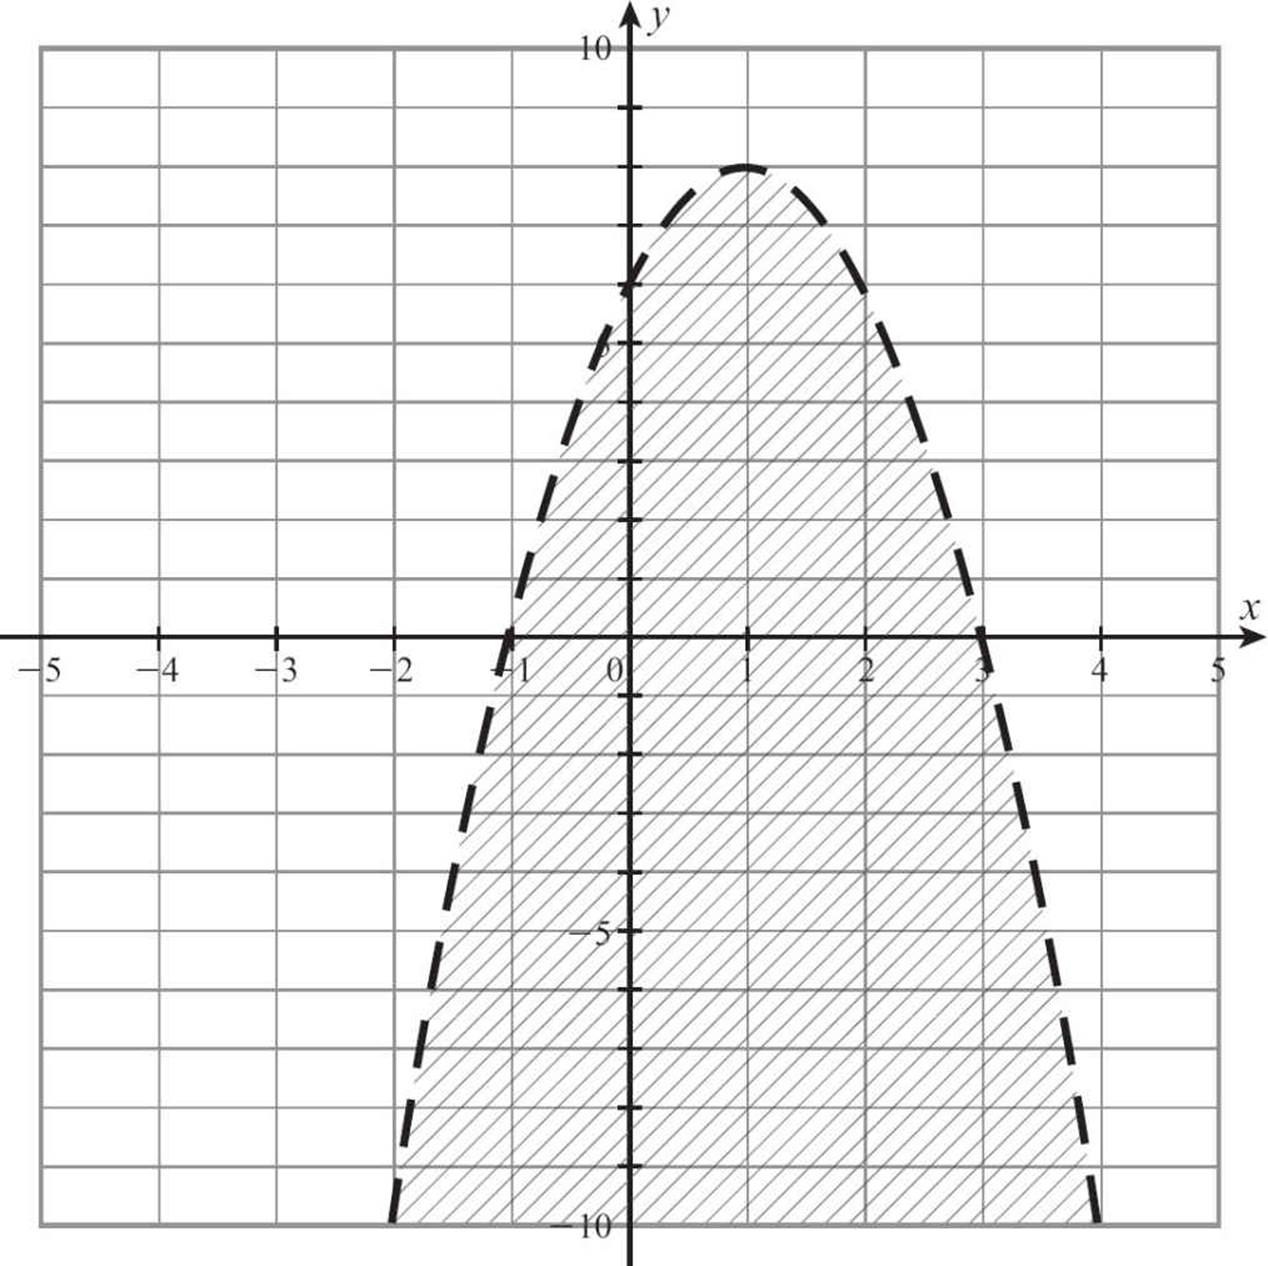
That graph shows the points for which the y-coordinate is equal to 6 + 4x - 2x2, but you won’t always want to know where y equals the expression. Sometimes you might be interested in the points for which y is less than the expression or greater than the expression. So if the preceding graph is the graph of y = 6 + 4x - 2x2, what would the graph of y < 6 + 4x - 2x2 look like?
Use what you know about linear inequalities to answer the question. Remember that you used a solid line to graph inequalities that included “or equal to” but a dotted line to show strictly greater or strictly less. So the first change you would make to the preceding graph would be to draw the parabola with a dotted line.
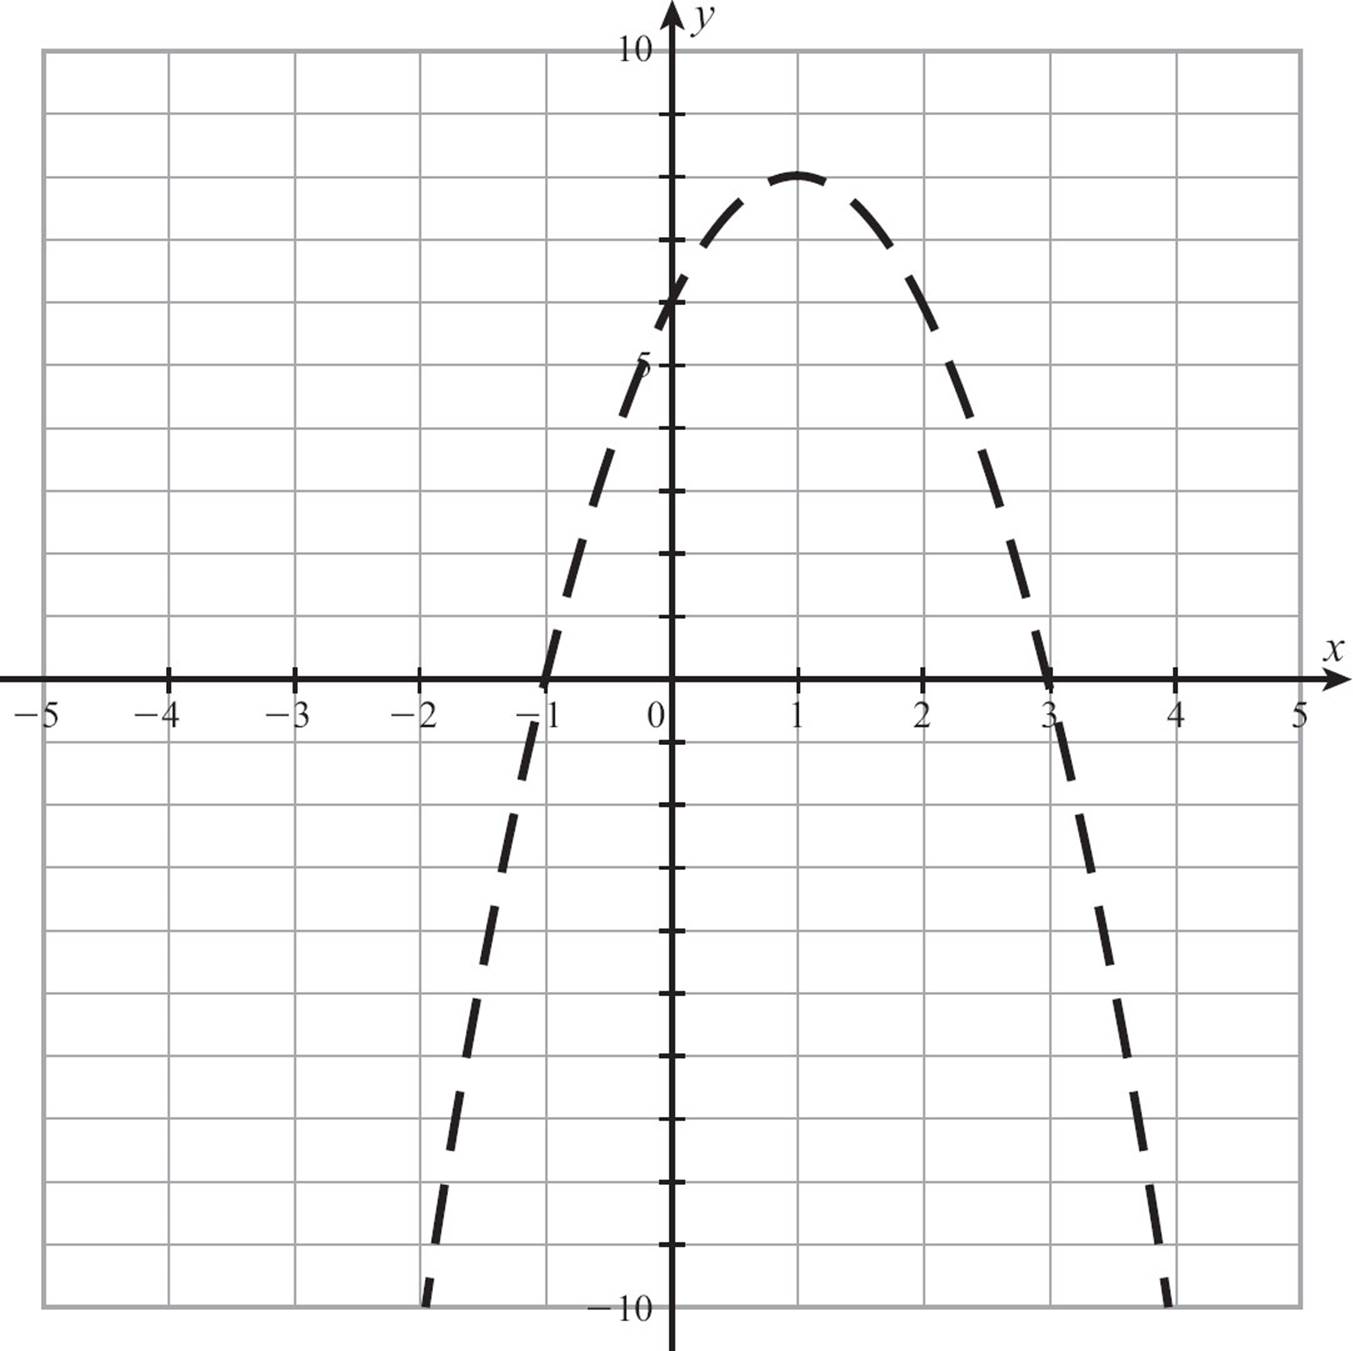
That communicates that although the parabola is a boundary for the points you want, you don’t want to actually include the boundary. Where then are the points you want? Which side of the boundary has points with a y-coordinate less than 6 + 4x − 2x2? The basic rule you used with lines still holds. For y less than the expression, shade down. For y greater than the expression, shade up. Of course, you can always test a point to see if it is in a region that should be shaded. You want y < 6 + 4x − 2x2, so shade down. Check by testing the point (0, 0) in the inequality. 0 < 6 + 4·0 − 2·02, or 0 < 6, is a true statement, so you’re shading the correct area.
Here’s what the final graph of y < 6 + 4x - 2x2 looks like.
![]()
CHECK POINT
Graph each quadratic inequality.
21. y < − 2x2
22. y > x2 − 6
23. y ≤ x2 + 4x
24. y ≥ x2 − 4
25. y ≤ x2 − 2x − 3
26. y < x2 + 4x − 5
27. y < 4 − 3x − x2
28. y ≥ x2 + 6x
29. y > x2 + 4x − 21
30. y 2x2 + 10x + 12
Finding the Equation of a Parabola
Do you remember how to find the equation of a line? You need to know two points on the line, or one point and the slope. Then you can use the point-slope form of the line, y − y1 = m(x −x1), and replace m with the slope and x1 and y1 with the coordinates of a point.
That won’t work for finding the equation of a parabola, for the obvious reason that a parabola is not a line, and that’s the point-slope form of a line. Because the parabola is a more complex shape than a line, just knowing any two points on the graph won’t be enough. And a parabola doesn’t have a slope. A slope is the rate at which a line rises or falls, each time it moves one unit right. The slope of a line is the same no matter where on the line you measure it, but that’s certainly not true of a parabola. Parabolas fall on one side and rise on the other, and they rise or fall more quickly as you move away from the vertex. So what can you do about finding the equation of a parabola from the graph?
As you’ve graphed parabolas, you’ve probably noticed that the vertex locates the graph for you, and then the value of a tells you how to shape it. Those two pieces of information—the vertex and the value of a—define the parabola. Luckily, there’s a form of the equation of a parabola called the vertex form that allows you to write the equation if you know those two pieces of information.
First, you need to know the vertex. Denote the vertex as (h, k). Instead of point-slope form, y − y1 = m(x − x1), which uses (x1, y1) as some point on the line, you’re going to use (h, k) to represent one very specific point on the parabola. Even if you made that change, writing y − k = m(x − h), you’d still be writing the equation of a line. To create a parabola, you have to have a variable squared, so you need something like this: y − k = m(x − h)2. But mstands for the slope, and a parabola doesn’t have a slope, so change that to a, and the vertex form of the equation of a parabola will be y − k = a(x − h)2.
If you’re asked to find a parabola with vertex (4, -7) and a = 3, you can take the vertex form and plug in your specific numbers.
y − k = a (x − h)2
y −(− 7) = 3 (x − 4)2
All that’s left to do is simplify.
y − k = a (x − h)2
y−(− 7) =3 (x − 4)2
y + 7 = 3 (x2 − 8x + 16)
y + 7 = 3x2 − 24x + 48
y = 3x2 − 24x + 41
That’s not usually a difficult job, but there is still one problem. You’re not usually just handed the value of a to use, but you need it to write the equation. You may be able to deduce the value of a from the graph, using the odd number trick we learned to help us graph, but that’s not something you can depend on. Instead, look for another point on the graph, other than the vertex. For example, if we ask you to find the equation of a parabola that has its vertex at (3, 5) and also passes through the point (7, -27), here’s what you’ll do. Start as you did before with the vertex form, and plug in the coordinates of the vertex.
y − k = a (x − h)2
y − 5 = a(x − 3)2
You don’t know a, but you do know that the point (7, -27) is on this graph, so x = 7 and y = −27 must fit this equation. If you plug them in, a will be the only thing you don’t know, and you can solve for it.
y − k = a(x − h)2
y − 5 = a(x − 3)2
− 27 − 5 = a(7 − 3)2
− 32 = a(4)2
− 32 = 16a
a = − 2
Now you know the vertex and the value of a. Start again with vertex form, plug in the vertex and a, but not the other point, and simplify.
y − k = a (x − h)2
y − 5 = − 2 (x − 3)2
y − 5 = − 2 (x2 − 6x + 9)
y − 5 = − 2x2 + 12x − 18
y = − 2 x2 + 12x − 13
![]()
CHECK POINT
Find the equation of the parabola that fits the given information.
31. Vertex at (4, -3) and a = 3
32. Vertex at (-2, 5) and a = -2
33. Vertex at (0, 2), passing through (2, -2)
34. Vertex at (-4, 5), passing through (-2, 13)
35. Vertex at (-3, -2), passing through (-2, 2)
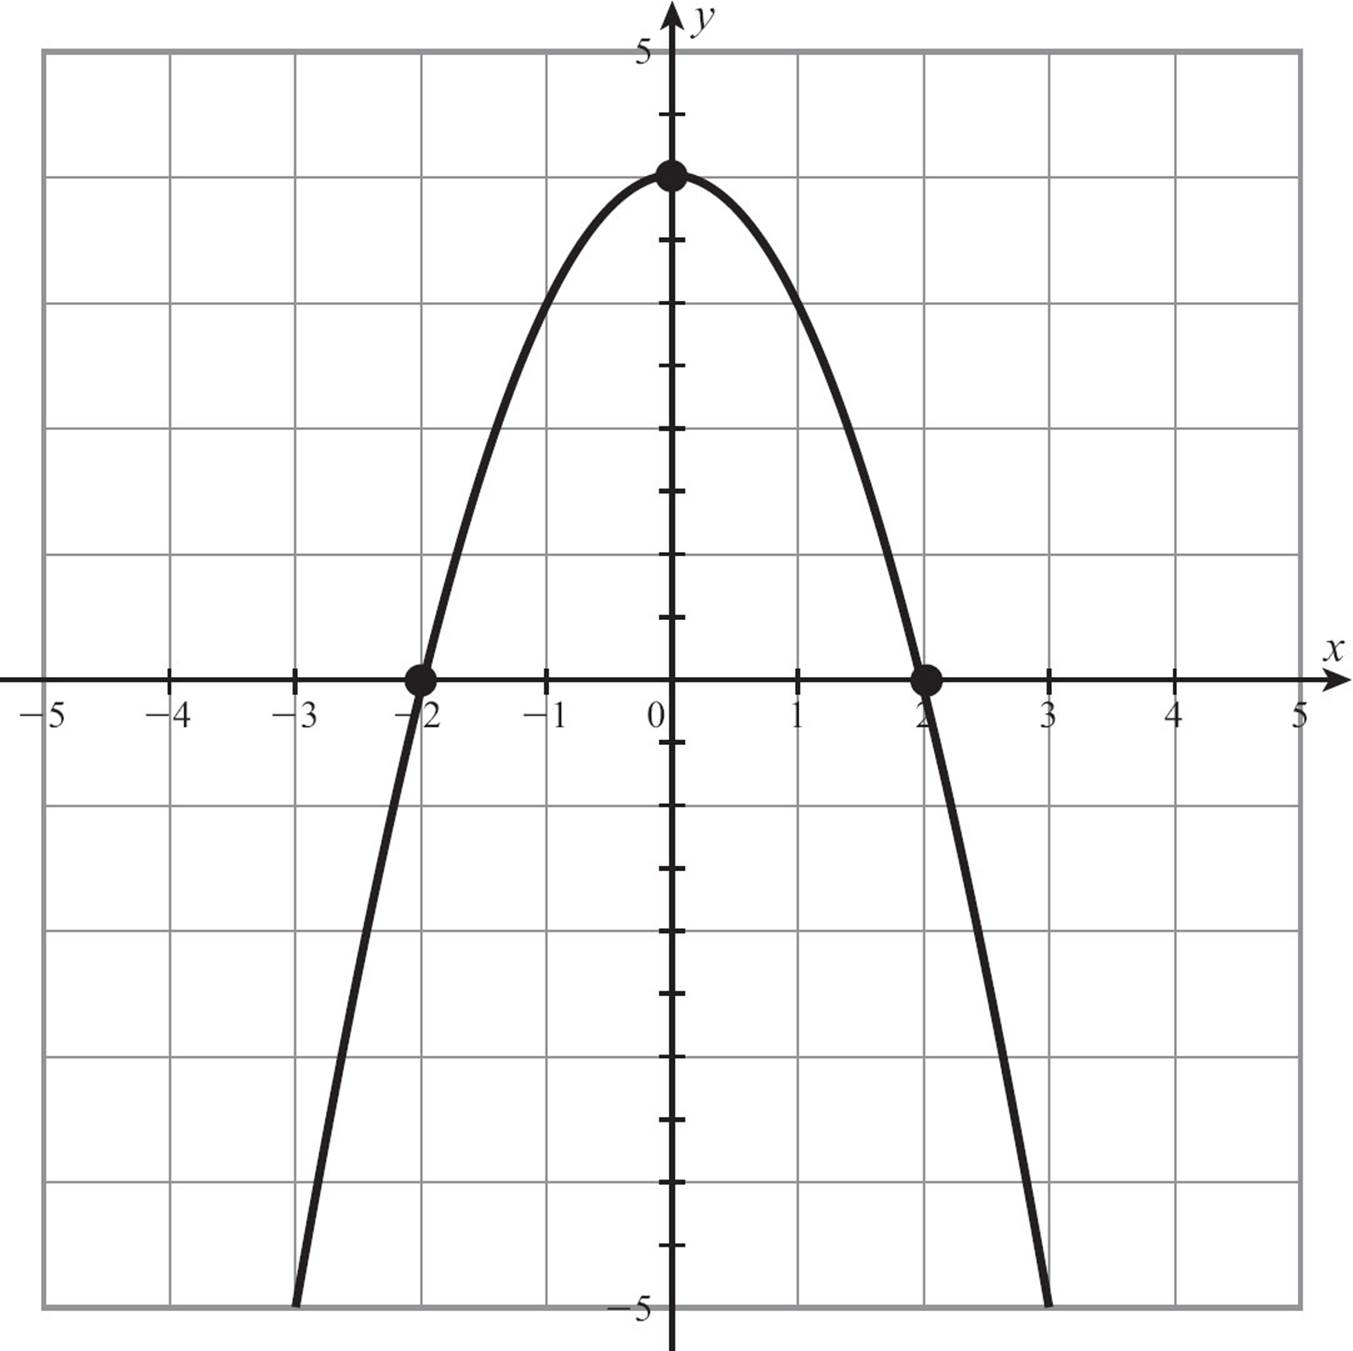
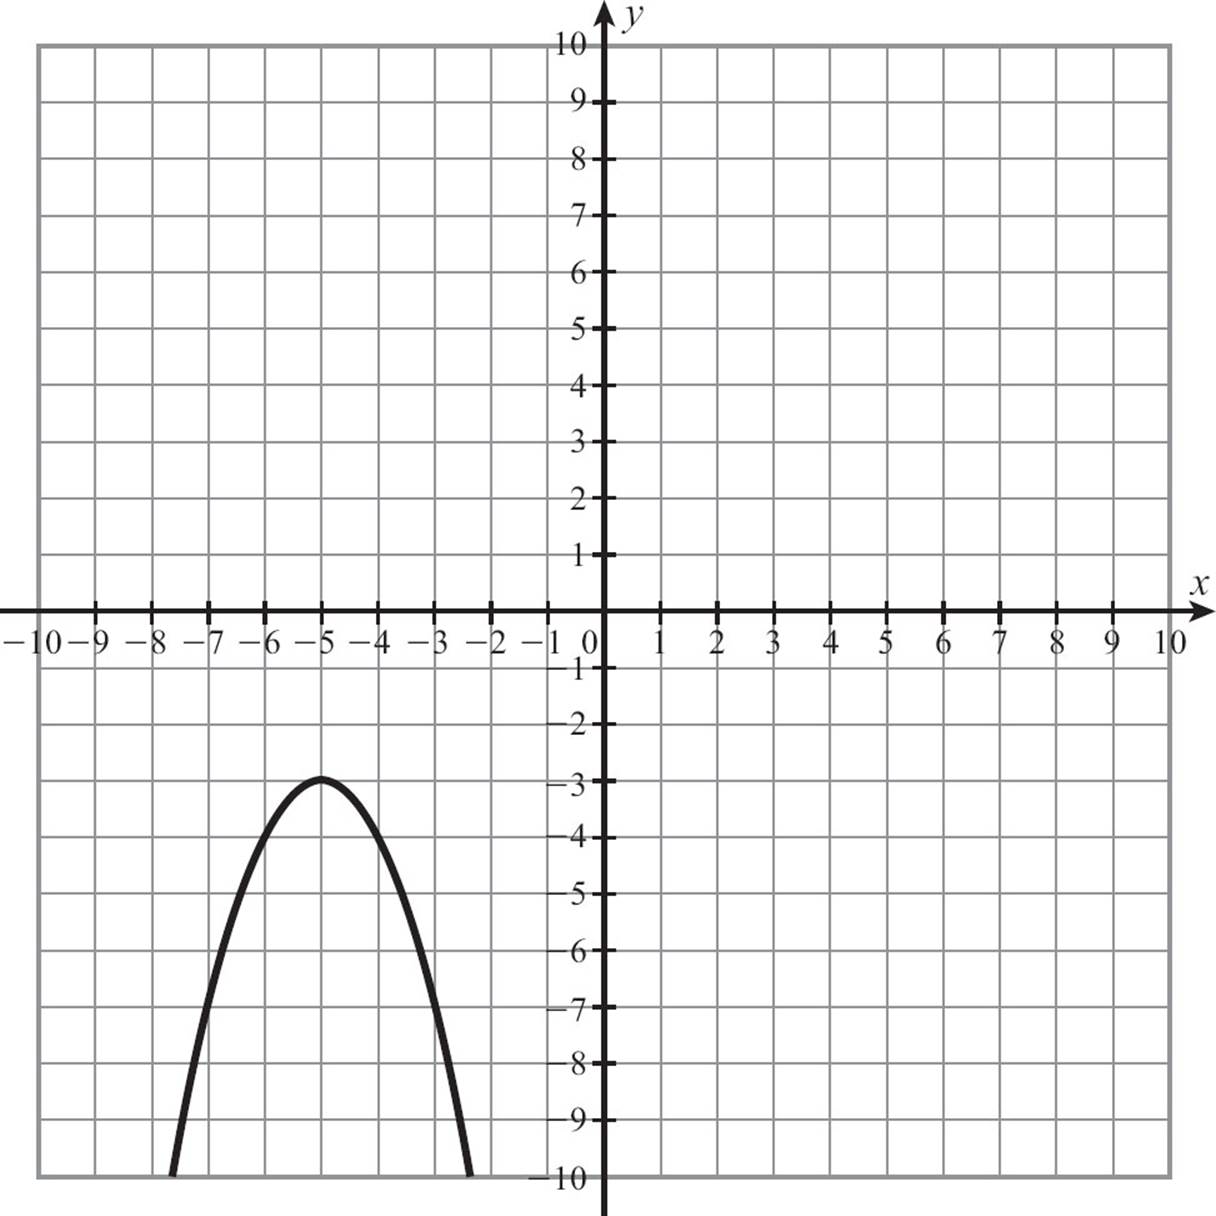
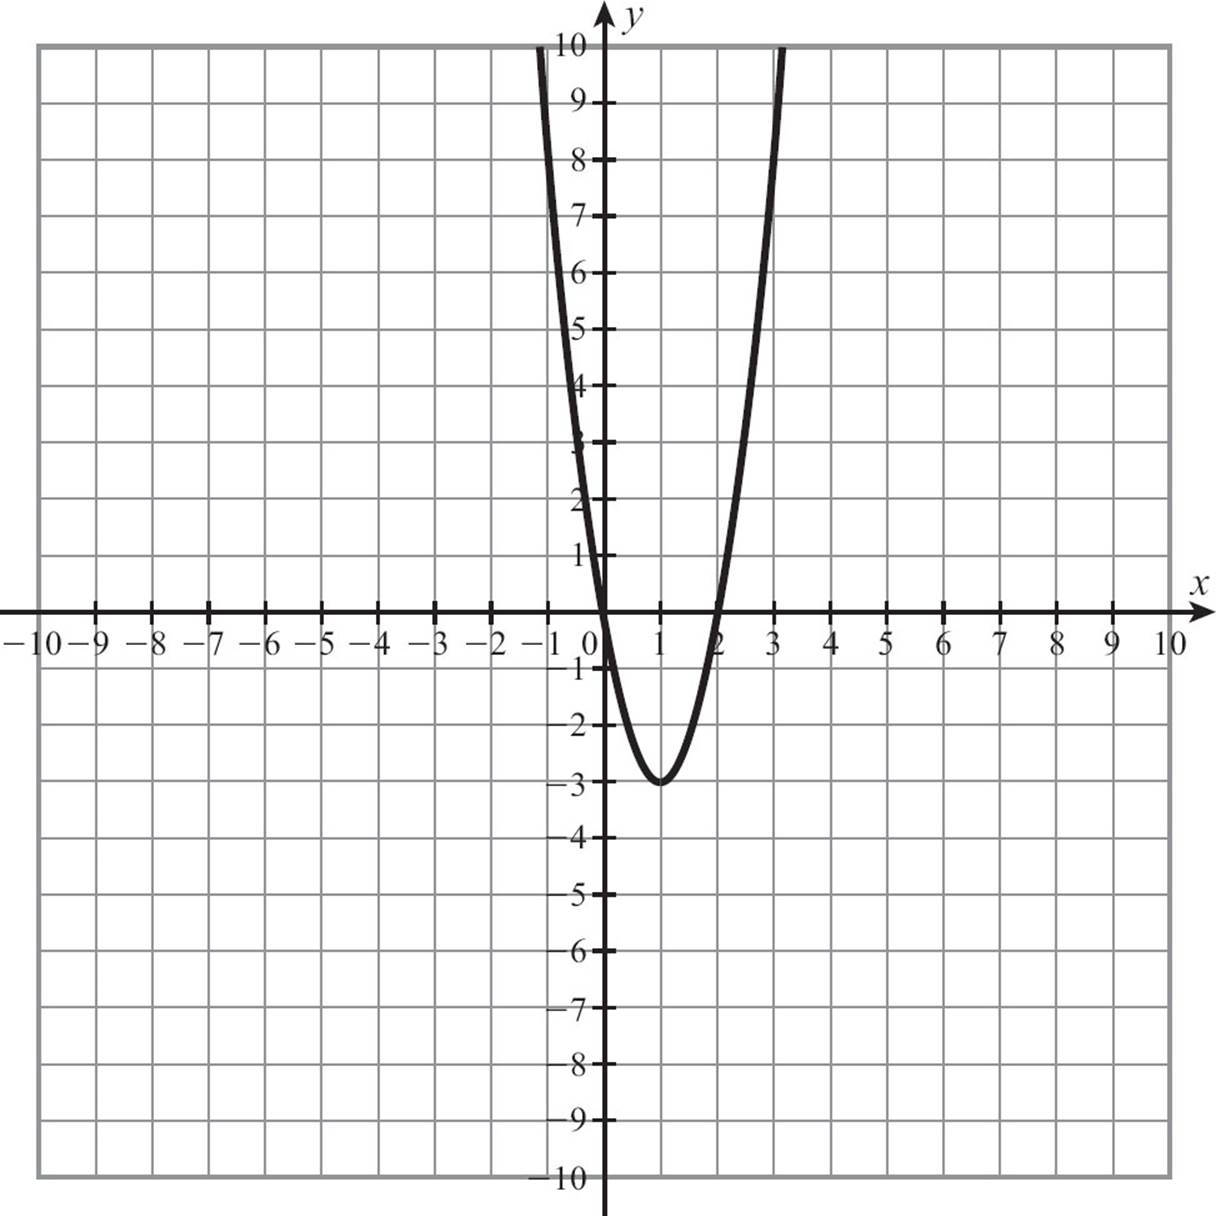
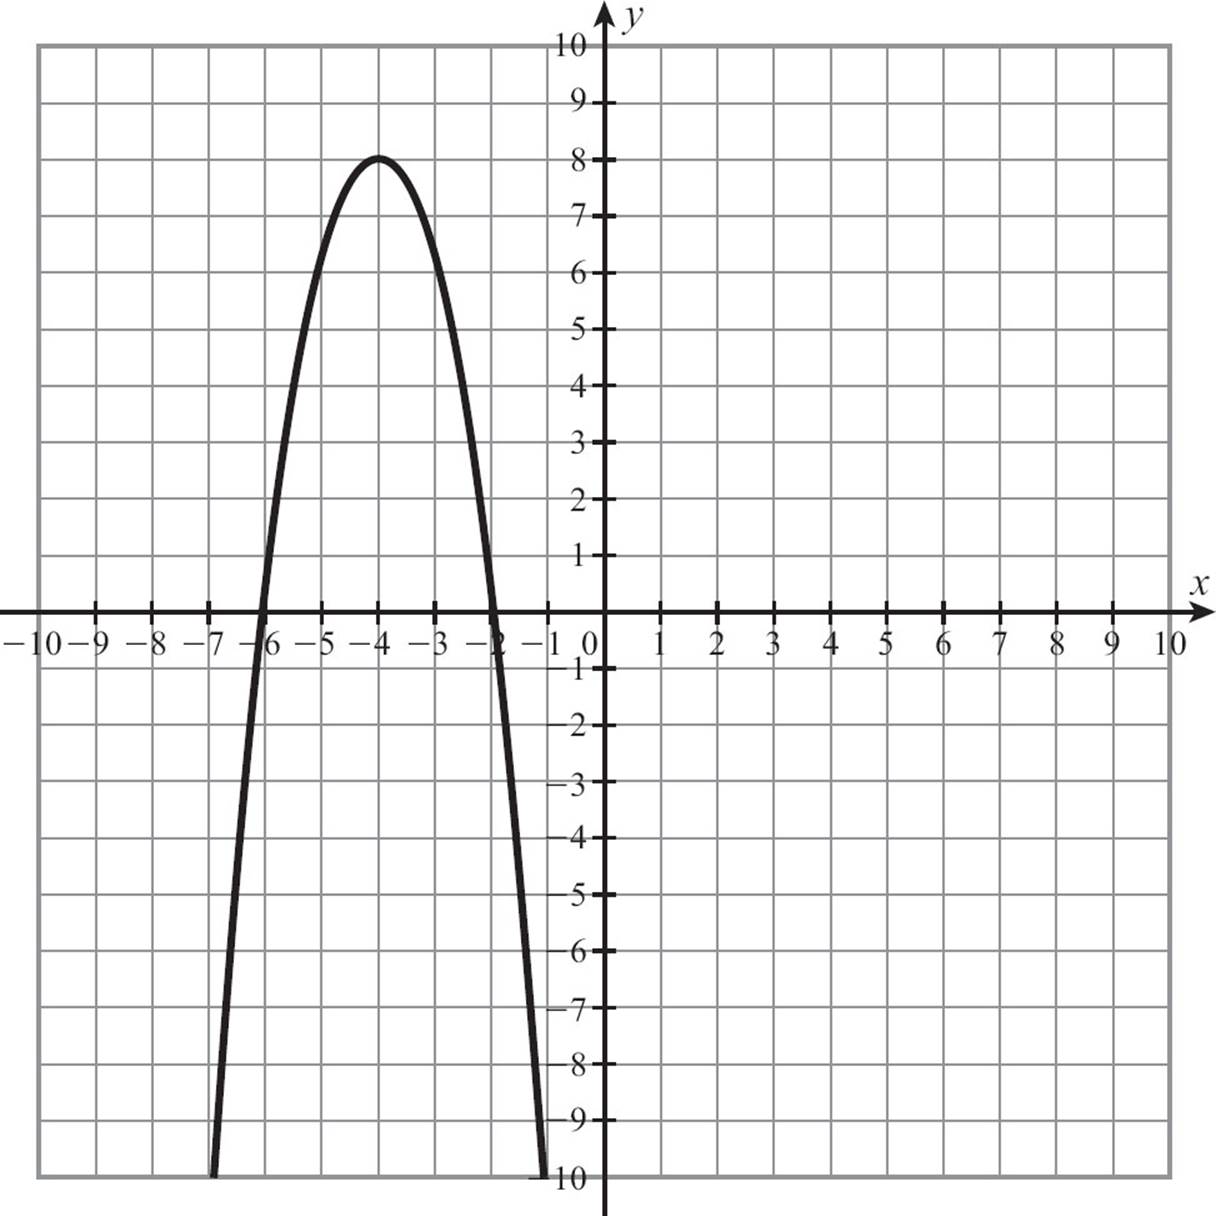
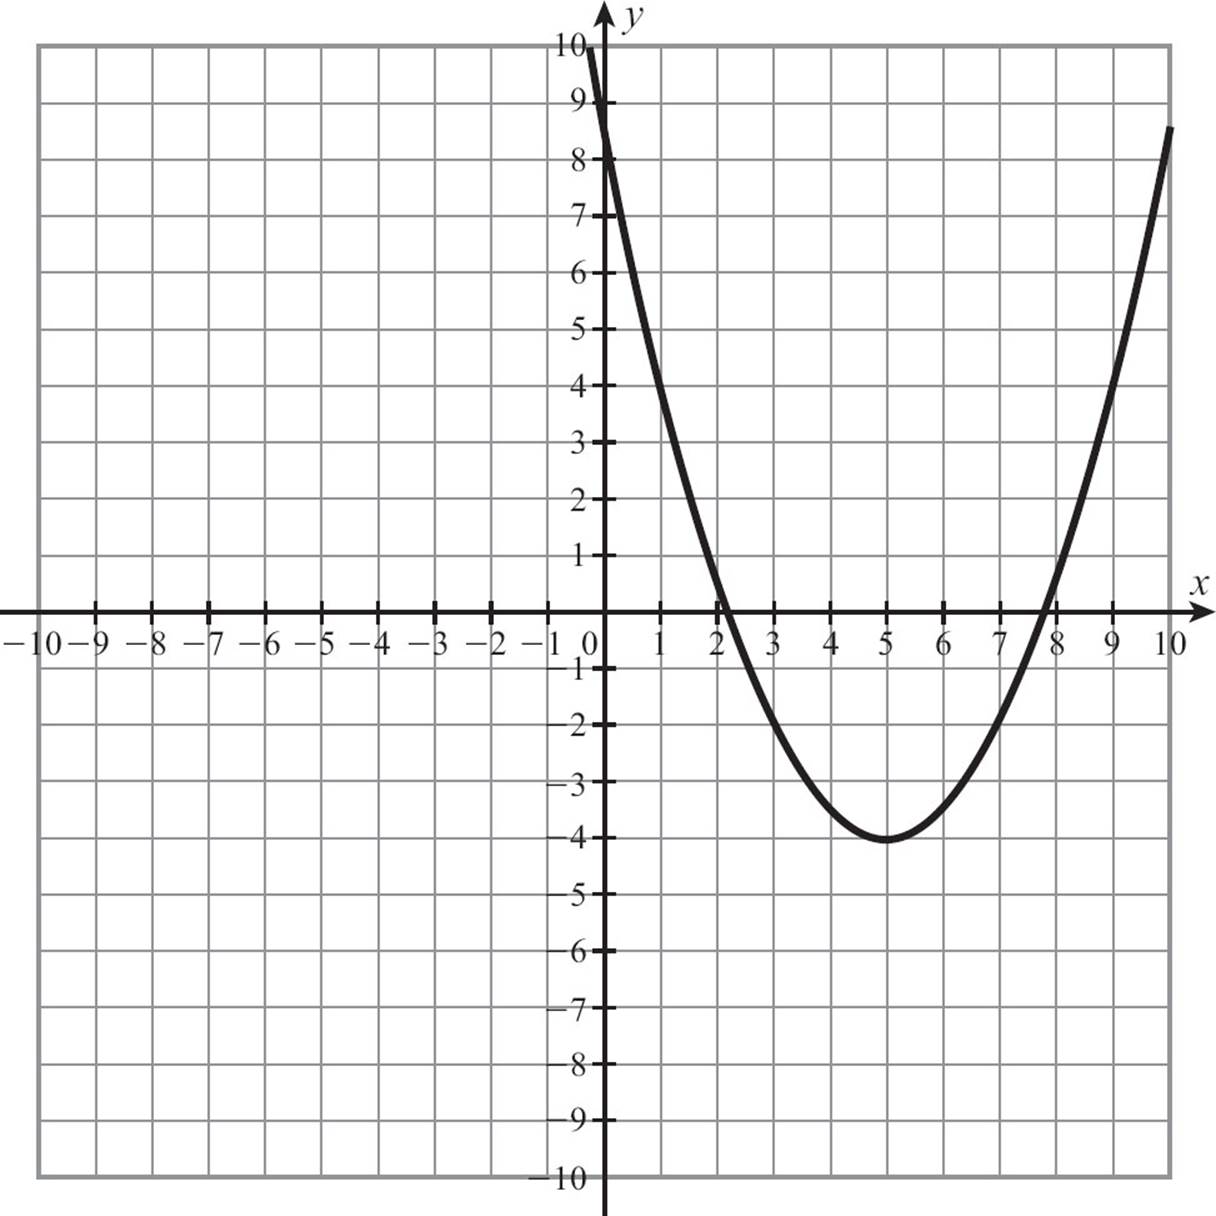
Find the equation of the parabola shown.
36. 
37. 
38. 
39. 
40. 
Vertical Motion
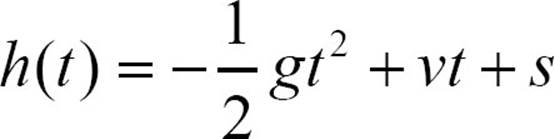
One of the most common applications of quadratic functions is as a way to examine the behavior of an object that is dropped or thrown. The function that gives the height of the object at a certain time is a quadratic function with quite a few pieces of information.
h(t) represents the height of the object at some time, t. It’s important to be clear on the units of measurement. Feet? Meters? Seconds? Minutes? You can set up an equation using customary units or metric units but you must be consistent and you must know which you’re using.
The constant g is the acceleration due to gravity, the earth’s pull on the object. This will be in feet per second per second or some similar unit. It’s a constant, but the value will depend on whether you’re measuring in customary or metric. In customary units, g ≈ 32 feet per second squared, but in metric units, g ≈ 10 meters per second squared.
![]()
THINK ABOUT IT
In the vertical motion equation, the coefficient of the squared term represents the effect of gravity on the object. It’s always negative because gravity pulls the object down, and so reduces its height.
The variable t represents the time since the object was dropped or thrown. It’s the moment at which you want to freeze the action and see where the object is.
We’re using v to represent the initial velocity of the object, the force that the person throwing the object exerts on it. If the object is dropped, v = 0. If the object is thrown upward, v is positive, but if it’s thrown downward, v will be a negative number.
Finally, s will be the symbol for the starting height of the object. Was it dropped from the roof of a building? The starting height is the height of the building. If the object is thrown, the starting height is truly the height of your hand when you release it, but often we act as though it was thrown “from the ground,” and make s = 0. That’s actually unlikely to be true—how could you throw it if it were truly on the ground?—but it is close enough in many cases.
Let’s look at a couple of examples. If an object is dropped from the top of a 150 foot tower, what is its height after 1 second?
You’re working with feet and seconds, so use g = 32 feet per second squared, and because the object is dropped, v = 0. The starting height is s = 150. Plug all the information in, and just this once, we’ll leave the units in there so you can see what happens.
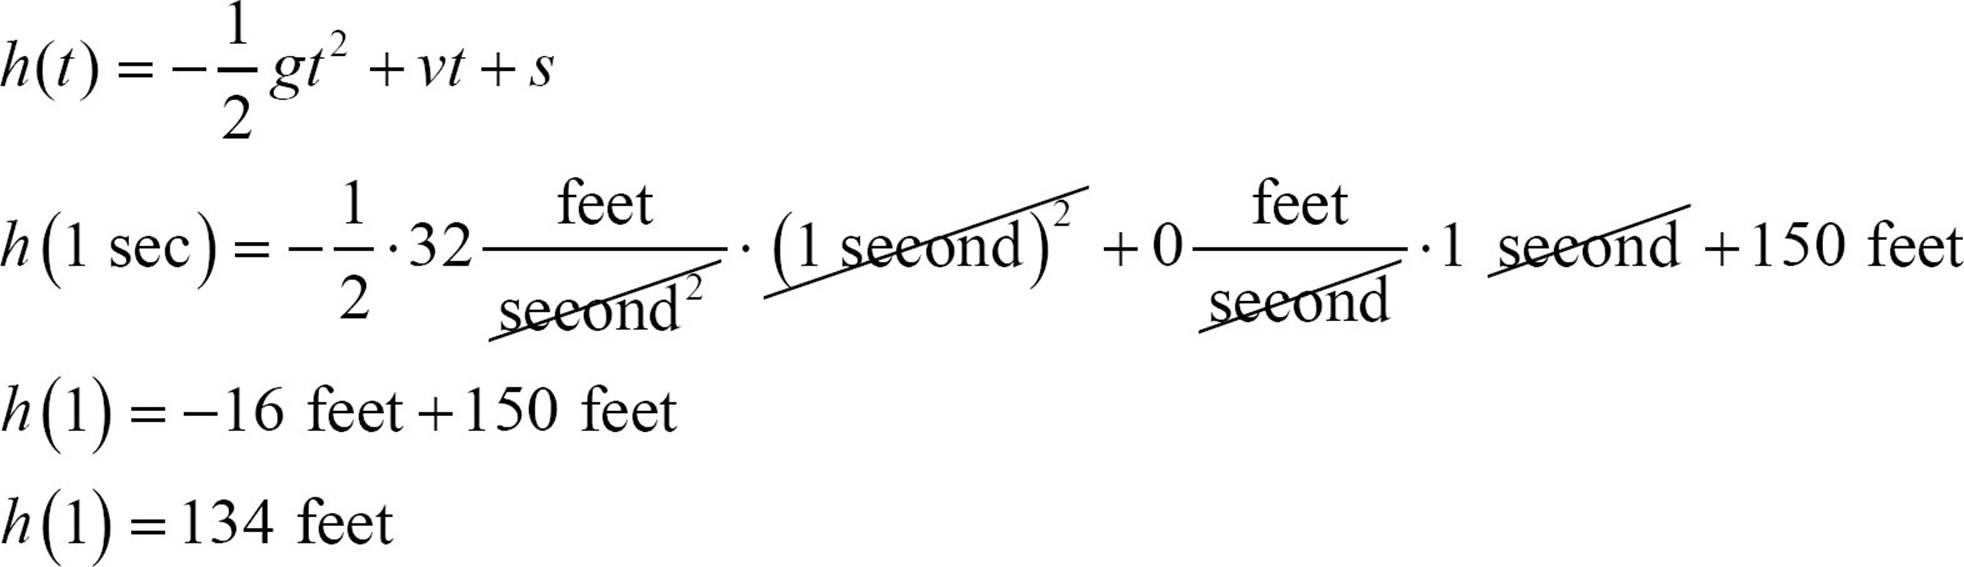
Notice how units of time get cancelled out, leaving just units of height. The first term is the work of gravity, and gravity pulled the object down 16 feet in that 1 second. The object wasn’t thrown, so the middle term just disappeared. The starting height of 150 feet is reduced by the 16 foot drop due to gravity.
Here’s a little more complicated example. If an object is thrown upward from the ground with an initial velocity of 20 meters per second, how much later will it hit the ground?
The initial velocity is 20 meters per second, so use g = 10 meters per second squared, and assume that the height of the ground is 0 feet.
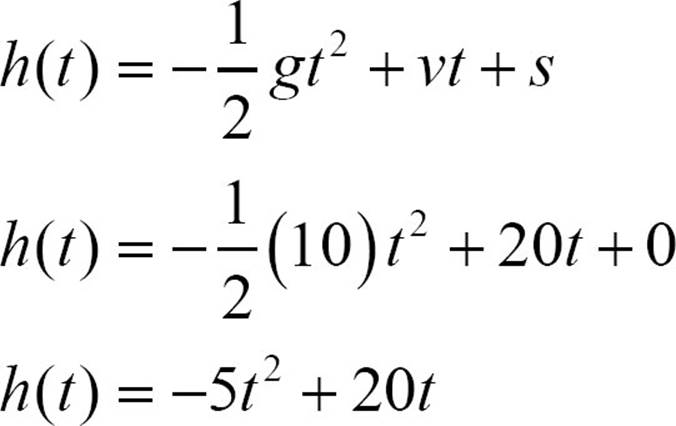
You’re looking for the time, t, when the height of the object is once again zero.
h(t) = − 5t2 + 20t
0 = − 5t2 + 20t
Solve by factoring.
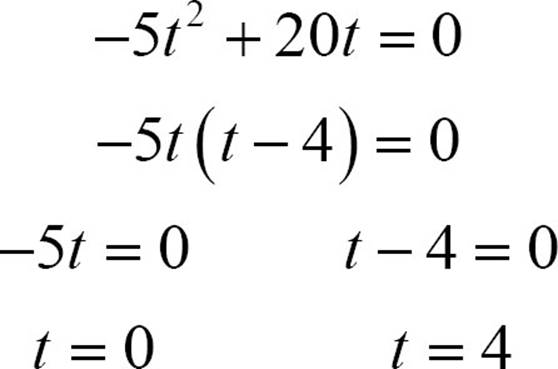
This tells you that there were two moments when the object was on the ground. When t = 0, the object is just being thrown, but the other solution, t = 4, tells you that the object will hit the ground again 4 seconds later.
![]()
TIP
Vertical motion problems, and any problems that deal with real life situations, are likely to have solutions that are not tidy integer values. Few of them will be solvable by factoring. Be ready to use the quadratic formula.
|
Type of Question |
What to Do |
|
How high is the object at this time? |
Plug in g, v, s, and t and simplify. |
|
At what time is the object this high? |
Plug in g, v, s, and h(t) and solve for t. |
|
What is the maximum height of the object? |
Plug in g, v, and s. Find the vertex of the parabola. |
![]()
CHECK POINT
For questions 41 through 43: An object is dropped from the top of a 112 foot building.
41. How long will it take to hit the ground?
42. How high is the object one second after it is released?
43. When is the object 76 feet high?
For questions 44 through 47: An object is thrown upward, beginning from a height of 5 feet, with an initial velocity of 160 feet per second.
44. How high is the object after 2 seconds?
45. What is the maximum height the object reaches?
46. When is the object 81 feet off the ground?
47. When does the object hit the ground?
For questions 48 through 50: An object is thrown downward from the top of a 75 meter tower with an initial velocity of 15 meters per second.
48. How high is the object after 0.5 seconds?
49. When is the object 20 meters high?
50. How long does it take to hit the ground?
The Least You Need to Know
· The x-coordinate of the vertex of the parabola with the equation y = ax2 + bx + c and the equation of its axis of symmetry is 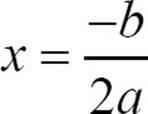 .
.
· When graphing quadratic functions, find the vertex, x-intercepts, and y-intercepts to locate the parabola.
· Use the sequence of odd numbers, multiplied by a, to help set the shape of the parabola. Make a table of values if necessary.
· For quadratic inequalities, use dotted lines for strict inequalities and solid line for “or equal to” inequalities. Shade down if y is less than the quadratic expression, and shade up if y is greater.
· For vertical motion problems, use the quadratic function 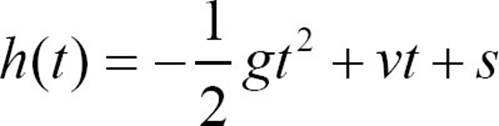 for the height of an object thrown or dropped. In the function, h is the height, t is the time, g is the acceleration due to gravity, v is the initial velocity, and s is the starting height.
· If you’re working in customary units, use g = 32 feet per second squared. If you’re using metric units, g ≈ 10 meters per second squared.