Master AP Calculus AB & BC
Part II. AP CALCULUS AB & BC REVIEW
CHAPTER 6. Applications of the Derivative
HANDS-ON ACTIVITY 6.2: THE FIRST DERIVATIVE TEST
TIP. The relationships between a function and its derivatives are all over the AP test. This is one of the most essential concepts in AP Calculus, so make sure to understand it—it’s not that hard, actually.
You might suspect that there is some kind of relationship between functions and their derivatives. Sometimes, late at night, they show up holding hands, insisting that they are “just friends. ”It’s just as you suspect—derivatives can always tell what a function is doing—they have this connection that other people envy and yearn for. You’ll learn more about this connection in the following activity.
1. Graph the function ![]() on the axes below.
on the axes below.
ALERT! A graph is not guaranteed to change direction just because it has a critical number there. However, if the graph changes direction, it needs to happen at a critical number.
2. Your goal in this exercise will be to describe where/is increasing and decreasing without depending on its graph. In other words, you want to describe the direction of f. Important fact: If a graph changes direction, the change will occur at a critical number, a number at which the derivative either equals zero or is undefined. What are the critical numbers for f?
________________________________________________________
________________________________________________________
3. What relationship do you see between the critical numbers and the direction of f?
________________________________________________________
________________________________________________________
4. The line graph below is called a wiggle graph. It is used in conjunction with critical numbers to describe a function’s direction. Label the graph below by marking off the critical numbers you found in problem 2 above. They should break the wiggle graph into three separate segments.
![]()
TIP. Whenever you use a wiggle graph, it is important to label it correctly. We will use this graph with critical numbers that came from f’(x) so the wiggle graph must be labeled f'.
5. Pick a number from each of the three segments of the wiggle graph and plug each separately into the derivative. If the result is negative, write a “-” above the corresponding segment of the wiggle graph; if the result is positive, denote it with a “+”.
6. What relationship do you see between the wiggle graph you have constructed and the graph of f?
________________________________________________________
________________________________________________________
7. Complete this statement based on your results: If a function f is increasing on an interval, then its derivative f' will be _______ there. However, if a function is decreasing, it’s derivative will be _______.
8. Consider the simple function g(x) = x2. Construct a wiggle graph for it, and give the intervals for which g is increasing.
________________________________________________________
________________________________________________________
________________________________________________________
NOTE. Creating a wiggle graph is a very easy thing to do. If you are confused by the directions, flip back and forth between the solutions, and it should be clear.
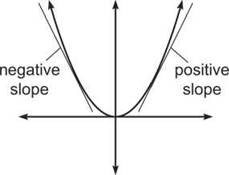
9. Graph y = x2 and draw two tangent lines to the graph—one on the interval (—∞,0) and one on (0,∞). How do the slopes of these tangent lines support your wiggle graph?
________________________________________________________
________________________________________________________
10. How could you tell from the wiggle graph of p(x) = x2 that x = 0 was a relative minimum?
________________________________________________________
________________________________________________________
11. In general, how can you tell where a relative maximum or minimum occurs using only a wiggle graph?
________________________________________________________
________________________________________________________
12. Form the wiggle graph for h(x) = 1/x2. What are the relative extrema (relative maximums or minimums) for the graph? Why?
________________________________________________________
________________________________________________________
SELECTED SOLUTIONS TO HANDS-ON ACTIVITY 6.2
2. To find critical numbers, you must first find the derivative: f'(x) = 3x2 — 5x — 2. Critical numbers occur wherever this is zero or is undefined. By factoring, you can see that f'(x) = 0 when x = —1/3 and x = 2.
NOTE. It makes sense to call maximums and minimums extrema points, because the graph takes on its most extreme values there.
3. At the x-values that represent the critical numbers, the graph seems to change direction.
4.
![]()
5. You can choose any number from each of the intervals; the numbers —1,0, and 3 are good, simple choices. Plug each into the derivative: f’(—1) = 6, f'(0) = —2, and f'(3) = 10. Therefore, mark the intervals left to right as positive, negative, and positive:
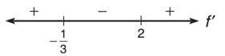
Let the meaning of the diagram sink in. You can easily calculate that f'(—1) is positive. That means that any value on the interval (∞,—1/3) will return a positive value if substituted into the derivative. Likewise, any number in the interval (—1/3,2) will return a negative value when substituted into the derivative, according to the wiggle graph.
6. Whenever the wiggle graph is positive, f is increasing, and when the graph wiggles negative, f is decreasing.
7. positive, negative
NOTE. A relative maximum is different from an absolute maximum. A relative maximum appears as a little “hump” on the graph. At the crest of that hump, the graph is at a maximum—at least relative to the points directly around it. A relative minimum appears as a “valley” in the graph.
8. g will be increasing on (0,∞), since g' is positive on that interval:
![]()
9. Whenever the graph is decreasing (in this case (—∞,0)), the tangent lines on the graph will have a negative slope. When the graph is increasing, the tangent lines have a positive slope. The wiggle graph is based on the derivative, which is defined by the slope of the tangent line.
TIP. The wiggle graph you created in problem 5 corresponds exactly with the graph of f’(x). If you graph f'(x), you’ll notice that it is a parabola that is negative on (-1/3,2) but positive elsewhere. The wiggle graph is simply a one-dimensional representation of the derivative’s graph.
10. The wiggle graph shows that the derivative changes from negative to positive at x = 0, which means that g changes from decreasing to increasing to x = 0. If a graph suddenly stops decreasing and begins increasing, the point at which it stopped must be a minimum—draw it!
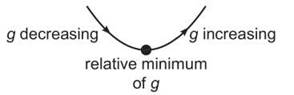
11. When the derivative changes sign, the function changes direction. Therefore, if a wiggle graph changes from + to — or vice versa, a relative extrema point has occurred.
12. You can rewrite h as x-2; therefore, h'(x) = —2x-3, or —2/x3. The derivative never equals zero; however, h' is undefined when x = 0. Therefore, x = 0 is a critical number for h. The wiggle graph looks like the following:
![]()
It looks like x = 0 should be a relative maximum, because the function changes from increasing to decreasing there. However, x = 0 is not in the domain of the original function h! x = 0 cannot be a maximum on a graph if it’s not even in the domain. This is because h(x) has a vertical asymptote at x = 0. Thus, x = 0 is not an extrema point. Because it was the only critical number (and all extrema must occur at critical numbers), there are no extrema on h.
EXERCISE 3
Directions: Solve each of the following problems. Decide which is the best of the choices given and indicate your responses in the book.
DO NOT USE A GRAPHING CALCULATOR FOR THESE PROBLEMS.
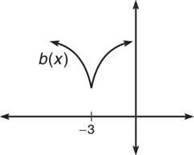
1. Draw the graph of a function, b(x), that has a relative minimum at x = —3 when b’(—3) does not exist.
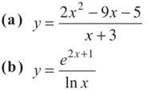
2. Give the x-values at which each of the following functions have relative extrema, and classify those extrema. Justify your answers with wiggle graphs.
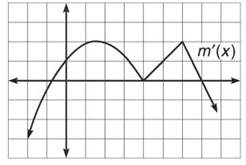
3. Given the graph below of m'(x), the derivative of m (x), describe and classify the relative extrema of m(x).
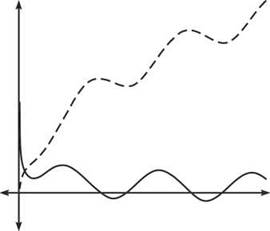
4. Below are the graphs of two functions, g(x) and g'(x). Which is which, and why?
5. If f(x) is defined as follows:
![]()
(a) Find all points of discontinuity on f(x).
(b) Determine if f’(π) exists.
(c) On what intervals is f increasing?
ANSWERS AND EXPLANATIONS
1.
2. (a) The derivative, using the Quotient Rule, is
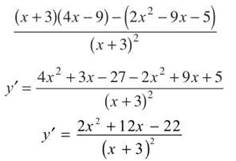
The critical numbers occur where the numerator and denominator equal 0. Clearly, the denominator is 0 when x = —3. Set the numerator equal to 0, and use the quadratic formula to get x = —3 ± √20. Plug test points from each interval into the derivative, and you get this wiggle graph:
![]()
This graph has a relative maximum at x = —3 — √20 and a relative minimum at —3 + √20.
(b) First, realize that the domain of this function is x > 0, because that is the domain of the denominator. Once again, critical numbers occur wherever the numerator or denominator of the derivative equals zero. The numerator is the natural exponential function, which never equals zero (its range is (0,∞)). However, the denominator equals 0 when x = 1. Therefore, x = 1 is the only critical number. The resulting wiggle graph looks like the following:
![]()
However, there is no relative minimum at x = 1, even though the direction of the function changes. Because x = 1 is not in the domain of the function, it cannot be an extrema point. In fact, x = 1 is a vertical asymptote for this function. There are no extrema points for this function.
3. The derivative changes from negative to positive at x ≈ — .8, meaning that the original function m changes from decreasing to increasing. Therefore, m has a relative minimum there. Using similar reasoning, m has a relative maximum at x = 7. There are no extrema points when x = 4, even though the derivative equals 0 there (making it a critical number); the derivative doesn’t actually change signs around x = 4, so the function does not change direction.
4. The dotted function is g(x). Note that whenever the dotted function reaches a relative maximum or minimum, the other graph has a value of 0 (an x-intercept occurs). Furthermore, whenever the dotted function is increasing, the solid function is positive (above the x-axis) and vice versa.
5. (a) The only possible point of discontinuity of/is at x = π—if the two graphs do not meet at that point, there will be a jump discontinuity. If you substitute x = π into each of the two pieces of the function, they both result in an output of 0, making/continuous on its entire domain [0,2π],
(b) These two functions could meet in a sharp point, causing a cusp, and no derivative would exist. To determine if a cusp occurs, you undertake a process similar to 5(a). To be continuous, both pieces had to have the same function value. To be differentiable, both pieces must have the same derivative at x = π. The derivatives are as follows:
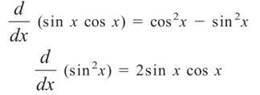
When x = π, the first rule has a derivative of 1, and the second has a derivative of 0. Because these derivatives do not match, no derivative exists on f when x = π.
(c) In order to determine direction, you need to set the derivatives found in 5(b) equal to zero and complete a wiggle graph. Because the first rule of the piecewise-defined function pertains only to[0,π), the wiggle graph on the same interval will be based on its derivative. Therefore, the interval [0,π) has critical numbers π/4 and 3π/4. Similarly, you set 2sin x cos x = 0 and plot the resulting critical numbers only on the interval [π,2π]. These critical numbers are π, 3π/2, and 2π. The final wiggle graph looks like the following:
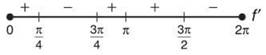
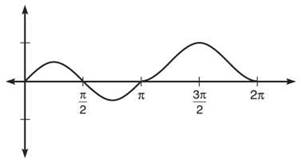
Therefore, f is increasing on ![]() In case you are skeptical, here’s the graph of f:
In case you are skeptical, here’s the graph of f: