Master AP Calculus AB & BC
Part II. AP CALCULUS AB & BC REVIEW
CHAPTER 7. Integration
HANDS-ON ACTIVITY 7.1: APPROXIMATING AREA WITH RIEMANN SUMS
There is an essential calculus tie between the integral and the area that is captured beneath a graph. You may, in fact, already know what it is. If you do, well, pin a rose on your nose. Those of you who don’t know will be kept in the dark for a couple of sections so that some suspense will build (I am nothing if not a showman). For now, let’s focus on using archaic and simplistic means to estimating the area “under” a curve. (The means are so simplistic that some students are actually disappointed. “This is calculus?” they ask, brows furrowed and tears forming in the corners of their eyes. My advice: embrace the easy. Just because a lot of calculus is tricky, not all of it has to be.) By the way, you may use your calculator freely on this activity.
1. Draw the graph of ![]() on the axes below.
on the axes below.
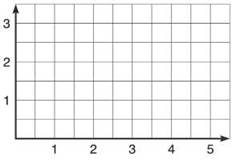
2. We are going to approximate the area between f and the x-axis from x = 0 to x = 4 using rectangles (the method of Riemann sums). This is not the entire area in the first quadrant, just most of it. Draw four inscribed rectangles of width 1 on the interval [0,4] on your graph above.
3. What are the heights of each of the four rectangles? What is the total area of the rectangles? This area, although not the same as the area beneath the curve, is an approximation for that area called the lower sum.
4. The actual area between f and the x-axis on the interval [0,4] is 28/3. Why is one area greater?
________________________________________________________
________________________________________________________
NOTE. We are not really finding the area “under” a curve. For most graphs, there is infinite area under the curve. Instead, we will be calculating the area between the given curve and the x-axis. Keep that in the back of your mind.
5. How could you get a better approximation for the area beneath the curve if you still used inscribed rectangles?
________________________________________________________
________________________________________________________
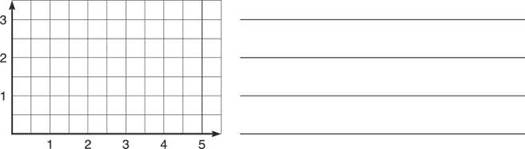
6. On the axes below, graph/again. This time, draw four rectangles of width 1 that circumscribe the graph. Use the area of the circumscribed rectangles to approximate the area beneath the curve. This approximation is called the upper sum.
7. Compare the approximation you got in number 6 to the actual area.
________________________________________________________
________________________________________________________
NOTE. Consider only the endpoints’ heights when drawing the inscribed and circumscribed rectangles because you can compare their heights very easily. Choose the lower of the two heights for the inscribed and the larger of the two heights to draw circumscribed rectangles.
8. On the axes below, graph/again, and this time draw four rectangles of width one such that the height of each rectangle is given by the midpoint of each interval. The approximate area is called the midpoint sum. 9
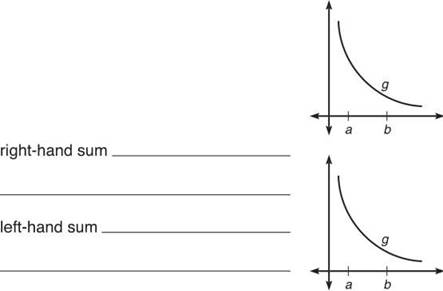
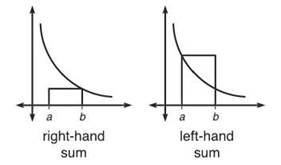
9. Now you have found an inscribed sum, a circumscribed sum, and a midpoint sum. Explain what is likely meant by each of the remaining sums, and draw a sample rectangle on [a,b] that you would use with the technique to approximate the area beneath g.
10. Use 5 rectangles of equal width and the technique of midpoint sums to approximate the area beneath the curve h(x) = x3 — 2x2 — 5x + 7 on [0,4].
Hint: To figure out the width, ∆x, of n rectangles on the interval [a,b], use the formula ![]()
SELECTED SOLUTIONS TO HANDS-ON ACTIVITY 7.1
NOTE. Every rectangle below the x-axis counts as negative area.
2. The rectangles cannot cross the graph since they are inscribed. Thus, look at the endpoints of each interval, and choose the lower of the two endpoints’ heights. That will be the height of the inscribed rectangle for that interval.
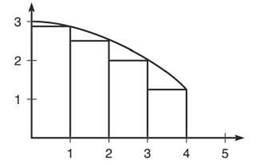
3. The heights of the four rectangles are f(1) = 2.9, f(2) = 2.6, f(3) = 2.1, and f(4) = 1.4. The area of each rectangle is height ∙ width, and each of the widths is 1. Therefore, the total combined area is 2.9 ∙ 1 + 2.6 ∙ 1 + 2.1 ∙ 1 + 1.4 ∙ 1 = 9.
4. The actual area is ![]() Our area approximation is less than the actual area because it excludes little slivers of area between the curve and the rectangles. The most area is omitted on the interval [3,4]. Thus, the approximation is lower, hence the term lower sums.
Our area approximation is less than the actual area because it excludes little slivers of area between the curve and the rectangles. The most area is omitted on the interval [3,4]. Thus, the approximation is lower, hence the term lower sums.
5. If you used more rectangles, the approximation would be much better. In fact, the more rectangles you used, the less space would be omitted and the closer the approximation.
6. In order to draw rectangles that circumscribe the graph, look at each interval separately and choose the higher endpoint height—it will give the height for that rectangle.
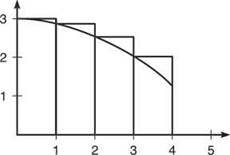
The rectangles’ total area will be 3 ∙ 1 + 2.9 ∙ 1 + 2.6 ∙ 1 + 2.1 ∙ 1 = 10.6
7. This area is too large, which was expected (upper sum). The rectangles contain more area than the curve. In fact, the error in the circumscribed rectangle method was greater than the error in the inscribed rectangle method.
8. In this case, the heights of the rectangles will be given by the function values of the midpoints of the following intervals: ![]() and
and ![]()
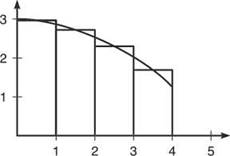
The widths of the rectangles are still 1, so the total Riemann midpoint sum is 1 ∙ 2.975 + 1 ∙ 2.775 + 1 ∙ 2.375 + 1 ∙ 1.775 = 9.9.
TIP. The right-hand sum is not always the same as the lower sum and vice versa. That is only true if the graph is monotonic decreasing, as g is in problem 9.
9. The rectangle in a right-hand sum has the same height as the function at the right-hand endpoint of each interval. Similarly, a left-hand sum rectangle has the height of the function at the left-hand endpoint on each interval.
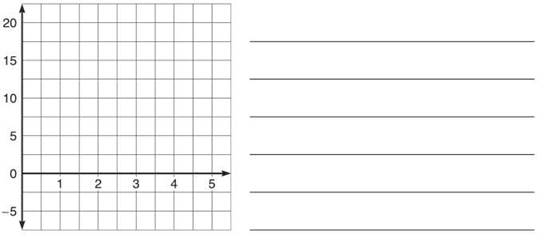
10. According to the given formula, each rectangle will have width ![]() as pictured in the below graph.
as pictured in the below graph.

TIP. Because the width of each interval is 4/5 in problem 10, you can factor that value out to simplify your arithmetic.
The five intervals in this graph are ![]() and
and  Because you’re doing midpoint sums, you should draw rectangles whose heights are given by the function values of the midpoints of those intervals:
 ![]()
![]() and
and ![]() The total area of these rectangles (and it’s no sin to use your calculator to help you out here) is
The total area of these rectangles (and it’s no sin to use your calculator to help you out here) is
![]()
EXERCISE 2
Directions: Solve each of the following problems. Decide which is the best of the choices given and indicate your responses in the book.
YOU MAY USE YOUR GRAPHING CALCULATOR FOR ALL OF THESE PROBLEMS.
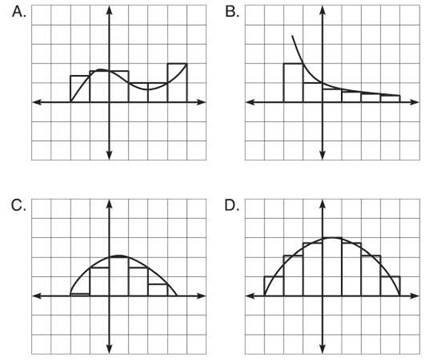
1. What type of Riemann sum is being applied in each of the following diagrams? If there is more than one correct answer, give both.
2. Approximate the area bounded by f(x) = sin x and the x-axis on the interval [0,π] using 4 rectangles and upper sums.
3. If g(x) is a continuous function that contains the values in the following table,
|
x |
0 |
1 |
2 |
3 |
4 |
5 |
6 |
7 |
8 |
|
g(x) |
2.1 |
3.6 |
5.1 |
6.3 |
6.9 |
7.2 |
7.3 |
4.0 |
3.2 |
approximate the area bounded by g(x) and the x-axis on [0,8] using
(a) 8 rectangles and right-hand sums
(b) 4 rectangles and midpoint sums
ANSWERS AND EXPLANATIONS
1. (a) Upper sums, circumscribed rectangles: On the first two rectangles, the right- hand endpoint is used to determine height, whereas the left-hand endpoint is being used for the third and fourth rectangles. Thus, it cannot be right- or left-hand sums.
(b) Lower sums, right-hand sums, inscribed rectangles: All these descriptions apply to this diagram since the right-hand endpoint of each interval forms the inscribed rectangles.
(c) Lower sums, inscribed rectangles: The lower of the two endpoints’ heights is chosen each time, not the right- or left-hand endpoint on a consistent basis.
(d) Midpoint sums: That one’s pretty clear from the diagram. The function value at each interval midpoint dictates the height of the rectangle there.
2. (a) If 4 rectangles are used, the width of each interval will be ![]() Therefore, the intervals will be
Therefore, the intervals will be ![]() and
and ![]() Because upper sums (circumscribed rectangles) are specified, the heights of the rectangles, from left to right, will be
Because upper sums (circumscribed rectangles) are specified, the heights of the rectangles, from left to right, will be ![]() as these are the higher of the two endpoint function values for each interval.
as these are the higher of the two endpoint function values for each interval.
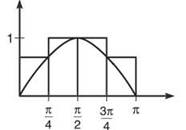
The upper sum is ![]()
NOTE. g(0) is not used in 3(a) because it is not the right-hand endpoint of any interval.
3. (a) If 8 rectangles are used, the width of each will be 1. Because right-hand sums are specified, the function value at the right endpoint of each interval dictates the height. Thus, the right-hand sum will be
1 ∙ (g(1) + g(2) + g(3) + g(4) + g(5) + g(6) + g(7) + g(8))
3.6 + 5.1 + 6.3 + 6.9 + 7.2 + 7.3 + 4.0 + 3.2 = 43.6
(b) E ach rectangle will have width ∆x = 2, so the intervals are (0,2), (2,4), (4,6), and (6,8). The midpoints of these intervals are simple, and the heights come from their function values, so the midpoint sum is
2 ∙ (g(1) + g(3) + g(5) + g(7))
2(3.6 + 6.3 + 7.2 + 4.0) = 42.2