5 Steps to a 5 AP Calculus AB & BC, 2012-2013 Edition (2011)
STEP 4. Review the Knowledge You Need to Score High
Chapter 12. Areas and Volumes
IN THIS CHAPTER
Summary: In this chapter, you will be introduced to several important applications of the definite integral. You will learn how to find the length of a curve, the area under a curve, and the volume of a solid. Some of the techniques that you will be shown include finding area under a curve by using rectangular and trapezoidal approximations, and finding the volume of a solid using cross sections, discs, and washers. These techniques involve working with algebraic expressions and lengthy computations. It is important that you work carefully through the practice problems provided in the chapter, and check your solutions with the given explanations.

Key Ideas
![]() The function
The function ![]()
![]() Rectangular Approximations
Rectangular Approximations
![]() Trapezoidal Approximations
Trapezoidal Approximations
![]() Area Under a Curve
Area Under a Curve
![]() Area Between Two Curves
Area Between Two Curves
![]() Solids with Known Cross Sections
Solids with Known Cross Sections
![]() The Disc Method
The Disc Method
![]() The Washer Method
The Washer Method
![]() Area and Arc Length for Parametric and Polar Curves
Area and Arc Length for Parametric and Polar Curves
12.1 The Function ![]()
The Second Fundamental Theorem of Calculus defines
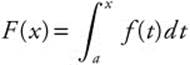
and states that if f is continuous on [a, b], then F′(x) = f(x) for every point x in [a, b].
If f ≥ 0, then F ≥ 0. F(x) can be interpreted geometrically as the area under the curve of f from t = a to t = x. (See Figure 12.1-1.)
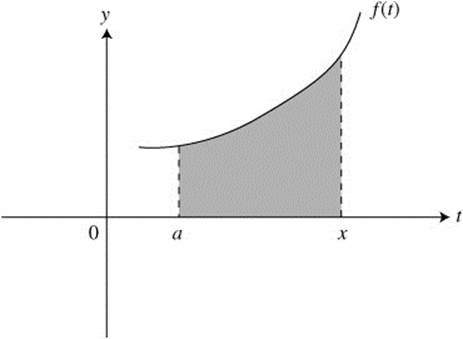
Figure 12.1-1
If f < 0, F < 0, F(x) can be treated as the negative value of the area between the curve of f and the t-axis from t = a to t = x. (See Figure 12.1-2.)
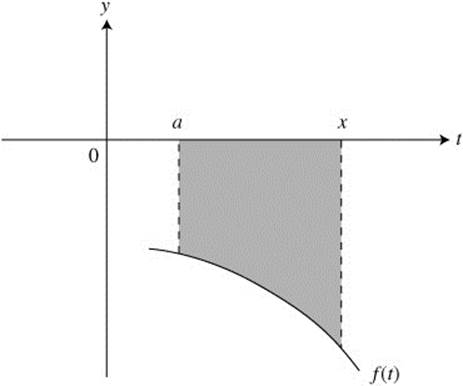
Figure 12.1-2
Example 1
If 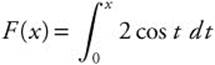 for 0 ≤ x ≤ 2π, find the value(s) of x where f has a local minimum.
Method 1: Since 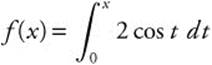 , f′(x) = 2 cos x.
Set f′(x) = 0; 2 cos x = 0, ![]() or
or ![]() .
.
f″(x) = −2 sin x and ![]() = −2 and
= −2 and 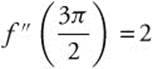 .
.
Thus, at ![]() , f has a local minimum.
, f has a local minimum.
Method 2: You can solve this problem geometrically by using area. See Figure 12.1-3.
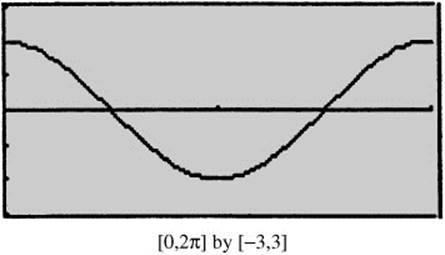
Figure 12.1-3
The area “under the curve” is above the t-axis on [0, π/2] and below the x-axis on [π/2, 3π/2]. Thus the local minimum occurs at 3π/2.
Example 2
Let 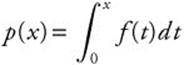 and the graph of f is shown in Figure 12.1-4.
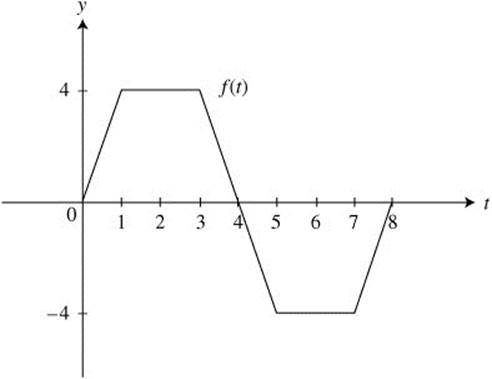
Figure 12.1-4
(a) Evaluate: p(0), p(1), p(4).
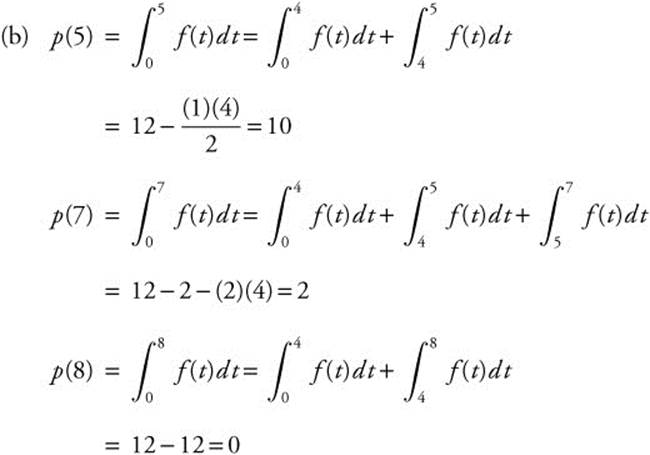
(b) Evaluate: p(5), p(7), p(8).
(c) At what value of t does p have a maximum value?
(d) On what interval(s) is p decreasing?
(e) Draw a sketch of the graph of p.
Solution:
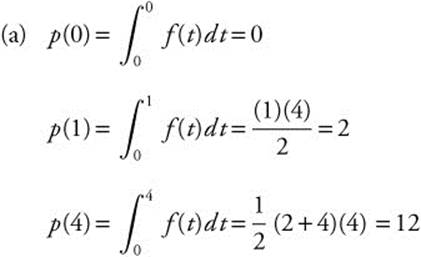
(Note: f(t) forms a trapezoid from t = 0 to t = 4.)
(c) Since f ≥ 0 on the interval [0, 4], p attains a maximum at t = 4.
(d) Since f(t) is below the x-axis from t = 4 to t = 8, if x > 4,
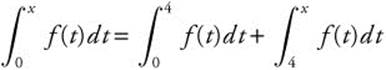 where
where 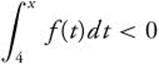 .
.
Thus, p is decreasing on the interval (4, 8).
(e) 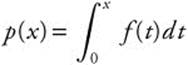 . See Figure 12.1-5 on page 262 for a sketch.
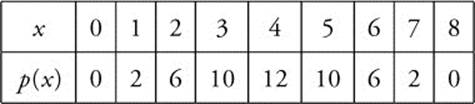
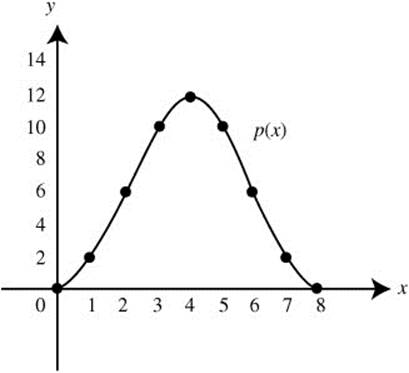
Figure 12.1-5

• Remember differentiability implies continuity, but the converse is not true, i.e., continuity does not imply differentiability, e.g., as in the case of a cusp or a corner.
Example 3
The position function of a moving particle on a coordinate axis is:
 , where t is in seconds and s is in feet.
The function f is a differentiable function and its graph is shown below in Figure 12.1-6.
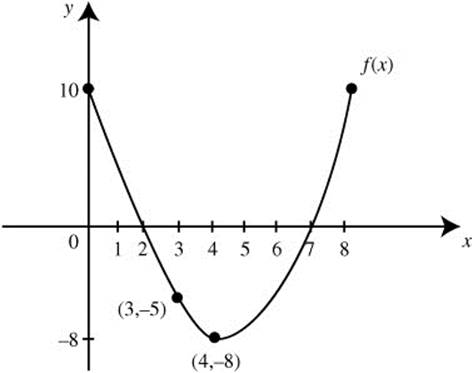
Figure 12.1-6
(a) What is the particle’s velocity at t = 4?
(b) What is the particle’s position at t = 3?
(c) When is the acceleration zero?
(d) When is the particle moving to the right?
(e) At t = 8, is the particle on the right side or left side of the origin?
Solution:
(a) Since  , then v(t) = s′(t) = f(t).
Thus, v(4) = −8 ft/sec.
(b)  ft.
ft.
(c) a(t) = v′(t). Since v′(t) = f′(t), v′(t) = 0 at t = 4. Thus, a(4) = 0 ft/sec2.
(d) The particle is moving to the right when v(t) > 0. Thus, the particle is moving to the right on intervals (0, 2) and (7, 8).
(e) The area of f below the x-axis from x = 2 to x = 7 is larger than the area of f above the x-axis from x = 0 to x = 2 and x = 7 to x = 8. Thus, 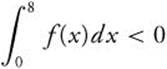 and the particle is on the left side of the origin.
• Do not forget that (fg)′ = f′g + g′ f and not f′g′. However, lim(fg) = (lim f) (lim g)
12.2 Approximating the Area Under a Curve
Main Concepts: Rectangular Approximations, Trapezoidal Approximations
Rectangular Approximations
If f ≥ 0, the area under the curve of f can be approximated using three common types of rectangles: left-endpoint rectangles, right-endpoint rectangles, or midpoint rectangles. (See Figure 12.2-1.)
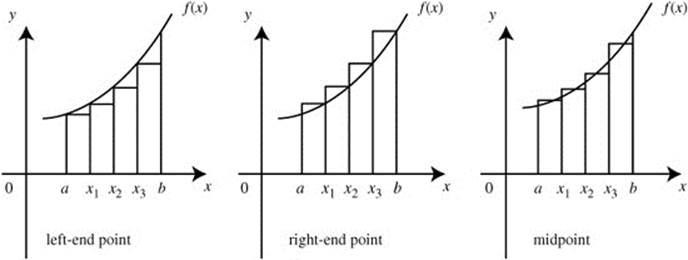
Figure 12.2-1
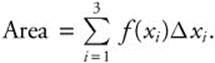
The area under the curve using n rectangles of equal length is approximately:
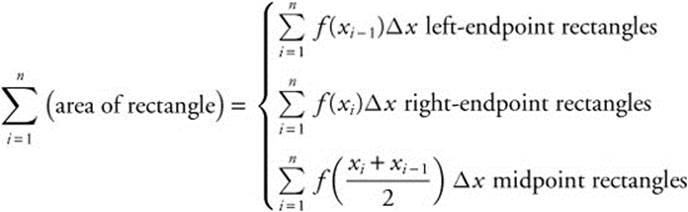
where ![]() and a = x0 < x2 < … < xn = b.
and a = x0 < x2 < … < xn = b.
If f is increasing on [a, b], then left-endpoint rectangles are inscribed rectangles and the right-endpoint rectangles are circumscribed rectangles. If f is decreasing on [a, b], then left-endpoint rectangles are circumscribed rectangles and the right-endpoint rectangles are inscribed. Furthermore,
![]() inscribed rectangle ≤ area under the curve
inscribed rectangle ≤ area under the curve  circumscribed rectangle.
Example 1
Find the approximate area under the curve of f(x) = x2 + 1 from x = 0 to x = 2, using 4 left-endpoint rectangles of equal length. (See Figure 12.2-2.)
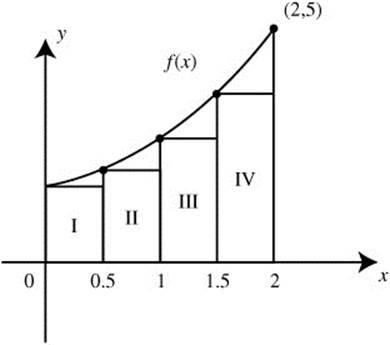
Figure 12.2-2
Let Δxi be the length of i th rectangle. The length ![]() .
.
Area under the curve 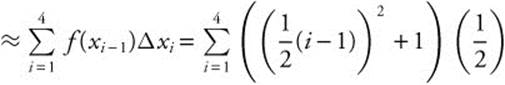 .
.
Enter ![]() and obtain 3.75.
and obtain 3.75.
Or, find the area of each rectangle:
Area of (RectI + RectII + RectIII + RectIV) = 3.75.
Thus, the approximate area under the curve of f(x) is 3.75.
Example 2
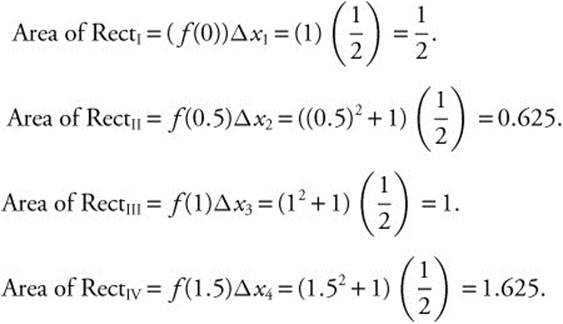
Find the approximate area under the curve of ![]() from x = 4 to x = 9 using 5 right-endpoint rectangles. (See Figure 12.2-3.)
from x = 4 to x = 9 using 5 right-endpoint rectangles. (See Figure 12.2-3.)
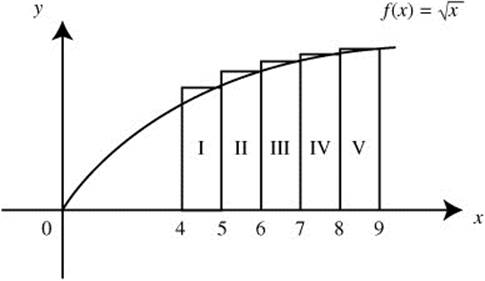
Figure 12.2-3
Let Δxi be the length of ith rectangle. The length ![]() ; xi = 4 + (1)i = 4 + i.
; xi = 4 + (1)i = 4 + i.
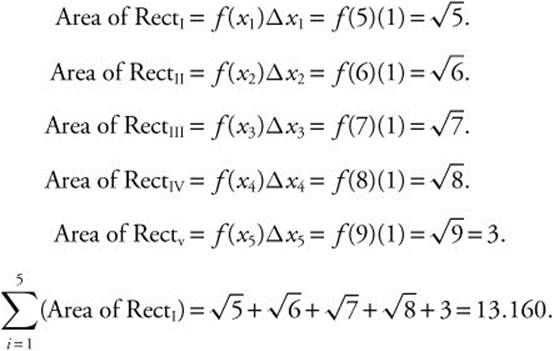
Or, using Σ notation:
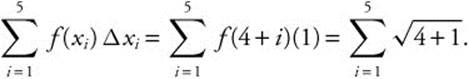
Enter ![]() and obtain 13.160.
and obtain 13.160.
Thus the area under the curve is approximately 13.160.
Example 3
The function f is continuous on [1, 9] and f > 0. Selected values of f are given below:
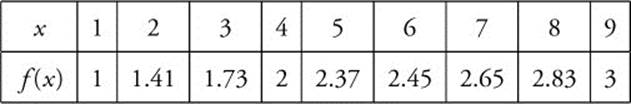
Using 4 midpoint rectangles, approximate the area under the curve of f for x = 1 to x = 9. (See Figure 12.2-4.)
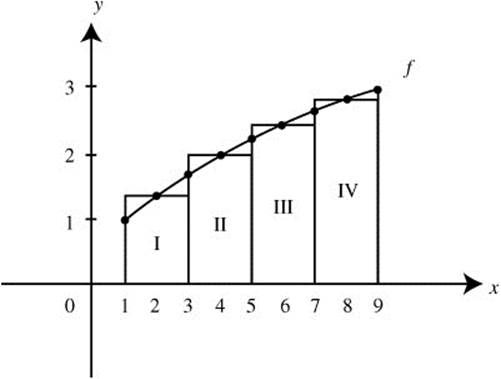
Figure 12.2-4
Let Δxi be the length of i th rectangle. The length ![]() .
.
Area of RectI = f(2)(2) = (1.41)2 = 2.82.
Area of RectII = f(4)(2) = (2)2 = 4.
Area of RectIII = f(6)(2) = (2.45)2 = 4.90.
Area of RectIV = f(8)(2) = (2.83)2 = 5.66.
Area of (RectI + RectII + RectIII + RectIV) = 2.82 + 4 + 4.90 + 5.66 = 17.38.
Thus the area under the curve is approximately 17.38.
Trapezoidal Approximations
Another method of approximating the area under a curve is to use trapezoids. See Figure 12.2-5.
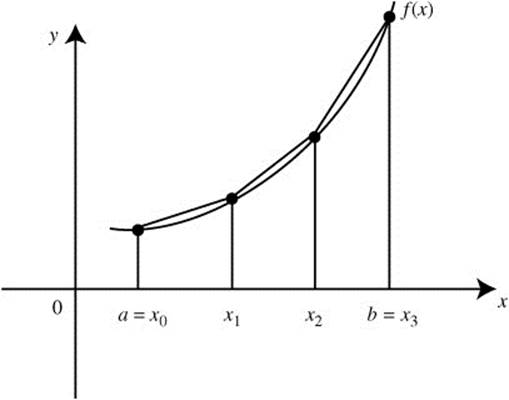
Figure 12.2-5
Formula for Trapezoidal Approximation
If f is continuous, the area under the curve of f from x = a to x = b is:
![]()
Example 1
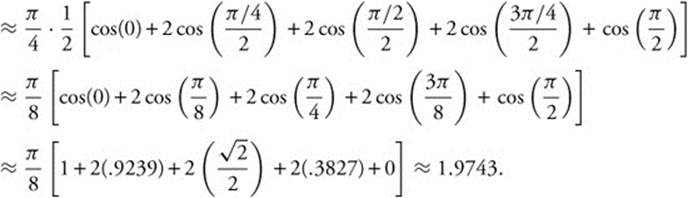
Find the approximate area under the curve of ![]() from x = 0 to x = π; using 4 trapezoids. (See Figure 12.2-6.)
from x = 0 to x = π; using 4 trapezoids. (See Figure 12.2-6.)
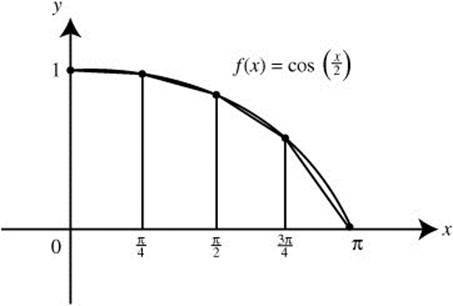
Figure 12.2-6
Since n = 4, ![]() .
.
Area under the curve:
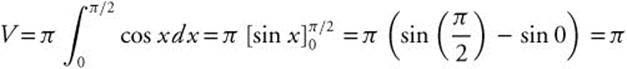
• When using a graphing calculator in solving a problem, you are required to write the setup that leads to the answer. For example, if you are finding the volume of a solid, you must write the definite integral and then use the calculator to compute the numerical value, e.g., ![]() . Simply indicating the answer without writing the integral would get you only one point for the answer. And you will not get full credit for the problem.
. Simply indicating the answer without writing the integral would get you only one point for the answer. And you will not get full credit for the problem.
12.3 Area and Definite Integrals
Main Concepts: Area Under a Curve, Area Between Two Curves
Area Under a Curve
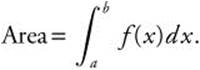
If y = f(x) is continuous and non-negative on [a, b], then the area under the curve of f from a to b is:
If f is continuous and f < 0 on [a, b], then the area under the curve from a to b is:
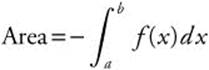 . See Figure 12.3-1.
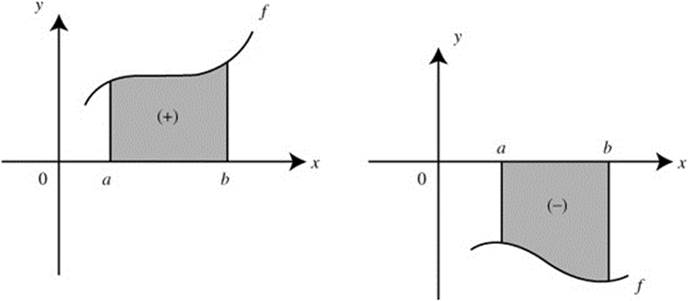
Figure 12.3-1
If x = g(y) is continuous and non-negative on [c, d], then the area under the curve of g from c to d is:
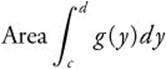 . See Figure 12.3-2.
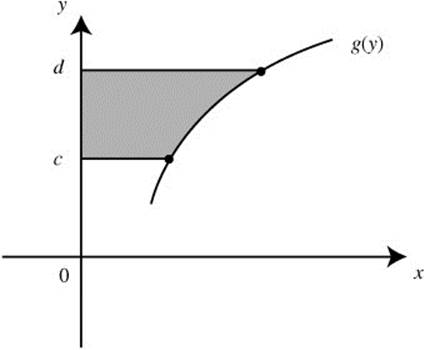
Figure 12.3-2
Example 1
Find the area under the curve of f(x) = (x − 1)3 from x = 0 to x = 2.
Step 1. Sketch the graph of f(x). See Figure 12.3-3.
Figure 12.3-3
Step 2. Set up integrals.
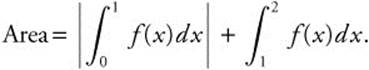
Step 3. Evaluate the integrals.
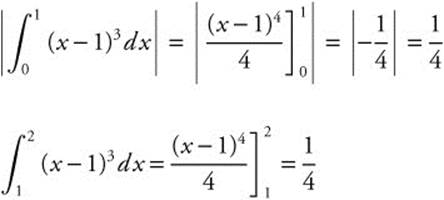
Thus, the total area is ![]() .
.
Another solution is to find the area using a calculator.
Enter  and obtain
 ![]() .
.
Example 2
Find the area of the region bounded by the graph of f(x) = x2 − 1, the lines x = −2 and x = 2, and the x-axis.
Step 1. Sketch the graph of f(x). See Figure 12.3-4.
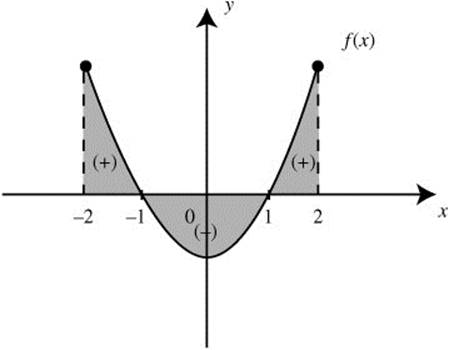
Figure 12.3-4
Step 2. Set up integrals.
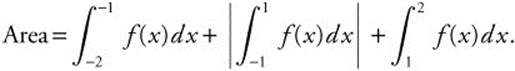
Step 3. Evaluate the integrals.
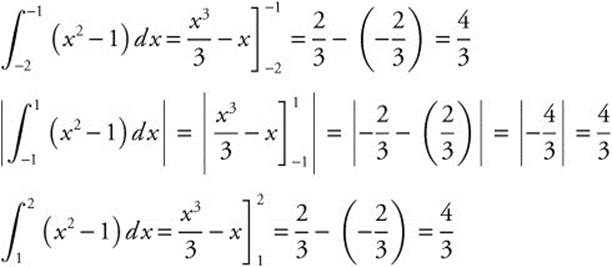
Thus, the total ![]()
Note: Since f(x) = x2 − 1 is an even function, you can use the symmetry of the graph and set 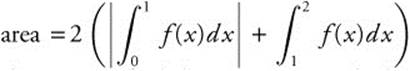 .
.
An alternate solution is to find the area using a calculator.
Enter 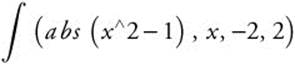 and obtain 4.
Example 3
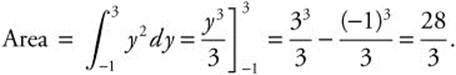
Find the area of the region bounded by x = y2, y = −1, and y = 3. See Figure 12.3-5.
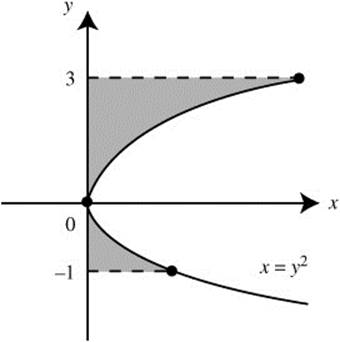
Figure 12.3-5
Example 4
Using a calculator, find the area bounded by f(x) = x3 + x2 − 6x and the x-axis. See Figure 12.3-6.
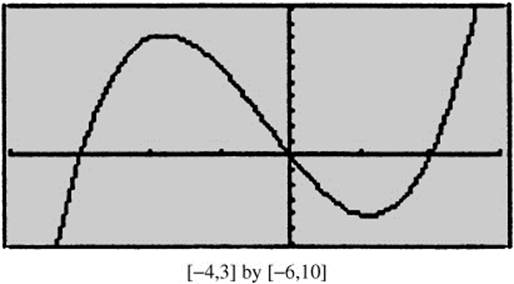
Figure 12.3-6
Step 1. Enter y1 = x^3 + x^2 − 6x.
Step 2. Enter 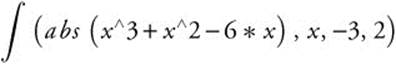 and obtain 21.083.
Example 5
The area under the curve y = ex from x = 0 to x = k is 1. Find the value of k.
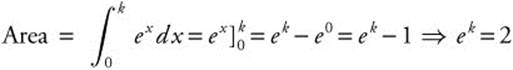 . Take ln of both sides:
ln(ek) = ln 2; k = ln 2.
Example 6
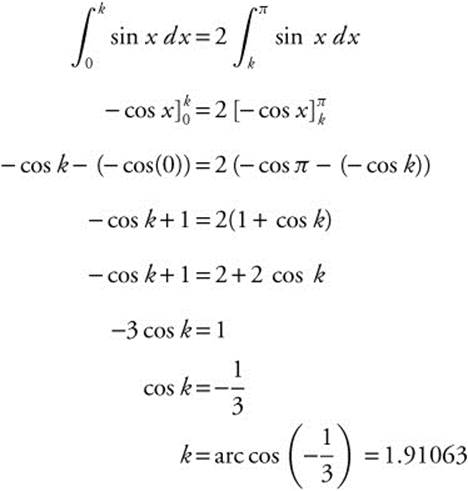
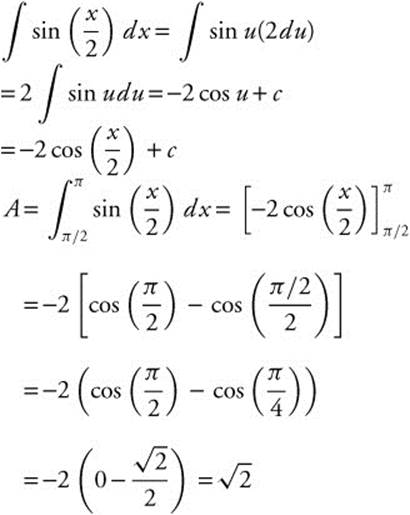
The region bounded by the x-axis, and the graph of y = sin x between x = 0 and x = π is divided into 2 regions by the line x = k. If the area of the region for 0 ≤ x ≤ k is twice the area of the region k ≤ x ≤ π, find k. (See Figure 12.3-7.)
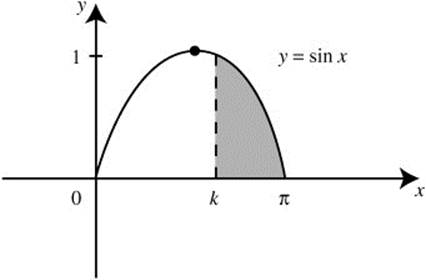
Figure 12.3-7
Area Between Two Curves
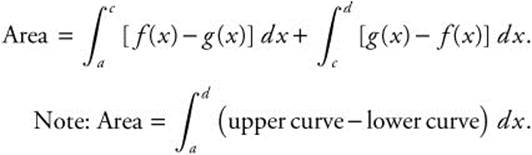
Area Bounded by Two Curves: See Figure 12.3-8.
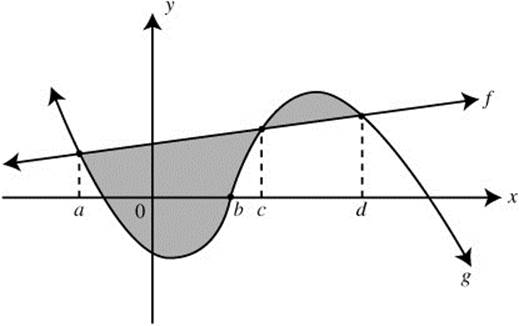
Figure 12.3-8
Example 1
Find the area of the region bounded by the graphs of f(x) = x3 and g(x) = x. (See Figure 12.3-9.)
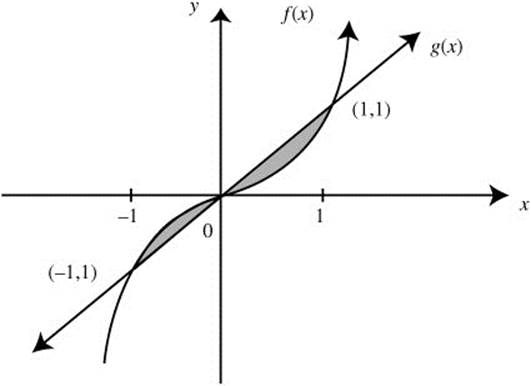
Figure 12.3-9
Step 1. Sketch the graphs of f(x) and g(x).
Step 2. Find the points of intersection.
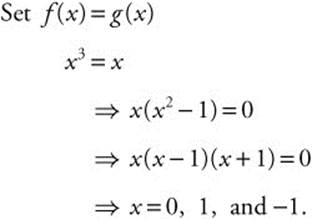
Step 3. Set up integrals.
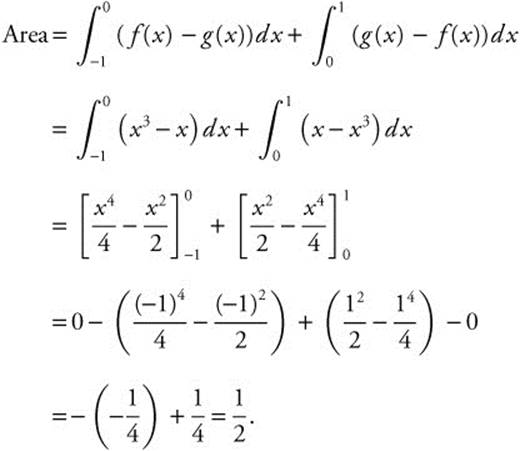
Note: You can use the symmetry of the graphs and let 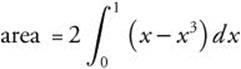 .
.
An alternate solution is to find the area using a calculator. Enter 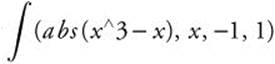
and obtain ![]() .
.
Example 2
Find the area of the region bounded by the curve y = ex, the y-axis and the line y = e2.
Step 1. Sketch a graph. (See Figure 12.3-10.)
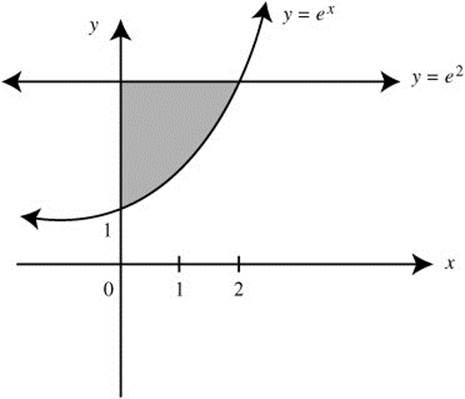
Figure 12.3-10
Step 2. Find the point of intersection. Set e2 = ex ⇒ x = 2.
Step 3. Set up an integral:
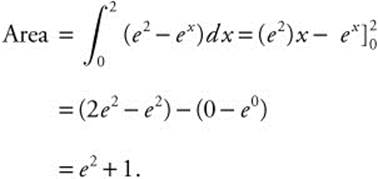
Or using a calculator, enter 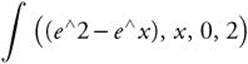 and obtain (e2 + 1).
Example 3
Using a calculator, find the area of the region bounded by y = sin x and ![]() between 0 ≤ x ≤ π.
between 0 ≤ x ≤ π.
Step 1. Sketch a graph. (See Figure 12.3-11.)
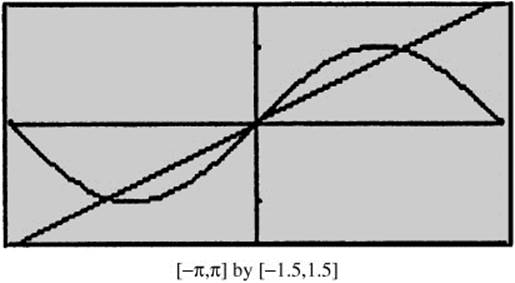
Figure 12.3-11
Step 2. Find the points of intersection.
Using the [Intersection] function of the calculator, the intersection points are x = 0 and x = 1.89549.
Step 3. Enter nInt(sin(x) −.5x, x, 0, 1.89549) and obtain 0.420798 ≈ 0.421.
(Note: You could also use the ![]() function on your calculator and get the same result.)
function on your calculator and get the same result.)
Example 4
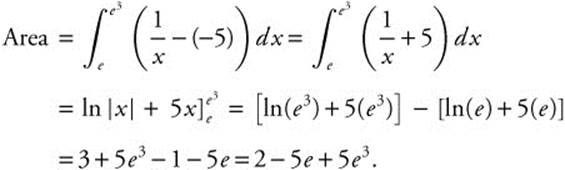
Find the area of the region bounded by the curve xy = 1 and the lines y = −5, x = e, and x = e3.
Step 1. Sketch a graph. (See Figure 12.3-12.)
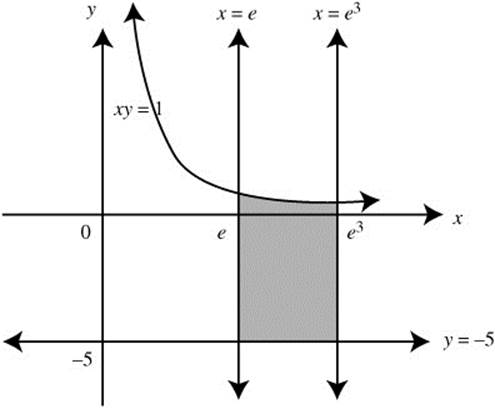
Figure 12.3-12
Step 2. Set up an integral.
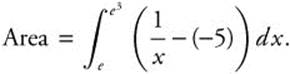
Step 3. Evaluate the integral.
• Remember: if f′ > 0, then f is increasing, and if f″ > 0 then the graph of f is concave upward.
12.4 Volumes and Definite Integrals
Main Concepts:
Solids with Known Cross Sections, The Disc Method, The Washer Method
Solids with Known Cross Sections
If A(x) is the area of a cross section of a solid and A(x) is continuous on [a, b], then the volume of the solid from x = a to x = b is:
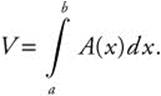
(See Figure 12.4-1.)
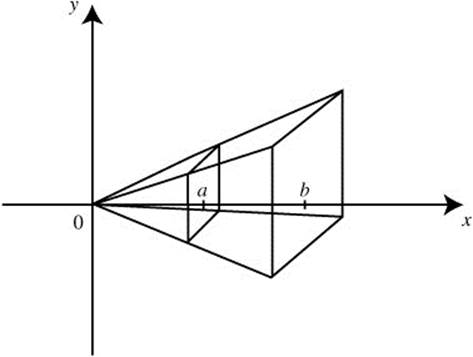
Figure 12.4-1
Note: A cross section of a solid is perpendicular to the height of the solid.
Example 1
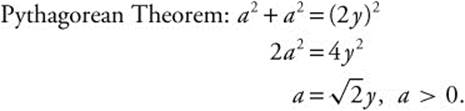
The base of a solid is the region enclosed by the ellipse 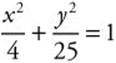 . The cross sections are perpendicular to the x-axis and are isosceles right triangles whose hypotenuses are on the ellipse. Find the volume of the solid. (See Figure 12.4-2.)
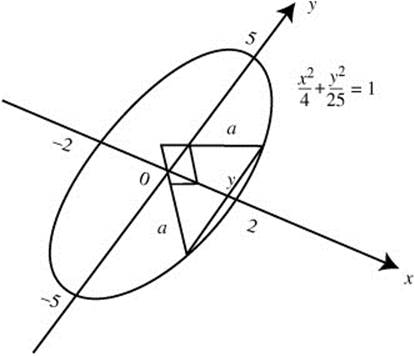
Figure 12.4-2
Step 1. Find the area of a cross section A(x).
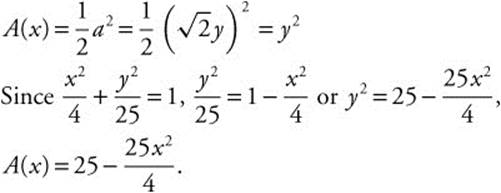
Step 2. Set up an integral.
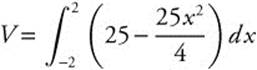
Step 3. Evaluate the integral.
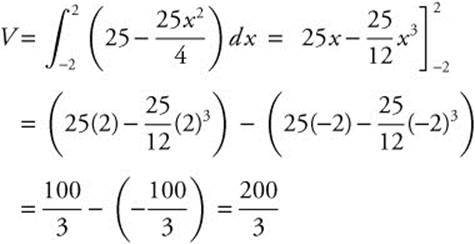
The volume of the solid is ![]() .
.
Verify your result with a graphing calculator.
Example 2
Find the volume of a pyramid whose base is a square with a side of 6 feet long, and a height of 10 feet. (See Figure 12.4-3.)
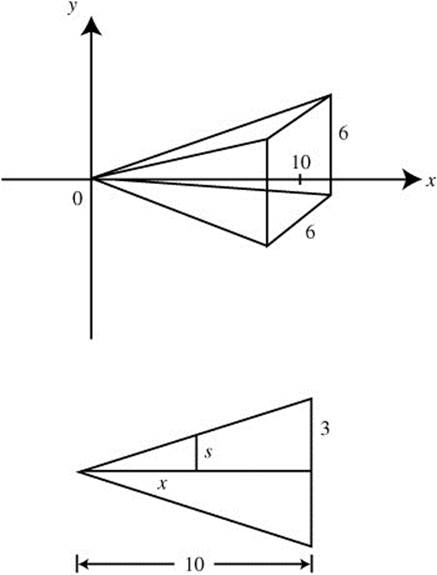
Figure 12.4-3
Step 1. Find the area of a cross section A(x). Note each cross section is a square of side 2s.
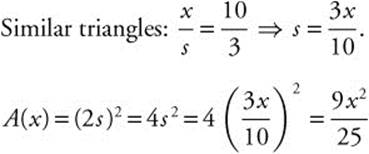
Step 2. Set up an integral.
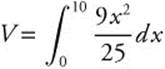
Step 3. Evaluate the integral.
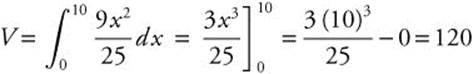
The volume of the pyramid is 120 ft3.
Example 3
The base of a solid is the region enclosed by a triangle whose vertices are (0, 0), (4, 0) and (0, 2). The cross sections are semicircles perpendicular to the x-axis. Using a calculator, find the volume of the solid. (See Figure 12.4-4.)
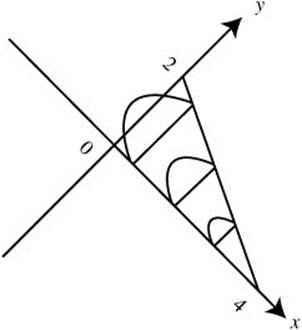
Figure 12.4-4
Step 1. Find the area of a cross section.
Equation of the line passing through (0, 2) and (4, 0):
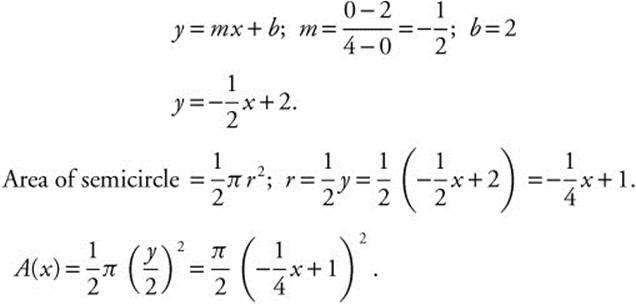
Step 2. Set up an integral.
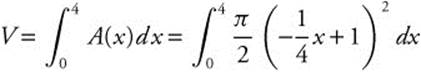
Step 3. Evaluate the integral.
Enter 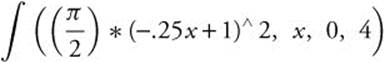 and obtain 2.0944.
Thus the volume of the solid is 2.094.
• Remember: if f′ < 0, then f is decreasing, and if f″ < 0 then the graph of f is concave downward.
The Disc Method
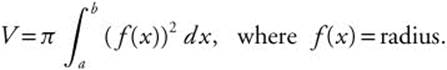
The volume of a solid of revolution using discs:
Revolving about the x-axis:
Revolving about the y-axis:
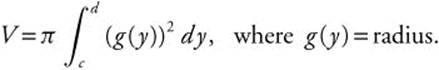
(See Figure 12.4-5.)
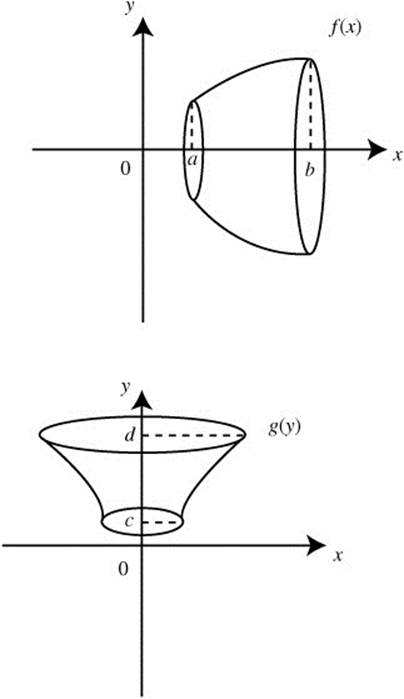
Figure 12.4-5
Revolving about a line y = k:
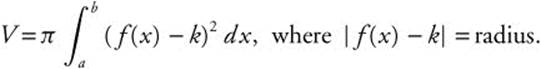
Revolving about a line x = h:
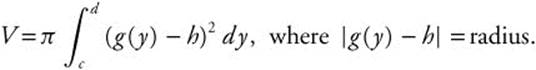
(See Figure 12.4-6.)
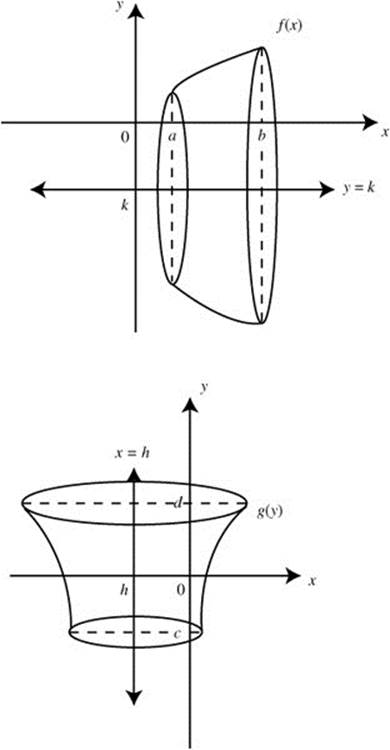
Figure 12.4-6
Example 1
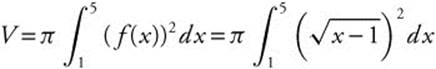
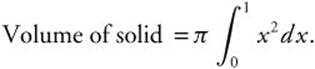
Find the volume of the solid generated by revolving about the x-axis the region bounded by the graph of ![]() , the x-axis, and the line x = 5.
, the x-axis, and the line x = 5.
Step 1. Draw a sketch. (See Figure 12.4-7.)
Figure 12.4-7
Step 2. Determine the radius of a disc from a cross section.
![]()
Step 3. Set up an integral.
Step 4. Evaluate the integral.
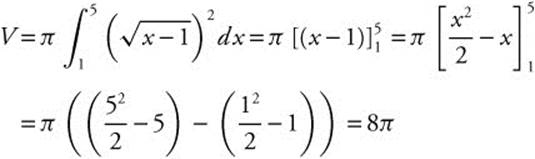
Verify your result with a calculator.
Example 2
Find the volume of the solid generated by revolving about the x-axis the region bounded by the graph of ![]() , the x-axis, and the y-axis.
, the x-axis, and the y-axis.
Step 1. Draw a sketch. (See Figure 12.4-8.)
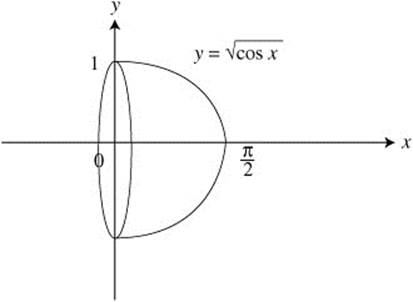
Figure 12.4-8
Step 2. Determine the radius from a cross section.
![]()
Step 3. Set up an integral.
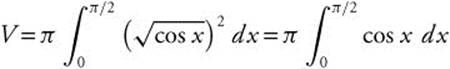
Step 4. Evaluate the integral.
Thus, the volume of the solid is π.
Verify your result with a calculator.
Example 3
Find the volume of the solid generated by revolving about the y-axis the region in the first quadrant bounded by the graph of y = x2, the y-axis, and the line y = 6.
Step 1. Draw a sketch. (See Figure 12.4-9.)
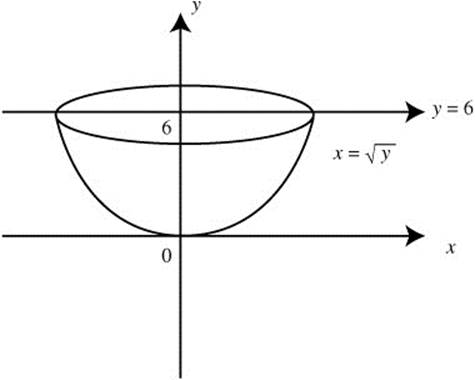
Figure 12.4-9
Step 2. Determine the radius from a cross section.
![]()
![]() is the part of the curve involved in the region.
is the part of the curve involved in the region.
![]()
Step 3. Set up an integral.
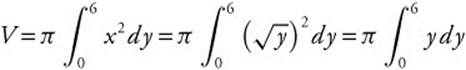
Step 4. Evaluate the integral.
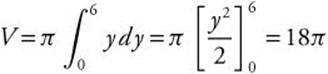
The volume of the solid is 18π.
Verify your result with a calculator.
Example 4
Using a calculator, find the volume of the solid generated by revolving about the line y = 8 the region bounded by the graph of y = x2 + 4, and the line y = 8.
Step 1. Draw a sketch. (See Figure 12.4-10.)
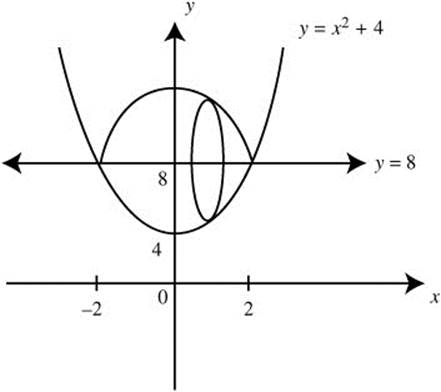
Figure 12.4-10
Step 2. Determine the radius from a cross section.
r = 8 − y = 8 − (x2 + 4) = 4 − x2
Step 3. Set up an integral.
To find the intersection points, set 8 = x2 + 4 ⇒ x = ± 2.
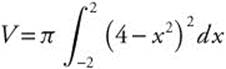
Step 4. Evaluate the integral.
Enter 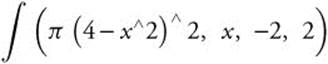 and obtain
 ![]() π.
π.
Thus, the volume of the solid is ![]() π.
π.
Verify your result with a calculator.
Example 5
Using a calculator, find the volume of the solid generated by revolving about the line y = −3 the region bounded by the graph of y = ex, the y-axis, and the lines x = ln 2 and y = −3.
Step 1. Draw a sketch. (See Figure 12.4-11.)
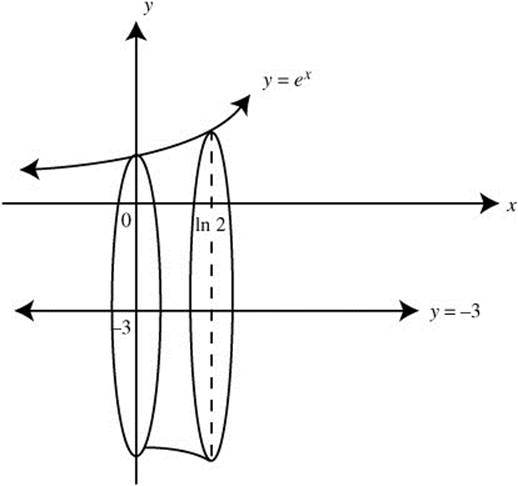
Figure 12.4-11
Step 2. Determine the radius from a cross section.
r = y − (−3) = y + 3 = ex + 3
Step 3. Set up an integral.
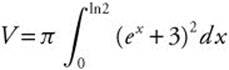
Step 4. Evaluate the integral.
Enter  and obtain
  .
.
The volume of the solid is approximately 13.7383π.
• Remember: if f′ is increasing, then f″ > 0 and the graph of f is concave upward.
The Washer Method
The volume of a solid (with a hole in the middle) generated by revolving a region bounded by 2 curves:
About the x-axis:
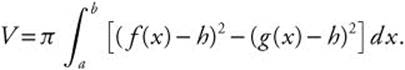
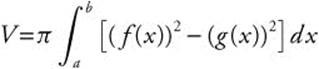 ; where f(x) = outer radius and g(x) = inner radius.
About the y-axis:
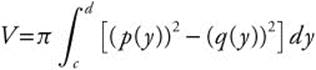 ; where p(y) = outer radius and q(y) = inner radius.
About a line x = h:
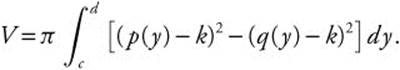
About a line y = k:
Example 1
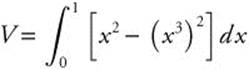
Using the Washer Method, find the volume of the solid generated by revolving the region bounded by y = x3 and y = x in the first quadrant about the x-axis.
Step 1. Draw a sketch. (See Figure 12.4-12.)
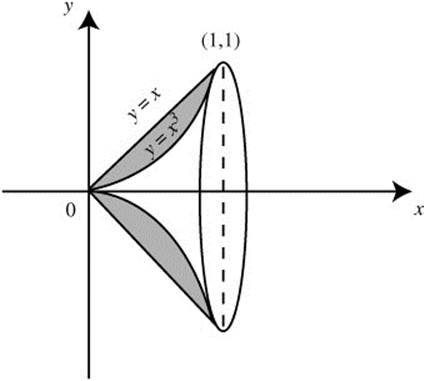
Figure 12.4-12
To find the points of intersection, set x = x3 ⇒ x3 − x = 0 or x(x2 − 1) = 0, or x = −1, 0, 1. In the first quadrant x = 0, 1.
Step 2. Determine the outer and inner radii of a washer, whose outer radius = x; and inner radius = x3.
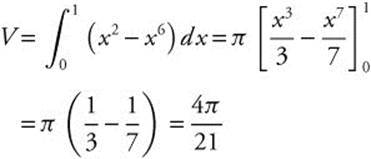
Step 3. Set up an integral.
Step 4. Evaluate the integral.
Verify your result with a calculator.
Example 2
Using the Washer Method and a calculator, find the volume of the solid generated by revolving the region in Example 1 about the line y = 2.
Step 1. Draw a sketch. (See Figure 12.4-13.)
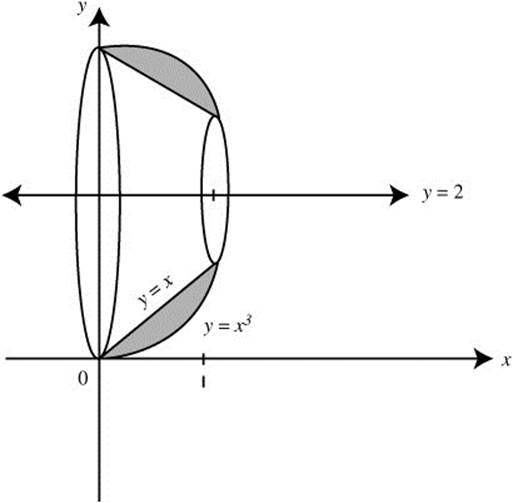
Figure 12.4-13
Step 2. Determine the outer and inner radii of a washer.
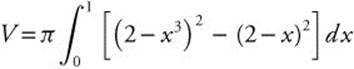
The outer radius = (2 − x3) and inner radius = (2 − x).
Step 3. Set up an integral.
Step 4. Evaluate the integral.
Enter 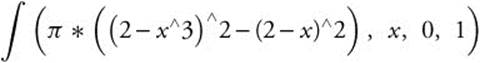 and obtain
 ![]() .
.
The volume of the solid is ![]() .
.
Example 3
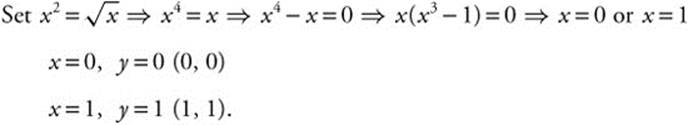
Using the Washer Method and a calculator, find the volume of the solid generated by revolving the region bounded by y = x2 and x = y2 about the y-axis.
Step 1. Draw a sketch. (See Figure 12.4-14.)
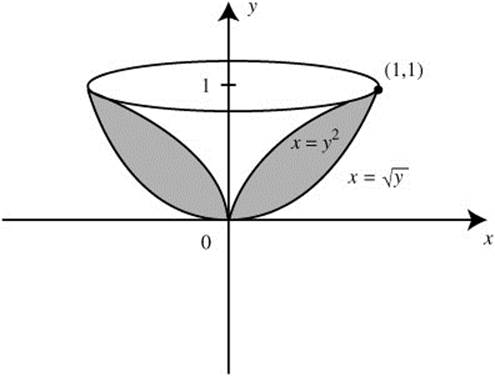
Figure 12.4-14
Intersection points: ![]() .
.
Step 2. Determine the outer and inner radii of a washer, with outer radius:
![]() and inner radius: x = y2.
and inner radius: x = y2.
Step 3. Set up an integral.
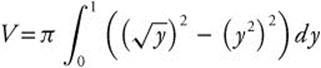
Step 4. Evaluate the integral.
Enter 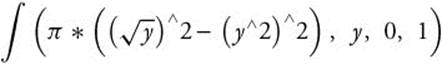 and obtain
 ![]() .
.
The volume of the solid is ![]() .
.

12.5 Integration of Parametric, Polar, and Vector Curves
Main Concepts:
Area, Arc Length, and Surface Area for Parametric Curves; Area and Arc Length for Polar Curves; Integration of a Vector-Valued Function
Area, Arc Length, and Surface Area for Parametric Curves
Area for Parametric Curves
For a curve defined parametrically by x = f(t) and y = g(t), the area bounded by the portion of the curve between t = α and t = β is  .
.
Example 1
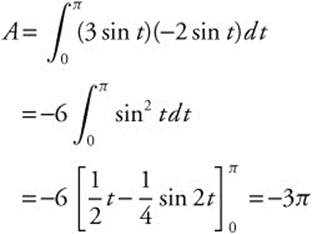
Find the area bounded by x = 2 sin t, y = 3 sin2 t.
Step 1: Determine the limits of integration. The symmetry of the graph allows us to integrate from t = 0 to t = π/2 and multiply by 2.
Step 2: Differentiate ![]() .
.
Step 3: 
Arc Length for Parametric Curves
The length of that arc is  .
.
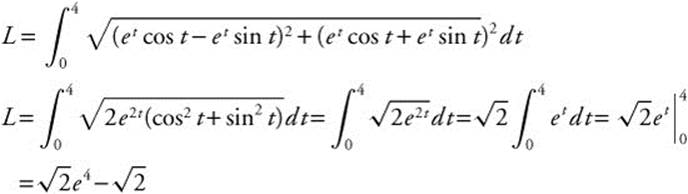
Example 2
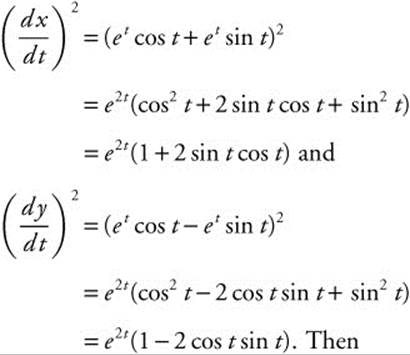
Find the length of the arc defined by x = et cos t and y = et sin t from t = 0 to t = 4.
Step 1: Differentiate ![]() and
and ![]()
Step 2:
Surface Area for Parametric Curves
The surface area created when that arc is revolved about the x-axis is
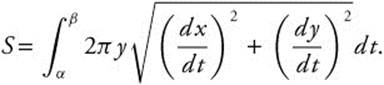
Example 3
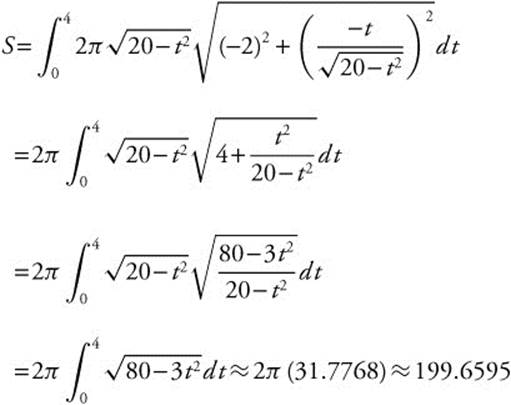
Find the area of the surface generated by revolving about the x-axis the arc defined by x = 3 − 2t and ![]() when 0 ≤ t ≤ 4.
when 0 ≤ t ≤ 4.
Step 1: Differentiate ![]() and
and 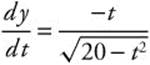 .
.
Step 2:
Area and Arc Length for Polar Curves
Area for Polar Curves
If r = f(θ) is a continuous polar curve on the interval α ≤ θ ≤ β and α < β < α + 2π, then the area enclosed by the polar curve is 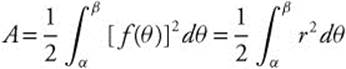 .
.
Example 1
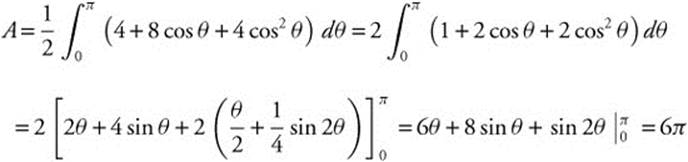
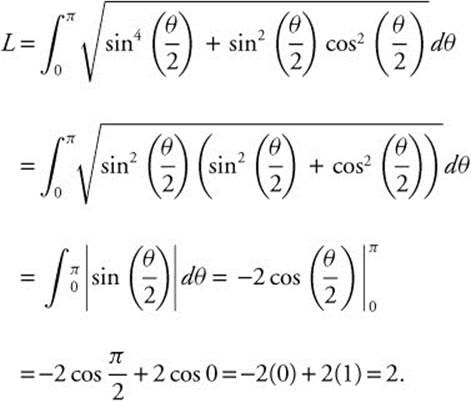
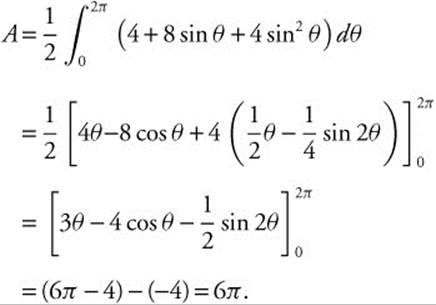
Find the area enclosed by r = 2 + 2 cos θ on the interval from θ = 0 to θ = π.
Step 1: Square r2 = 4 + 8 cos θ + 4 cos2 θ.
Step 2:
Arc Length for Polar Curves
For a polar graph defined on a interval (α, β), if the graph does not retrace itself in that interval and if ![]() is continuous, then the length of the arc from θ = α to θ = β is
is continuous, then the length of the arc from θ = α to θ = β is 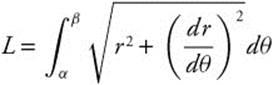 .
.
Example 2
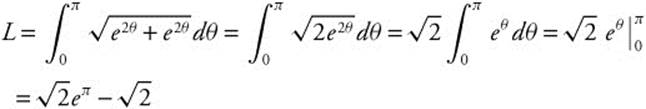
Find the length of the spiral r = eθ from θ = 0 to θ = π.
Step 1: Differentiate ![]() .
.
Step 2: Square r2 = e2θ.
Step 3:
Integration of a Vector-Valued Function
Integrating a Vector Function
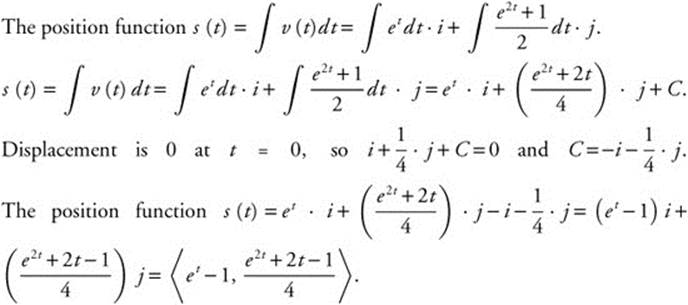
For a vector-valued function r(t) = ⟨x(t), y(t)⟩, ∫ r(t) dt = ∫ x(t) dt · i + ∫ y(t) dt · j.
Example 1
The acceleration vector of a particle at any time ![]() . If at time t = 0, its velocity is i + j and its displacement is 0, find the functions for the position and velocity at any time t.
. If at time t = 0, its velocity is i + j and its displacement is 0, find the functions for the position and velocity at any time t.
Step 1:
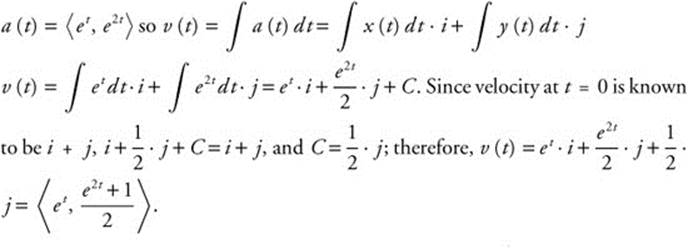
Step 2:
Length of a Vector Curve
The length of a curve defined by the vector-valued function r(t) = ⟨x(t), y(t)⟩ traced from  .
.
Example 2
Find the length of the curve r (t) = ⟨2 sin t, 5t⟩ from t = 0 to t = π.
Step 1: r′(t) = ⟨2 cos t, 5⟩
Step 2: ![]()
Step 3: With the aid of a graphing calculator, the arc length  can be found to be approximately equal to 16.319 units.
12.6 Rapid Review
1. If  and the graph of g is shown in Figure 12.6-1. Find f(3).
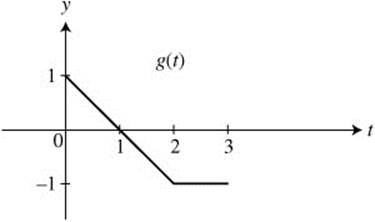
Figure 12.6-1
Answer: 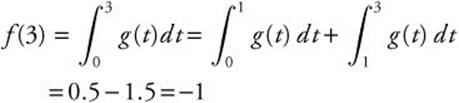
2. The function f is continous on [1, 5] and f > 0 and selected values of f are given below.
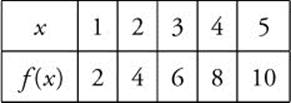
Using 2 midpoint rectangles, approximate the area under the curve of f for x = 1 to x = 5.
Answer: Midpoints are x = 2 and x = 4 and the width of each rectangle ![]()
Area ≈ Area of Rect1 + Area of Rect2 ≈ 4(2) + 8(2) ≈ 24.
3. Set up an integral to find the area of the regions bounded by the graphs of y = x3 and y = x. Do not evaluate the integral.
Answer: Graphs intersect at x = −1 and x = 1. (See Figure 12.6-2.)
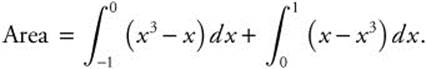
Or, using symmetry, 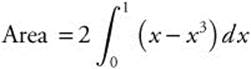 .
.
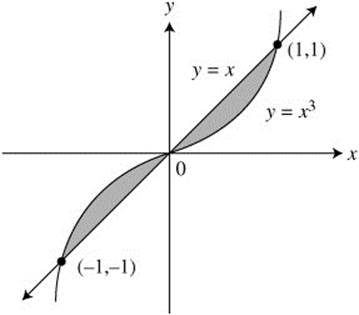
Figure 12.6-2
4. The base of a solid is the region bounded by the lines y = x, x = 1, and the x-axis. The cross sections are squares perpendicular to the x-axis. Set up an integral to find the volume of the solid. Do not evaluate the integral.
Answer: Area of cross section = x2.
5. Set up an integral to find the volume of a solid generated by revolving the region bounded by the graph of y = sin x, where 0 ≤ x ≤ π and the x-axis, about the x-axis. Do not evaluate the integral.
Answer: 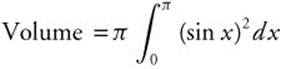 .
.
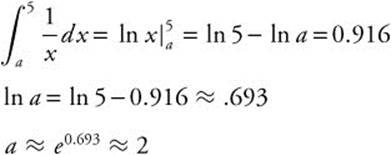
6. The area under the curve of ![]() from x = a to x = 5 is approximately 0.916 where 1 ≤ a < 5. Using your calculator, find a.
from x = a to x = 5 is approximately 0.916 where 1 ≤ a < 5. Using your calculator, find a.
Answer:
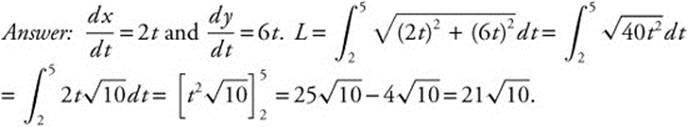
7. Find the length of the arc defined by x = t2 and y = 3t2 − 1 from t = 2 to t = 5.
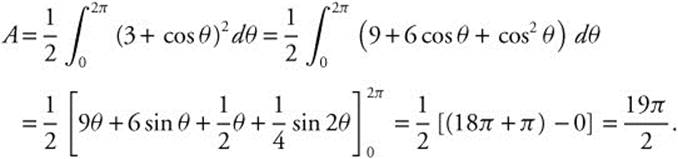
8. Find the area bounded by the r = 3 + cos θ.
Answer: To trace out the graph completely, without retracing, we need 0 ≤ θ ≤ 2π. Then,
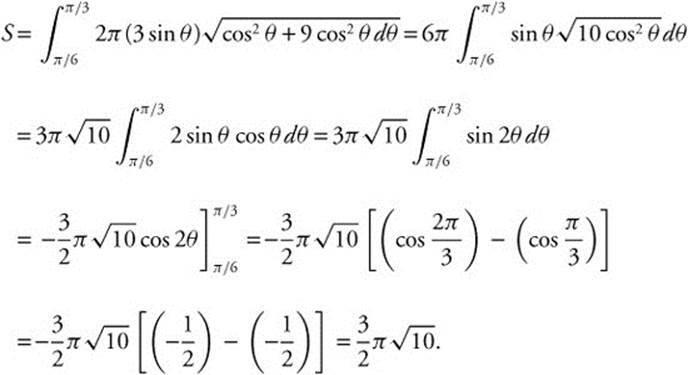
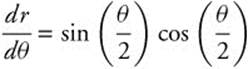
9. Find the area of the surface formed when the curve defined by x = sinθ, and y = 3 sinθ on the interval ![]() is revolved about the x-axis.
is revolved about the x-axis.
Answer: ![]() and
and ![]() , so
, so
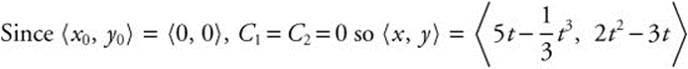
10. If 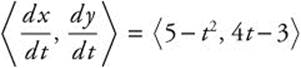 and ⟨x0, y0⟩ = ⟨0, 0⟩, find ⟨x, y⟩.
![]()
12.7 Practice Problems
Part A—The use of a calculator is not allowed.
1. Let 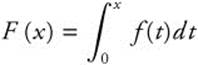 where the graph of f is given in Figure 12.7-1.
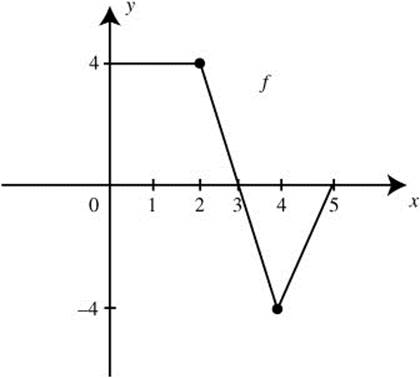
Figure 12.7-1
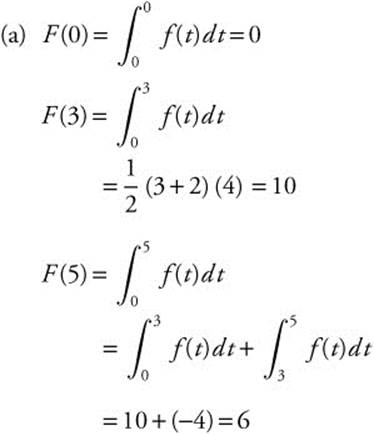
(a) Evaluate F(0), F(3), and F(5).
(b) On what interval(s) is F decreasing?
(c) At what value of t does F have a maximum value?
(d) On what interval is F concave up?
2. Find the area of the region(s) enclosed by the curve f(x) = x3, the x-axis, and the lines x = −1 and x = 2.
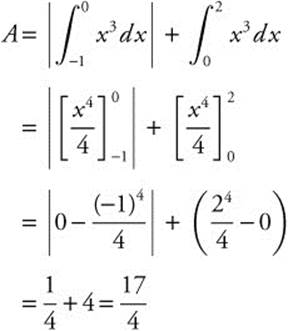
3. Find the area of the region(s) enclosed by the curve y = |2x − 6|, the x-axis, and the lines x = 0 and x = 4.
4. Find the approximate area under the curve ![]() from x = 1 to x = 5, using four right-endpoint rectangles of equal lengths.
from x = 1 to x = 5, using four right-endpoint rectangles of equal lengths.
5. Find the approximate area under the curve y = x2 + 1 from x = 0 to x = 3, using the Trapezoidal Rule with n = 3.
6. Find the area of the region bounded by the graphs ![]() , y = −x, and x = 4.
, y = −x, and x = 4.
7. Find the area of the region bounded by the curves x = y2 and x = 4.
8. Find the area of the region bounded by the graphs of all four equations:
![]() ; x-axis; and the lines,
; x-axis; and the lines, ![]() and x = π.
and x = π.
9. Find the volume of the solid obtained by revolving about the x-axis, the region bounded by the graphs of y = x2 + 4, the x-axis, the y-axis, and the lines x = 3.
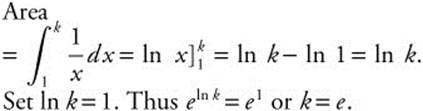
10. The area under the curve ![]() from x = 1 to x = k is 1. Find the value of k.
from x = 1 to x = k is 1. Find the value of k.
11. Find the volume of the solid obtained by revolving about the y-axis the region bounded by x = y2 + 1, x = 0, y = −1, and y = 1.
12. Let R be the region enclosed by the graph y = 3x, the x-axis and the line x = 4. The line x = a divides region R into two regions such that when the regions are revolved about the x-axis, the resulting solids have equal volume. Find a.
Part B—Calculators are allowed.
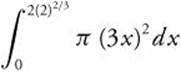
13. Find the volume of the solid obtained by revolving about the x-axis the region bounded by the graphs of f(x) = x3 and g(x) = x2.
14. The base of a solid is a region bounded by the circle x2 + y2 = 4. The cross sections of the solid perpendicular to the x-axis are equilateral triangles. Find the volume of the solid.
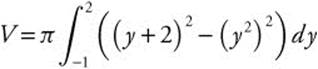
15. Find the volume of the solid obtained by revolving about the y-axis, the region bounded by the curves x = y2 and y = x − 2.
For Problems 16 through 19, find the volume of the solid obtained by revolving the region as described below. (See Figure 12.7-2.)
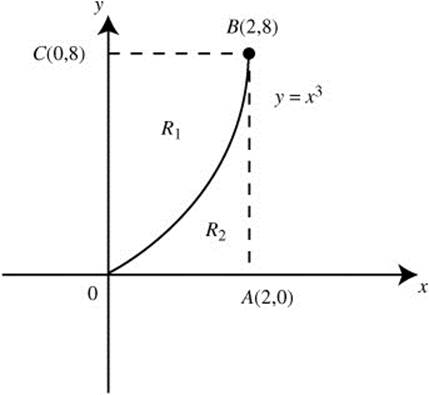
Figure 12.7-2
16. R1 about the x-axis.
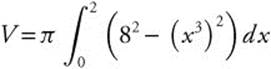
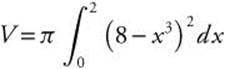
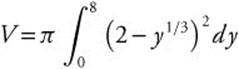
17. R2 about the y-axis.
18. R1 about the line ![]() .
.
19. R2 about the line ![]() .
.
20. The function f(x) is continuous on [0, 12] and the selected values of f(x) are shown in the table.
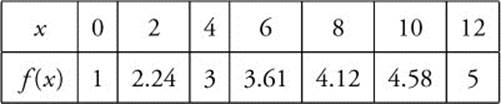
Find the approximate area under the curve of f from 0 to 12 using three midpoint rectangles.
21. Find the area bounded by the curve defined by x = 2 cos t and y = 3 sin t from t = 0 to t = π.
22. Find the length of the arc of  from θ = 0 to θ = π.
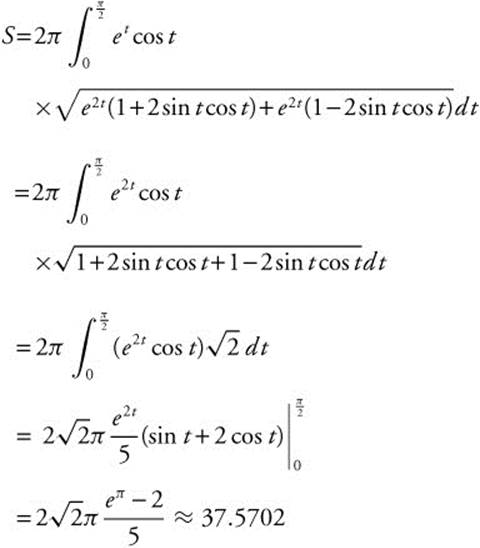
23. Find the area of the surface formed when the curve defined by x = et sin t and y = et cos t from t = 0 to ![]() is revolved about the x-axis.
is revolved about the x-axis.
24. Find the area bounded by r = 2 + 2 sinθ.
25. The acceleration vector for an object is ⟨−et, et⟩. Find the position of the object at t = 1 if the initial velocity is v0 = ⟨3, 1⟩ and the initial position of the object is at the origin.
12.8 Cumulative Review Problems
(Calculator) indicates that calculators are permitted.
26. If 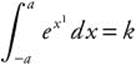 , find
  in terms of k.
27. A man wishes to pull a log over a 9 foot high garden wall as shown in Figure 12.8-1. He is pulling at a rate of 2 ft/sec. At what rate is the angle between the rope and the ground changing when there are 15 feet of rope between the top of the wall and the log?
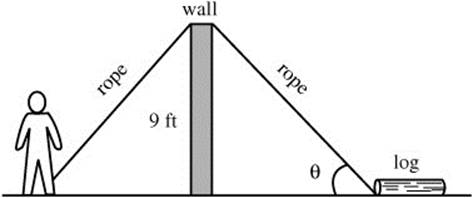
Figure 12.8-1
28. (Calculator) Find a point on the parabola ![]() that is closest to the point (4, 1).
that is closest to the point (4, 1).
29. The velocity function of a particle moving along the x-axis is v(t) = t cos(t2 + 1) for t ≥ 0.
(a) If at t = 0, the particle is at the origin, find the position of the particle at t = 2.
(b) Is the particle moving to the right or left at t = 2?
(c) Find the acceleration of the particle at t = 2 and determine if the velocity of the particle is increasing or decreasing. Explain why.
30. (Calculator) given f(x) = xex and g(x) = cos x, find:
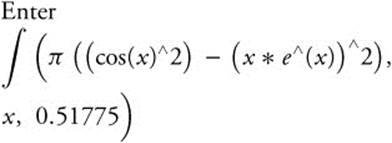
(a) the area of the region in the first quadrant bounded by the graphs f(x), g(x), and x = 0.
(b) The volume obtained by revolving the region in part (a) about the x-axis.
31. Find the slope of the tangent line to the curve defined by r = 5 cos 2θ at the point where ![]() .
.
32. 
33. 
12.9 Solutions to Practice Problems
Part A—The use of a calculator is not allowed.
1.
(b) 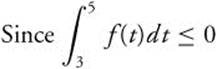 , F is decreasing on the interval [3, 5].
(c) At t = 3, F has a maximum value.
(d) F′(x) = f(x), F′(x) is increasing on (4, 5) which implies F ≤ (x) > 0. Thus F is concave upwards on (4, 5).
2. (See Figure 12.9-1.)
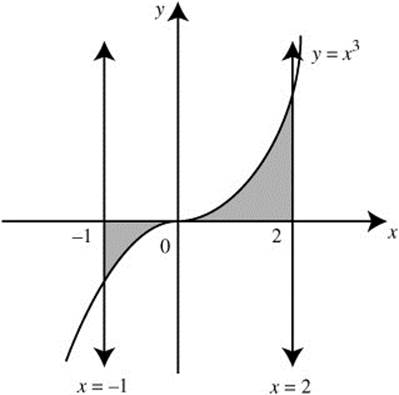
Figure 12.9-1
3. (See Figure 12.9-2.) Set 2x − 6 = 0; x = 3 and
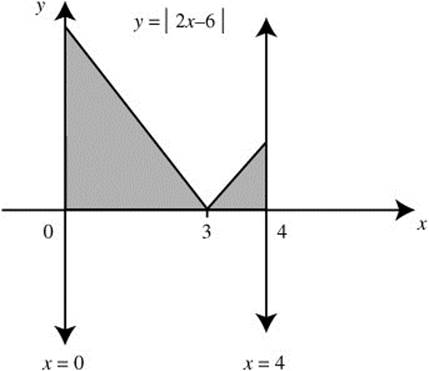
Figure 12.9-2
4. (See Figure 12.9-3.)
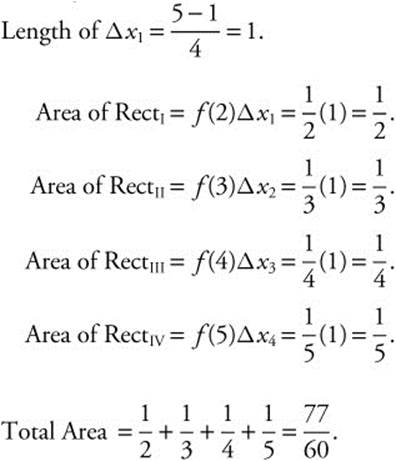
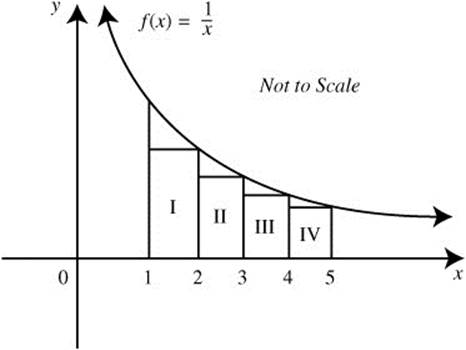
Figure 12.9-3
5. (See Figure 12.9-4.)
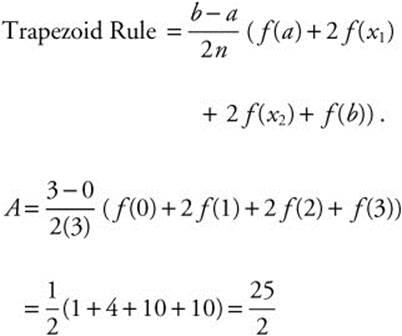
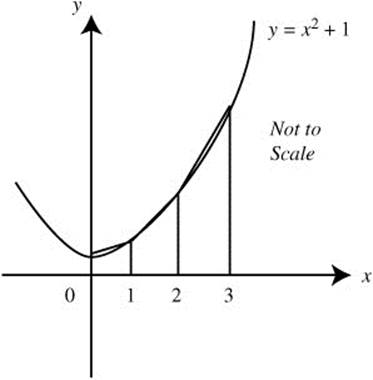
Figure 12.9-4
6. (See Figure 12.9-5.)
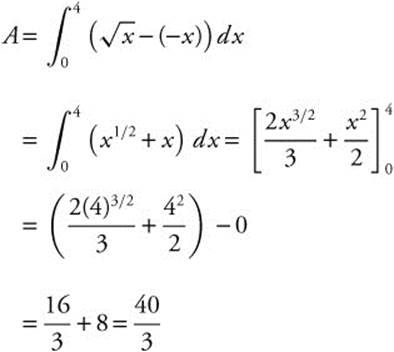
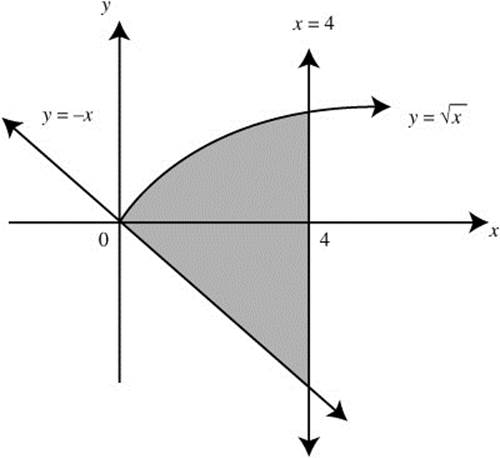
Figure 12.9-5
7. (See Figure 12.9-6.)
Intersection points: 4 = y2 ⇒ y = ± 2.
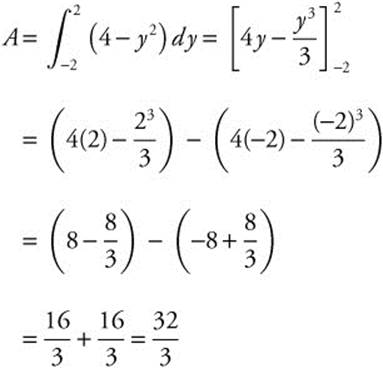
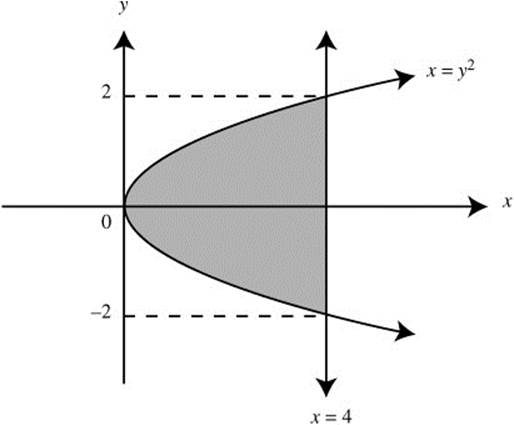
Figure 12.9-6
You can use the symmetry of the region and obtain the 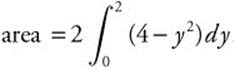 An alternative method is to find the area by setting up an integral with respect to the x-axis and expressing x = y2 as
 ![]() and
and ![]() .
.
8. (See Figure 12.9-7.)
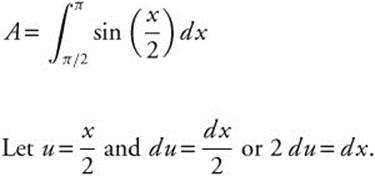
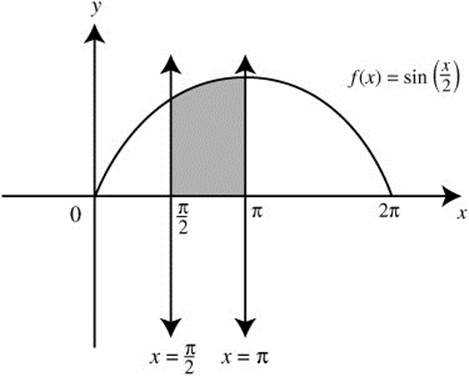
Figure 12.9-7
9. (See Figure 12.9-8.) Using the Disc Method:
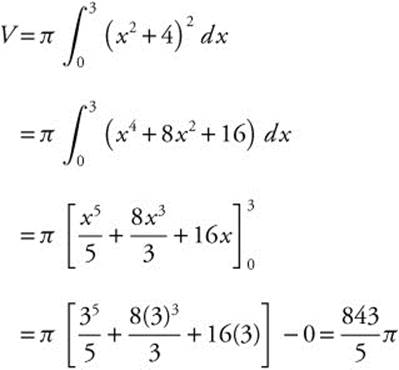
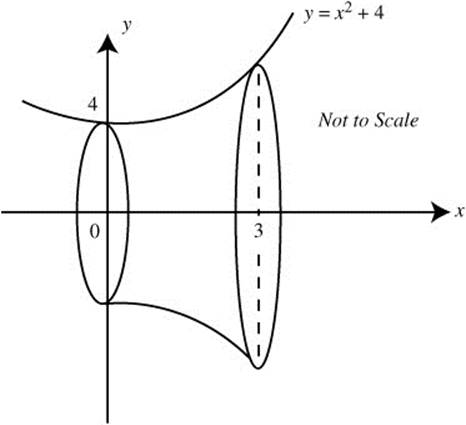
Figure 12.9-8
10.
11. (See Figure 12.9-9.)
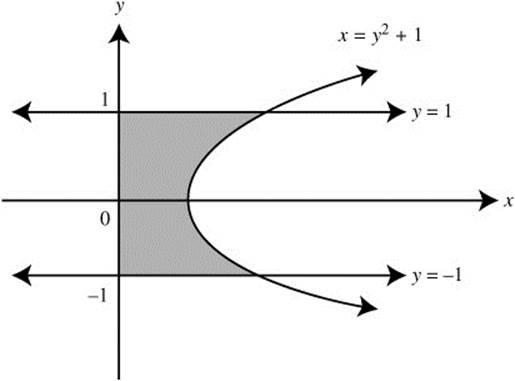
Figure 12.9-9
Using the Disc Method:
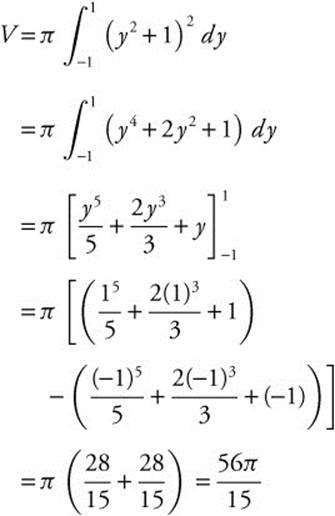
Note: You can use the symmetry of the region and find the volume by
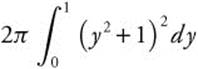 .
.
12. Volume of solid by revolving R:
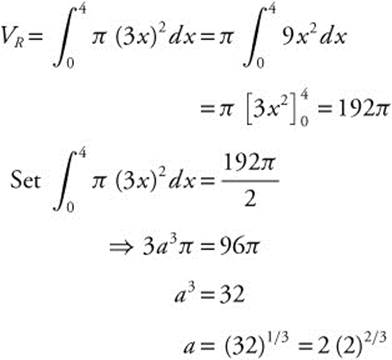
You can verify your result by evaluating
 . The result is 96π.
Part B—Calculators are allowed.
13. (See Figure 12.9-10.)
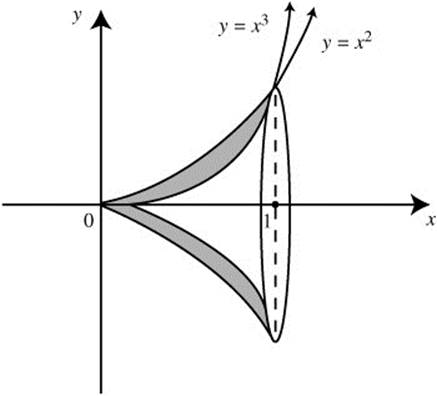
Figure 12.9-10
Step 1. Using the Washer Method: Points of intersection: Set x3 = x2 ⇒ x3 − x2 = 0 ⇒ x2(x − 1) = 0 or x = 1. Outer radius = x2; Inner radius = x3.
Step 2.
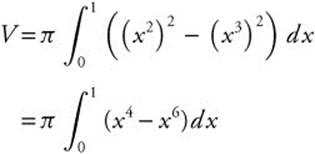
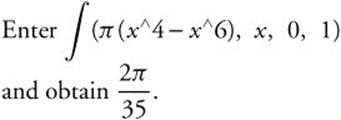
Step 3.
14. (See Figure 12.9-11.)
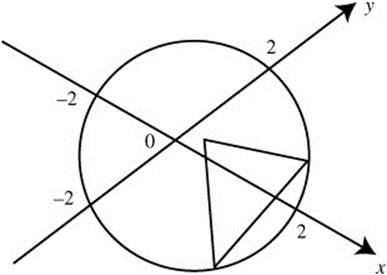
Figure 12.9-11
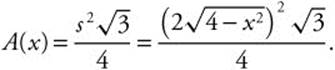
Step 1. x2 + y2 = 4 ⇒ y2 = 4 − x2 ⇒ ![]() Let s = a side of an equilateral triangle
Let s = a side of an equilateral triangle ![]() .
.
Step 2. Area of a cross section:
Step 3.
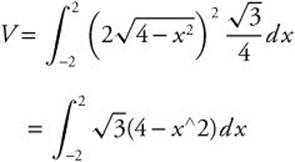
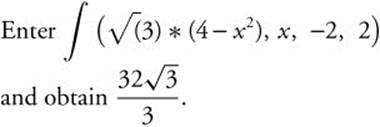
Step 4.
15. (See Figure 12.9-12.)
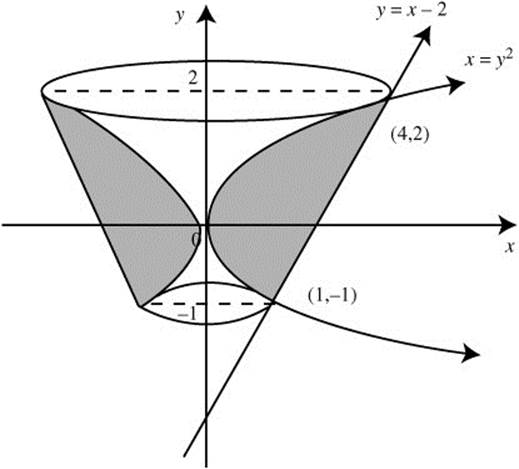
Figure 12.9-12
Step 1. Using the Washer Method: Points of Intersection: y = x − 2 ⇒ x = y + 2
Set y2 = y + 2
⇒ y2 − y + 2 = 0
⇒ (y − 2)(y + 1) = 0
or y = −1 or y = 2
Outer radius = y + 2;
Inner radius = y2.
Step 2.
Step 3. Enter 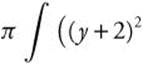
−y^4, −1, 2) and obtain ![]() π.
π.
16. (See Figure 12.9-13.)
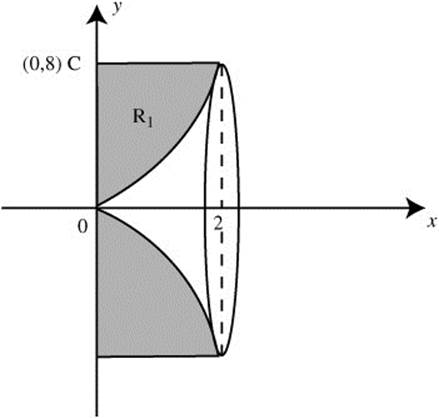
Figure 12.9-13
Step 1: Using the Washer Method: y = 8, y = x3
Outer radius = 8;
Inner radius = x3.
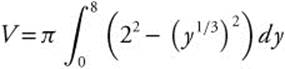
Step 2: Enter ∫ π (82 − x6, x, 0, 2) and obtain ![]() .
.
17. (See Figure 12.9-14.)
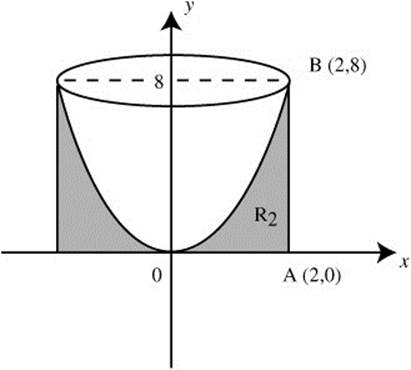
Figure 12.9-14
Using the Washer Method:
Outer radius: x = 2;
Inner radius: x = y1/3.
Using your calculator, you obtain ![]()
18. (See Figure 12.9-15.)
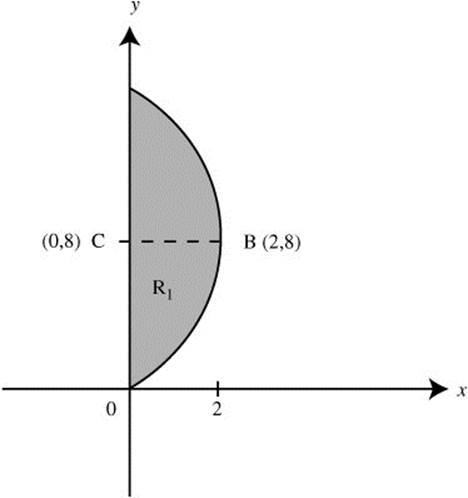
Figure 12.9-15
Step 1: Using the Disc Method:
Radius = (8 − x3).
Step 2: Enter  and obtain
 ![]() .
.
19. (See Figure 12.9-16.) Using the Disc Method:
Radius = 2 − x = (2 − y1/3)
Using your calculator, you obtain ![]() .
.
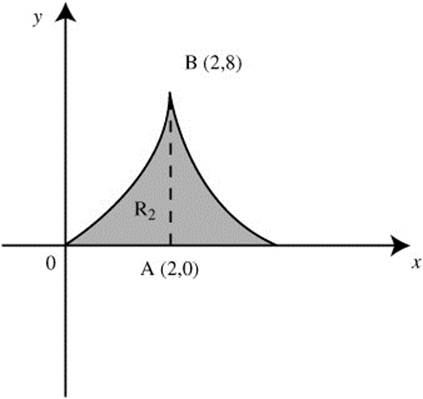
Figure 12.9-16
20.
xi = midpoint of the ith interval.
Length of ![]() .
.
Area of RectI = f(2)Δx1 = (2.24)(4) = 8.96.
Area of RectII = f(6)Δx2 = (3.61)(4) = 14.44.
Area of RectIII = f(10)Δx3 = (4.58)(4) = 18.32.
Total Area = 8.96 + 14.44 + 18.32 = 41.72.
The area under the curve is approximately 41.72.
21. The area enclosed by the curve is the upper half of an ellipse. ![]() t.
t.
The negative simply indicates that the area has been swept from right to left, rather than left to right, and so may be ignored. The area enclosed by the curve is 3π.
22. Differentiate to find
 , and calculate
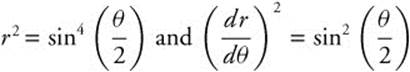
 . Then the length of the arc is
23. Find ![]() and
and ![]() . Square each derivative.
. Square each derivative.
24. Square r2 = 4 + 8 sinθ + 4 sin2 θ. The area
25. The acceleration vector for an object moving in the plane is ⟨−et, et⟩. Find the position of the object at t = 1, if the initial velocity is v0 = ⟨3, 1⟩ and the initial position of the object is at the origin.
The acceleration of the object is known to be a = ⟨−et, et⟩ = −eti + et j. Integrate to find the velocity. v = −eti + et j + C, and since the initial velocity is v0 = ⟨3, 1⟩, v0 = −i + j + C = 3i + j and C = 4i. The velocity vector is v = −eti + et j + 4i = (4 − et)i + et j. Integrate again to find the position vector s = (4t − et)i + et j + C.
The initial position at the origin means that s0 = (4.0 − e0)i + e0 j + C = −i + j + C = 0, and therefore, C = i − j. The position vector s = (4t − et + 1)i + (et − 1) j can be evaluated at t = 1 to find the position as (5 − e)i + (e − 1) j =⟨5 − e, e − 1⟩.
12.10 Solutions to Cumulative Review Problems
26. (See Figure 12.10-1.)
Figure 12.10-1
Since ![]() is an even function, thus
is an even function, thus
27. (See Figure 12.10-2.)
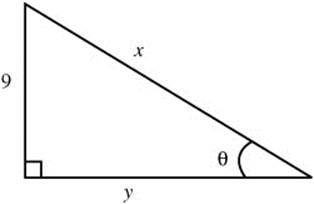
Figure 12.10-2
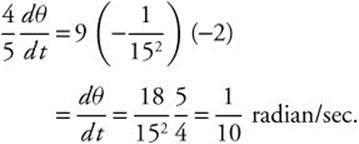
![]()
Differentiate both sides:
![]() .
.
When x = 15, 92 + y2 = 152 ⇒ y = 12.
Thus, ![]() .
.
28. (See Figure 12.10-3.)
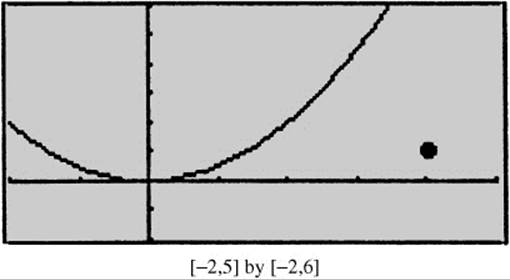
Figure 12.10-3
Step 1. Distance Formula:
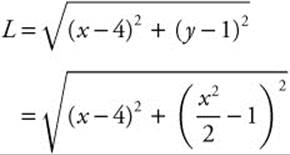
where the domain is all real numbers.
Step 2. ![]()
Enter y2 = d(y1(x), x).
Step 3. Use the [Zero] function and obtain x = 2 for y2.
Step 4. Use the First Derivative Test. (See Figures 12.10-4 and 12.10-5.) At x = 2, L has a relative minimum. Since at x = 2, L has the only relative extremum, it is an absolute minimum.
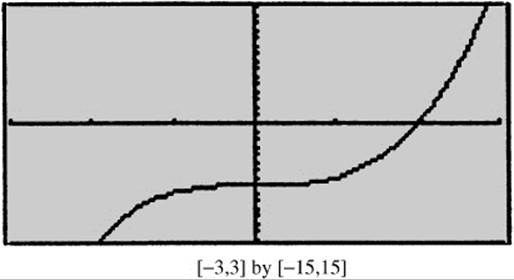
Figure 12.10-4
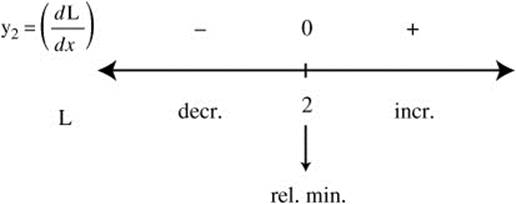
Figure 12.10-5
Step 5. ![]() . Thus, the point on
. Thus, the point on ![]() closest to the point (4, 1) is the point (2, 2).
closest to the point (4, 1) is the point (2, 2).
29.
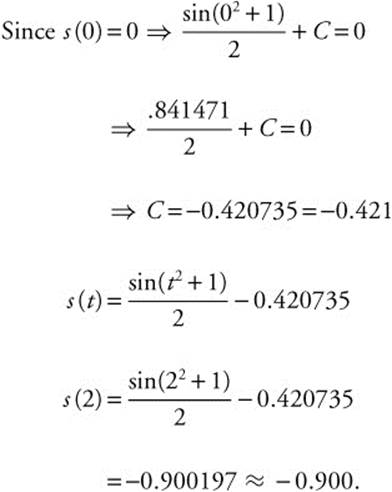
(a) s(0) = 0 and
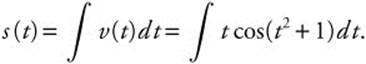
Enter 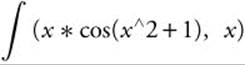 and obtain
 ![]() .
.
Thus, ![]() .
.
(b) v(2) = 2 cos(22 + 1) = 2 cos(5) = 0.567324
Since v(2) > 0, the particle is moving to the right at t = 2.
(c) a(t) = v′(t)
Enter d(x * cos(x^2 + 1), x)|x = 2 and obtain 7.95506.
Thus, the velocity of the particle is increasing at t = 2, since a(2) > 0.
30. (See Figure 12.10-6)
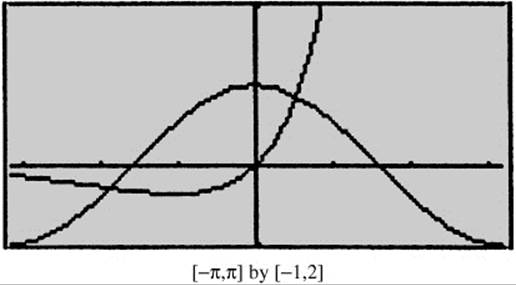
Figure 12.10-6
(a) Point of Intersection: Use the [Intersection] function of the calculator and obtain (0.517757, 0.868931).
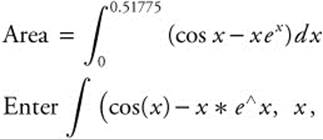 and obtain 0.304261. The area of the region is approximately 0.304.
(b)
Step 1. Using the Washer Method:
Outer radius = cos x;
Inner radius = xex.
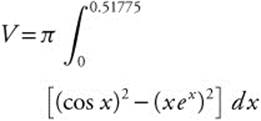
Step 2.
and obtain 1.16678.
The volume of the solid is approximately 1.167.

31. Convert to a parametric representation with x = r cos θ = 5 cos θ cos 2θ and y = r sinθ = 5 cos 2θ sinθ. Differentiate with respect to θ.
![]() and
and ![]() .
.
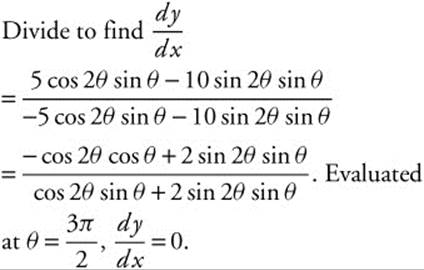
The slope of the tangent line is zero, including a horizontal tangent.
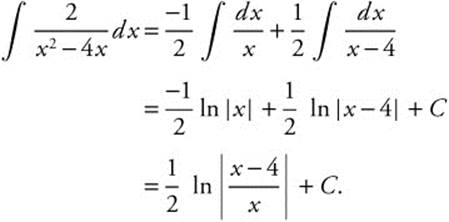
32. 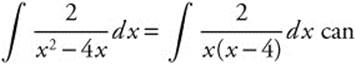 be integrated with a partial fraction decomposition. Since
 ![]() ,
, ![]() and
and ![]() . Therefore,
. Therefore,
33.