5 Steps to a 5 AP Calculus AB & BC, 2012-2013 Edition (2011)
STEP 5. Build Your Test-Taking Confidence
AP Calculus AB Practice Exam 2
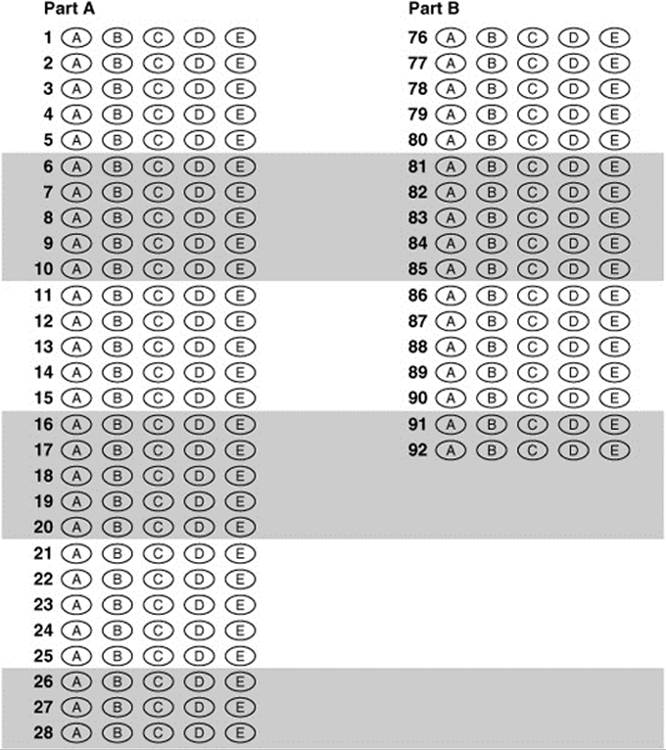
ANSWER SHEET FOR MULTIPLE-CHOICE QUESTIONS
Section I—Part A
Directions:
Use the answer sheet provided in the previous page. All questions are given equal weight. There is no penalty for unanswered questions. Unless otherwise indicated, the domain of a function f is the set of all real numbers. The use of a calculator is not permitted in this part of the exam.
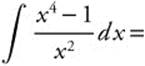
1. 
![]()
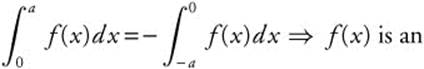
![]()
![]()
![]()
![]()
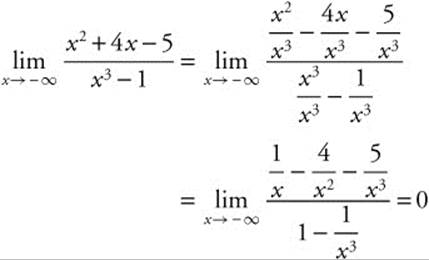
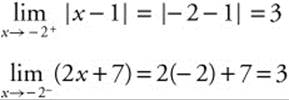
2. The ![]() is
is
(A) 0
![]()
(C) 5
(D) −∞
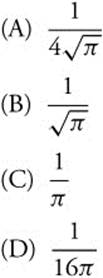
(E) ∞
3. What is the ![]() , if
, if
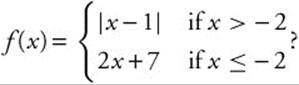
(A) −3
(B) 1
(C) 3
(D) 11
(E) Nonexistent
4. The graph of f′ is shown in Figure 2T-1.
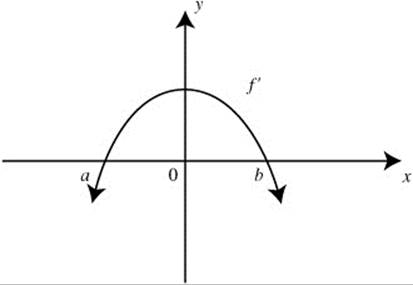
Figure 2T-1
Which of the graphs in Figure 2T-2 on page 400 is a possible graph of f?
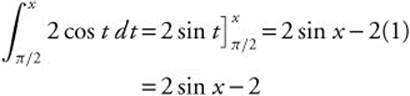
5. 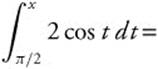
(A) 2 cos x
(B) − 2 cos x
(C) 2 sin x
(D) − 2 sin x + 2
(E) 2 sin x − 2
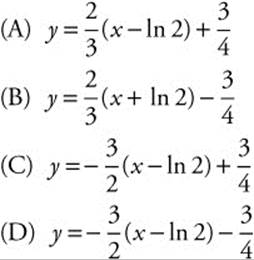
6. Given the equation y = 3e−2x, what is an equation of the normal line to the graph at x = ln 2?
7. What is the ![]()
![]()
![]()
(C) 0
(E) Undefined
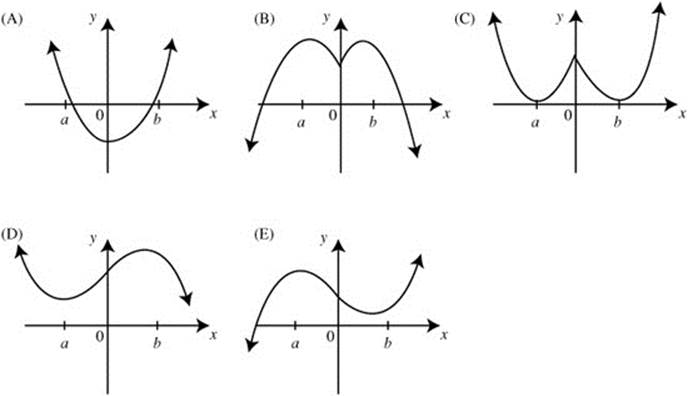
Figure 2T-2
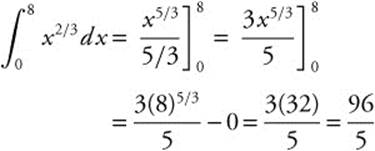
8. If f(x) is an antiderivative of ![]() and f(2) = 0, then f(0) =
and f(2) = 0, then f(0) =
(A) −6
(B) 6
![]()
![]()
![]()
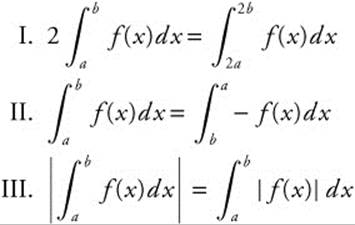
9. If a function f is continuous for all values of x, which of the following statements is/are always true?
(A) I only
(B) I and II only
(C) II only
(D) II and III only
(E) I, II, and III
10. The graph of f is shown in Figure 2T-3 and f is twice differentiable. Which of the following has the largest value: f(0), f′(0), f″(0)?
(A) f(0)
(B) f′(0)
(C) f″(0)
(D) f(0) and f′(0)
(E) f′(0) and f″(0)
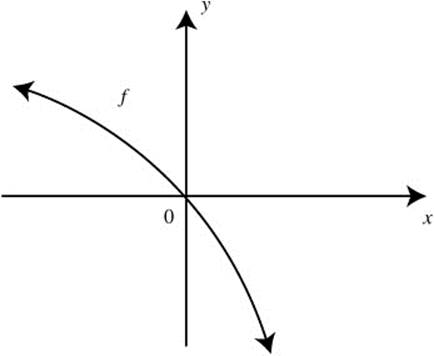
Figure 2T-3
11. 
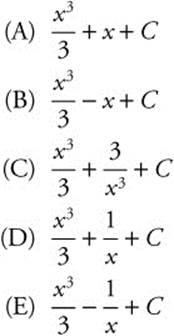
12. If p′(x) = q(x) and q is a continuous function for all values of x, then 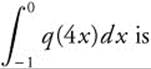 is
is
(A) p(0) − p(−4)
(B) 4p(0) − 4 p(−4)
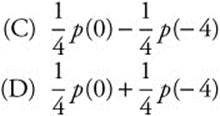
(E) p(0) + P(−4)
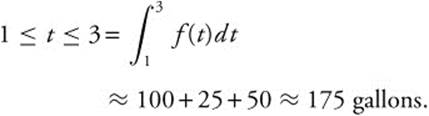
13. Water is leaking from a tank at a rate represented by f(t) whose graph is shown in Figure 2T-4. Which of the following is the best approximation of the total amount of water leaked from the tank for 1 ≤ t ≤ 3?
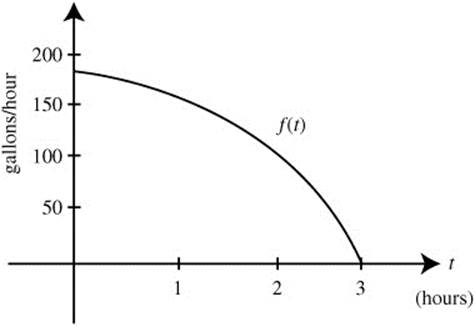
Figure 2T-4
![]()
(B) 5 gallons
(C) 175 gallons
(D) 350 gallons
(E) 450 gallons
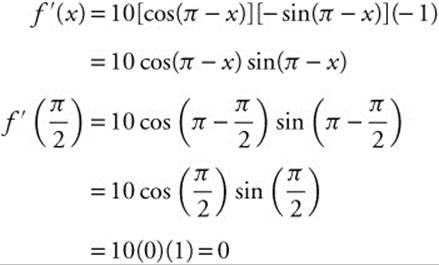
14. If f(x) = 5 cos2(π − x), then ![]() is
is
(A) 0
(B) −5
(C) 5
(D) −10
(E) 10
15. 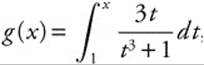 , then g′(2) is
(A) 0
![]()
![]()
![]()
![]()
16. If 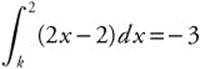 , a possible value of k is
(A) −2
(B) 0
(C) 1
(D) 2
(E) 3
17. If 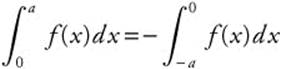 for all positive values of a, then which of the following could be the graph of f? (See Figure 2T-5.)
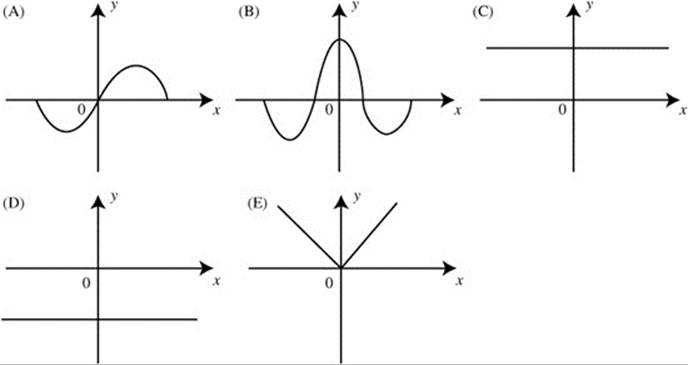
Figure 2T-5
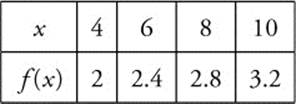
18. A function f is continuous on [1, 5] and some of the values of f are shown below:
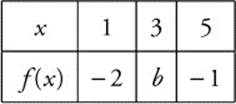
If f has only one root, r, on the closed interval [1, 5], and r ≠ 3, then a possible value of b is
(A) −1
(B) 0
(C) 1
(D) 3
(E) 5
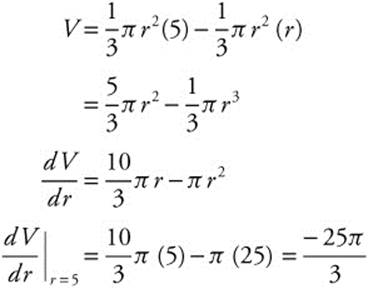
19. Given the equation ![]() , what is the instantaneous rate of change of V with respect to r at r = 5?
, what is the instantaneous rate of change of V with respect to r at r = 5?
![]()
![]()
![]()
(D) 25π
![]()
20. What is the slope of the tangent to the curve x3 − y2 = 1 at x = 1?
![]()
(B) 0
![]()
(E) Undefined
21. The graph of function f is shown in Figure 2T-6. Which of the following is true for f on the interval (a, b)?
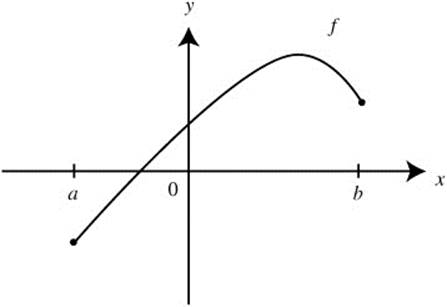
Figure 2T-6
I. The function f is differentiable on (a, b).
II. There exists a number k on (a, b) such that f′(k) = 0.
III. f″ > 0 on (a, b).
(A) I only
(B) II only
(C) I and II only
(D) II and III only
(E) I, II and III
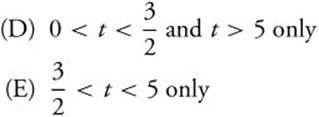
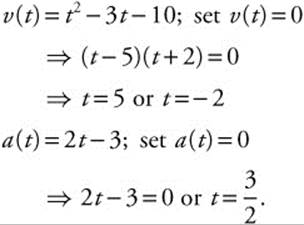
22. The velocity function of a moving particle on the x-axis is given as v(t) = t2 − 3t − 10. For what positive values of t is the particle’s speed increasing?
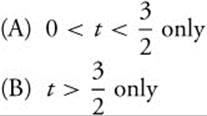
(C) t > 5 only
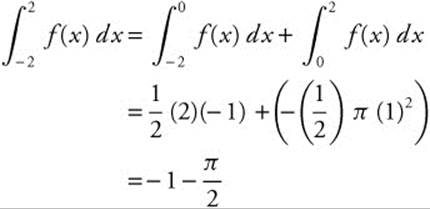
23. The graph of f consists of two line segments and a semicircle for − 2 ≤ x ≤ 2 as shown in Figure 2T-7. What is the value of 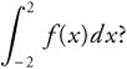
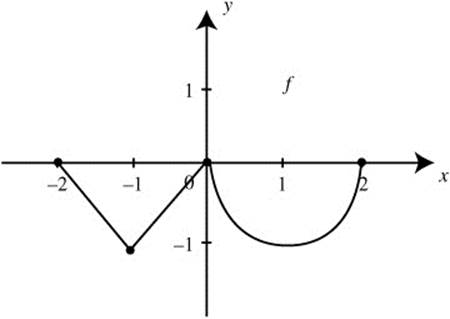
Figure 2T-7
(A) − 2 − 2π
(B) − 2 − π
![]()
![]()
(E) − 1 − π
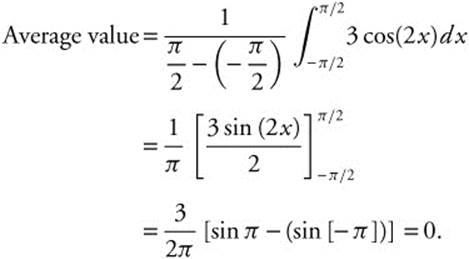
24. What is the average value of the function y = 3 cos(2x) on the interval ![]() ?
?
(A) −2
![]()
(C) 0
![]()
![]()
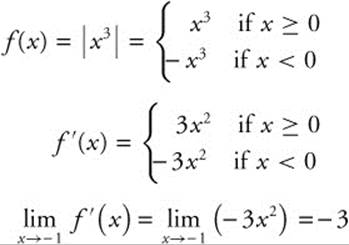
25. If f(x) = |x3|, what is the value of ![]()
(A) −3
(B) 0
(C) 1
(D) 3
(E) Undefined
26. A spherical balloon is being inflated. At the instant when the rate of increase of the volume of the sphere is four times the rate of increase of the radius, the radius of the sphere is
(E) π
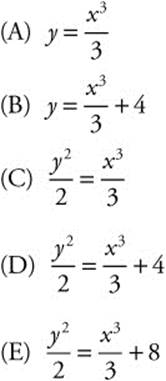
27. If  and at x = 0, y = 4, a solution to the differential equation is
28. The area of the region enclosed by the graph of x = y2 − 1 and the y-axis is
![]()
(B) 0
![]()
![]()
![]()
Section I—Part B
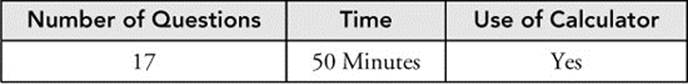
Directions:
Use the same answer sheet from Part A. Please note that the questions begin with number 76. This is not an error. It is done to be consistent with the numbering system of the actual AP Calculus AB Exam. All questions are given equal weight. There is no penalty for unanswered questions. Unless otherwise indicated, the domain of a function f is the set of all real numbers. If the exact numerical value does not appear among the given choices, select the best approximate value. The use of a calculator is permitted in this part of the exam.
76. The graph of f′, the derivative of f, is shown in Figure 2T-8. At which value of x does the graph f have a horizontal tangent?
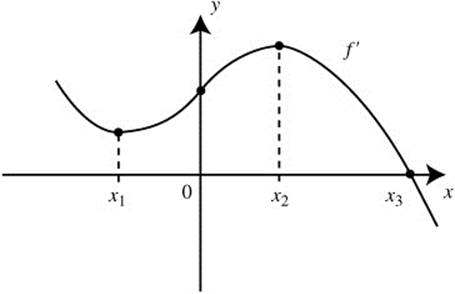
Figure 2T-8
(A) x1
(B) 0
(C) x2
(D) x1 and x2
(E) x3
77. The position function of a moving particle is s (t) = 5 + 4t − t2 for 0 ≤ t ≤ 10 where s is in meters and t is measured in seconds. What is the maximum speed in m/sec of the particle on the interval 0 ≤ t ≤ 10?
(A) −16
(B) 0
(C) 2
(D) 4
(E) 16
78. How many points of inflection does the graph of y = cos (x2) have on the interval (0, π)?
(A) 0
(B) 1
(C) 2
(D) 3
(E) 4
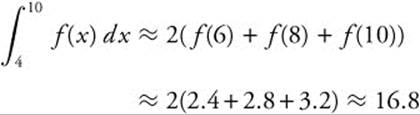
79. Let f be a continuous function on [4, 10] and have selected values as shown below:
Using three right endpoint rectangles of equal length, what is the approximate value of 
(A) 8.4
(B) 9.6
(C) 14.4
(D) 16.8
(E) 20.8
80. Given a differentiable function f with f(−1) = 2 and ![]() . Using a tangent line to the graph of f at x = −1, find an approximate value of f(−1.1)?
. Using a tangent line to the graph of f at x = −1, find an approximate value of f(−1.1)?
(A) −3.05
(B) −1.95
(C) 0.95
(D) 1.95
(E) 3.05
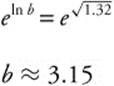
81. If area under the curve of ![]() is 0.66 from x = 1 to x = b, where b > 1, then the value of b is approximately,
is 0.66 from x = 1 to x = b, where b > 1, then the value of b is approximately,
(A) 1.93
(B) 2.25
(C) 3.15
(D) 3.74
(E) 5.71
82. The base of a solid is a region enclosed by the circle x2 + y2 = 4. What is the approximate volume of the solid if the cross sections of the solid perpendicular to the x-axis are semicircles?
(A) 8π
![]()
![]()
![]()
![]()
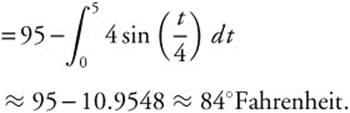
83. The temperature of a cup of coffee is dropping at the rate of ![]() degrees for 0 ≤ t ≤ 5, where f is measured in Fahrenheit and t in minutes. If initially, the coffee is 95°F, find its temperature to the nearest degree Fahrenheit 5 minutes later.
degrees for 0 ≤ t ≤ 5, where f is measured in Fahrenheit and t in minutes. If initially, the coffee is 95°F, find its temperature to the nearest degree Fahrenheit 5 minutes later.
(A) 84
(B) 85
(C) 91
(D) 92
(E) 94
84. The graphs of f′, g′, p′, and q′ are shown in Figure 2T-9. Which of the functions f, g, p, or q have a relative minimum on (a, b)?
(A) f only
(B) g only
(C) p only
(D) q only
(E) q and p only
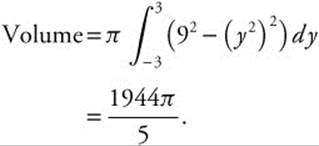
85. What is the volume of the solid obtained by revolving the region enclosed by the graphs of x = y2 and x = 9 about the y-axis?
(A) 36π
![]()
![]()
![]()
![]()
86. At what value(s) of x do the graphs of y = ex and y = x2 + 5x have parallel tangent lines?
(A) −2.5
(B) 0
(C) 0 and 5
(D) −5 and 0.24
(E) −2.45 and 2.25
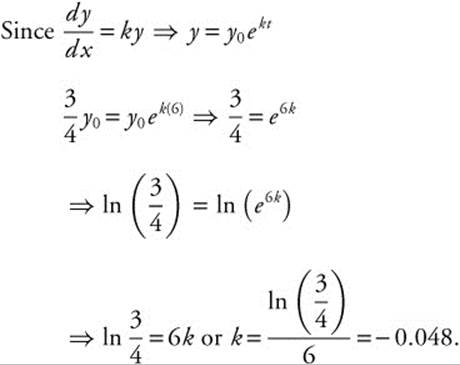
87. Let y represent the population in a town. If y decreases according to the equation ![]() , with t measured in years, and the population decreases by 25% in 6 years, then k =
, with t measured in years, and the population decreases by 25% in 6 years, then k =
(A) −8.318
(B) −1.726
(C) −0.231
(D) −0.120
(E) −0.048
88. If 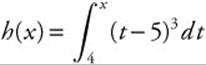 on [4, 8], then h has a local minimum at x =
(A) 4
(B) 5
(C) 6
(D) 7
(E) 8
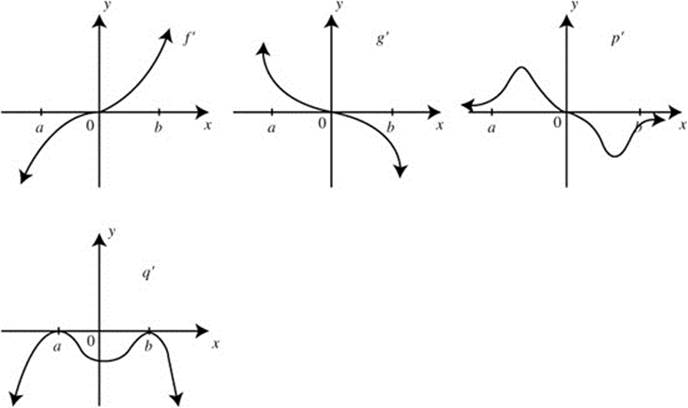
Figure 2T-9
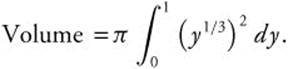
89. The volume of the solid generated by revolving the region bounded by the graph of y = x3, the line y = 1, and the y-axis about the y-axis is
![]()
![]()
![]()
![]()
![]()
90. If 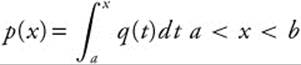 and the graph of q is shown in Figure 2T-10, which of the graphs shown in Figure 2T-11 is a possible graph of p?
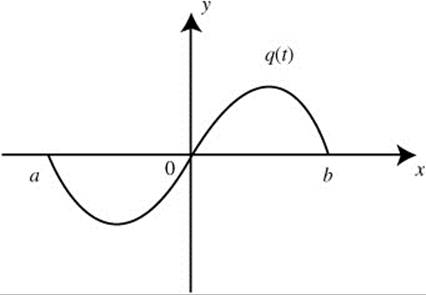
Figure 2T-10
91. If f(x) = −|x − 3|, which of the following statement about f is true?
I. f is differentiable at x = 3.
II. f has an absolute minimum at x = 3.
III. f has a point of inflection at x = 3.
(A) II only
(B) III only
(C) II and III only
(D) I, II, and III
(E) None
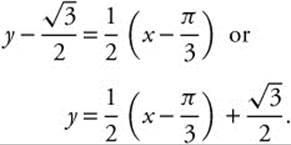
92. The equation of the tangent line to the graph of y = sin x for 0 ≤ x ≤ π at the point where ![]() is
is
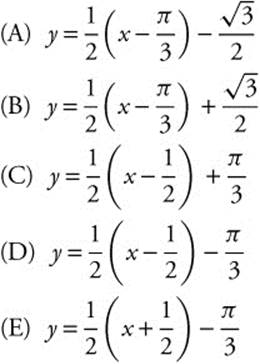
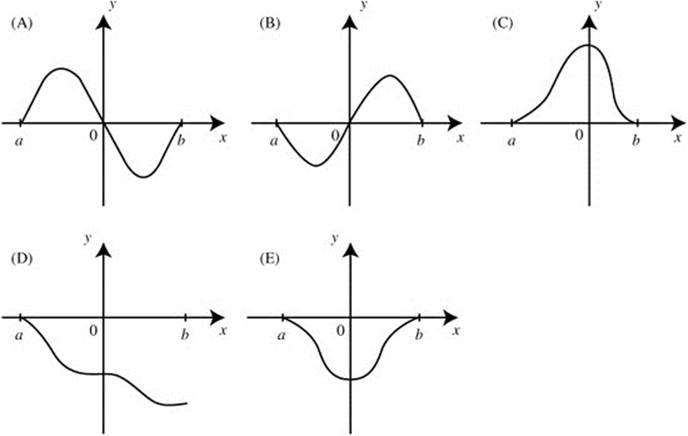
Figure 2T-11
STOP. AP Calculus AB Practice Exam 2 Section I—Part B
Section II—Part A
Directions:
Show all work. You may not receive any credit for correct answers without supporting work. You may use an approved calculator to help solve a problem. However, you must clearly indicate the setup of your solution using mathematical notations and not calculator syntax. Calculators may be used to find the derivative of a function at a point, compute the numerical value of a definite integral, or solve an equation. Unless otherwise indicated, you may assume the following: (a) the numeric or algebraic answers need not be simplified; (b) your answer, if expressed in approximation, should be correct to 3 places after the decimal point; and (c) the domain of a function f is the set of all real numbers.
1. Let R be the region in the first quadrant enclosed by the graph of y = 2 cos x, the x-axis, and the y-axis.
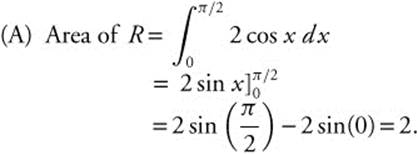
(A) Find the area of the region R.
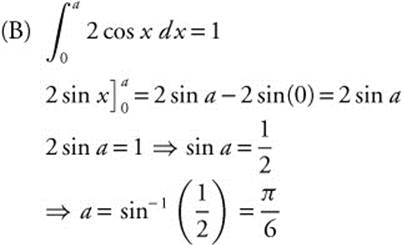
(B) If the line x = a divides the region R into two regions of equal area, find a.
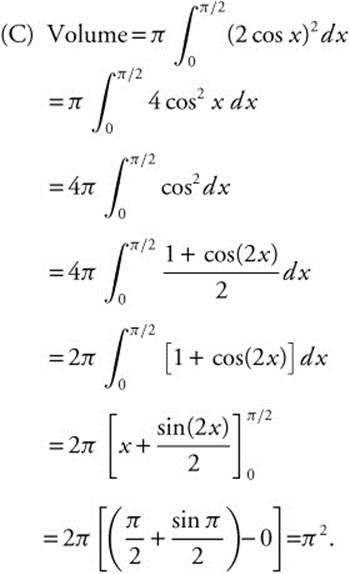
(C) Find the volume of the solid obtained by revolving region R about the x-axis.
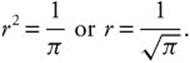
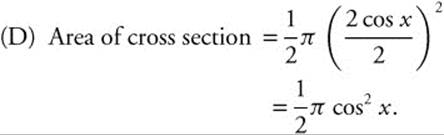
(D) If R is the base of a solid whose cross sections perpendicular to the x-axis are semicircles, find the volume of the solid.
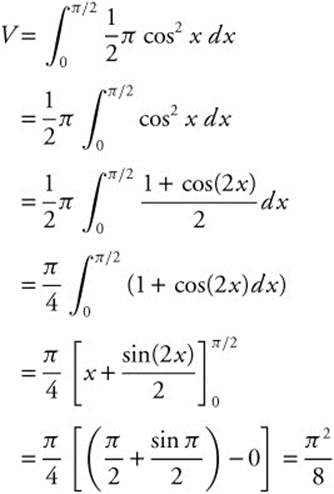
2. The temperature of a liquid at a chemical plant during a 20-minute period is given as ![]() , where g(t) is measured in degrees Fahrenheit, 0 ≤ t ≤ 20 and t is measured in minutes.
, where g(t) is measured in degrees Fahrenheit, 0 ≤ t ≤ 20 and t is measured in minutes.
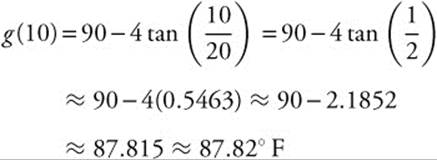
(A) Sketch the graph of g on the provided grid. What is the temperature of the liquid to the nearest hundredth of a degree Fahrenheit when t = 10? (See Figure 2T-13.)
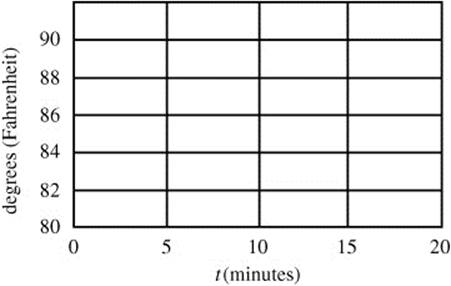
Figure 2T-12
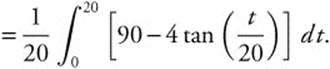
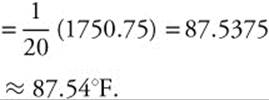
(B) What is the average temperature of the liquid to the nearest hundredth of a degree Fahrenheit during the 20-minute period.
(C) At what values of t is the temperature of the liquid below 86°F?
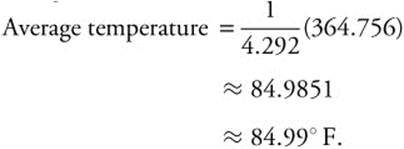
(D) During the time within the 20-minute period when the temperature is below 86°F, what is the average temperature to the nearest hundredth of a degree Fahrenheit?
STOP. AP Calculus AB Practice Exam 2 Section II—Part A
Section II—Part B
Directions:
The use of a calculator is not permitted in this part of the exam. When you have finished this part of the exam, you may return to the problems in Part A of Section II and continue to work on them. However, you may not use a calculator. You should show all work. You may not receive any credit for correct answers without supporting work. Unless otherwise indicated, the numeric or algebraic answers need not be simplified, and the domain of a function fis the set of all real numbers.
3. A particle is moving on a coordinate line. The graph of its velocity function v(t) for 0 ≤ t ≤ 24 seconds is shown in Figure 2T-13.
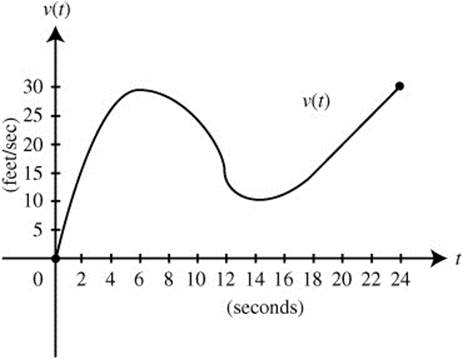
Figure 2T-13
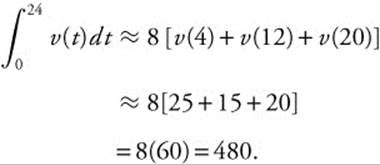
(A) Using midpoints of the three subintervals of equal length, find the approximate value of 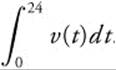 .
.
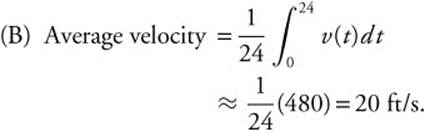
(B) Using the result in part (A), find the average velocity over the interval 0 ≤ t ≤ 24 seconds.
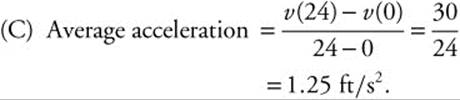
(C) Find the average acceleration over the interval 0 ≤ t ≤ 24 seconds.
(D) When is the acceleration of the particle equal to zero?
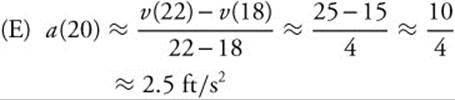
(E) Find the approximate acceleration at t = 20 seconds.
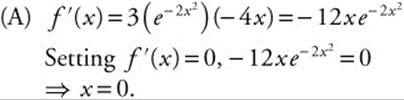
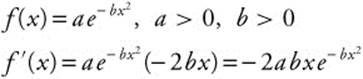
4. Given the function ![]() ,
,
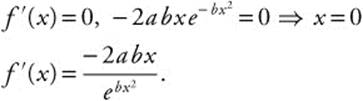
(A) at what value(s) of x, if any, is f′(x) = 0?
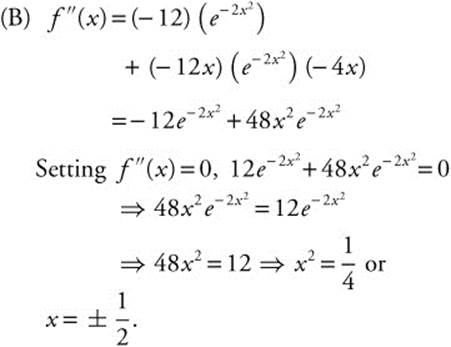
(B) at what value(s) of x, if any, is f″(x) = 0?
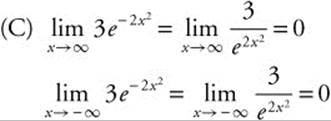
(C) find ![]() and
and ![]() .
.
(D) find the absolute maximum value of f and justify your answer.
(E) show that if ![]() where a > 0 and b > 0, the absolute maximum value of f is a.
where a > 0 and b > 0, the absolute maximum value of f is a.
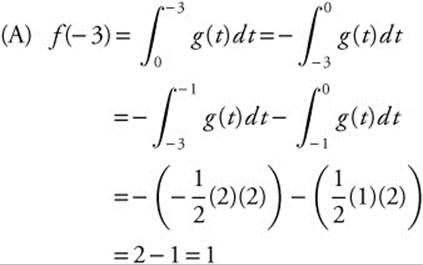
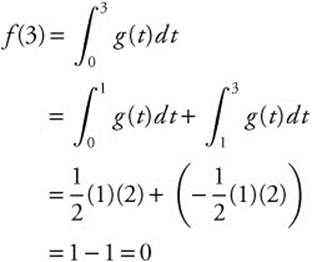
5. The function f is defined as 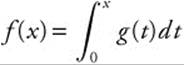 where the graph of g consists of five line segments as shown in Figure 2T-14.
(A) Find f (−3) and f (3).
(B) Find all values of x on (−3, 3) such that f has a relative maximum or minimum. Justify your answer.
(C) Find all values of x on (−3, 3) such that the graph f has a point of inflection. Justify your answer.
(D) Write an equation of the line tangent to the graph to f at x = 1.
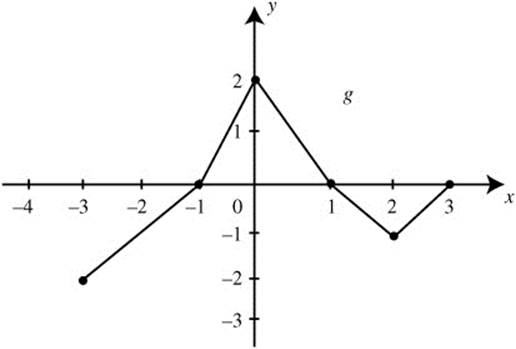
Figure 2T-14
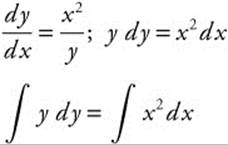
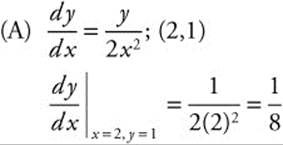
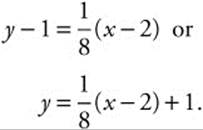
6. The slope of a function f at any point (x, y) is ![]() . The point (2, 1) is on the graph of f.
. The point (2, 1) is on the graph of f.
(A) Write an equation of the tangent line to the graph of f at x = 2.
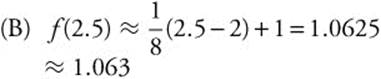
(B) Use the tangent line in part (A) to approximate f(2.5).
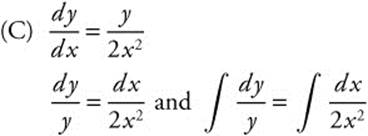
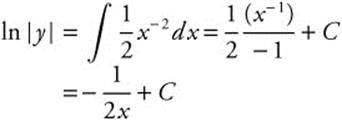
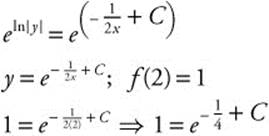
(C) Solve the differential equation ![]() with the initial condition f(2) = 1.
with the initial condition f(2) = 1.
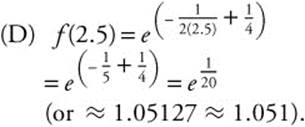
(D) Use the solution in part (C) and find f(2.5).
STOP. AP Calculus AB Practice Exam 2 Section II—Part B
Answers to AB Practice Exam 2—Section I
Part A
1. B
2. A
3. C
4. D
5. E
6. A
7. B
8. D
9. C
10. A
11. D
12. C
13. C
14. A
15. C
16. E
17. A
18. A
19. A
20. E
21. C
22. D
23. C
24. C
25. A
26. B
27. E
28. D
Part B
76. E
77. E
78. D
79. D
80. D
81. C
82. B
83. A
84. A
85. E
86. E
87. E
88. B
89. C
90. E
91. E
92. B
Answers to AB Practice Exam 2—Section II
Part A
1. (A) 2 (2 pts.)
![]()
(C) π2 (2 pts.)
![]()
2. (A) See graph, and g(10) = 87.82°. (3 pts.)
(B) 87.54° (2 pts.)
(C) 15.708 < t ≤ (2 pts.)
(D) 84.99° (2 pts.)
Part B
3. (A) 480 (3 pts.)
(B) 20 ft/s (2 pts.)
(C) 1.25 ft/s2 (1 pt.)
(D) t = 6 and t = 14 (2 pts.)
(E) 2.5 ft/s2 (1 pt.)
4. (A) x = 0 (1 pt.)
![]()
![]()
(D) 3 (2 pts.)
(E) See solution. (2 pts.)
5. (A) f(−3) = 1 and f(3) = 0 (2 pts.)
(B) x = −1, 1 (3 pts.)
(C) x = 0 and x = 2 (2 pts.)
(D) y = 1 (2 pts.)
6. ![]()
(B) 1.063 (1 pt.)
(C) y = e(−1/2x) + (1/4) (4 pts.)
(D) e1/20 (or 1.051) (1 pt.)
Solutions to AB Practice Exam 2—Section I
Section I—Part A
1. The correct answer is (B).
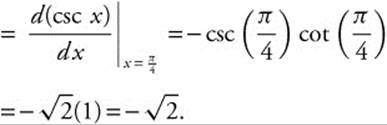
2. The correct answer is (A).
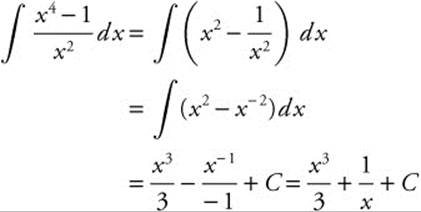
3. The correct answer is (C).
Thus, ![]()
4. The correct answer is (D).
(See Figure 2TS-1.)
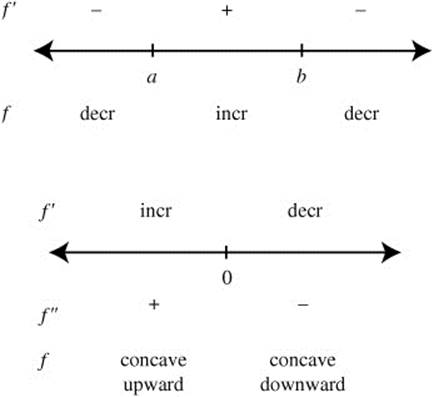
Figure 2TS-1
5. The correct answer is (E).
6. The correct answer is (A).
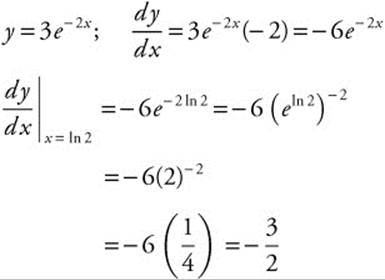
Slope of normal line at x = ln 2 is ![]() .
.
At x = ln 2, ![]() ; point
; point  .
.
Equation of normal line: ![]() or
or ![]() .
.
7. The correct answer is (B).
![]()
Thus, 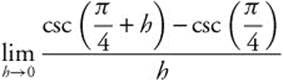
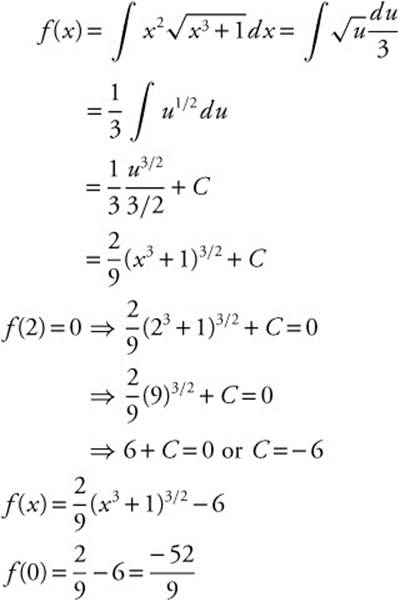
8. The correct answer is (D).
Let u = x3 + 1, du = 3x2 or ![]() .
.
9. The correct answer is (C).
Statement I is not true, e.g.,
Statement II is always true since
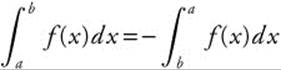 by properties of definite integrals.
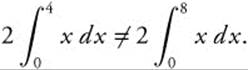
Statement III is not true, e.g., 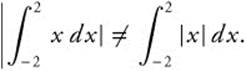
10. The correct answer is (A).
f(0) = 0; f′(0) ≤ 0 since f is concave downward. Thus, f(0) has the largest value.
11. The correct answer is (D).
12. The correct answer is (C).
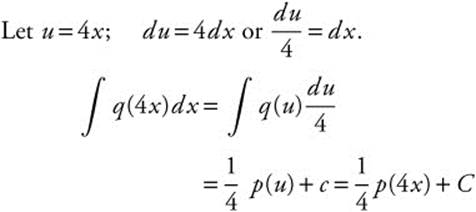
Thus, 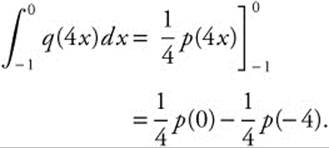
13. The correct answer is (C).
The total amount of water leaked from the tank for
14. The correct answer is (A).
15. The correct answer is (C).
![]()
16. The correct answer is (E).
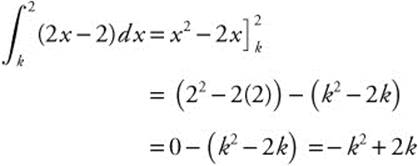
Set −k2 + 2k = −3 ⇒ 0 = k2 − 2k − 3
0 = (k − 3)(k + 1)
⇒ k = 3 or k = −1.
17. The correct answer is (A).
 is an odd function. The function whose graph is shown in (A) is the only odd function.
18. The correct answer is (A).
(See Figure 2TS-2.)
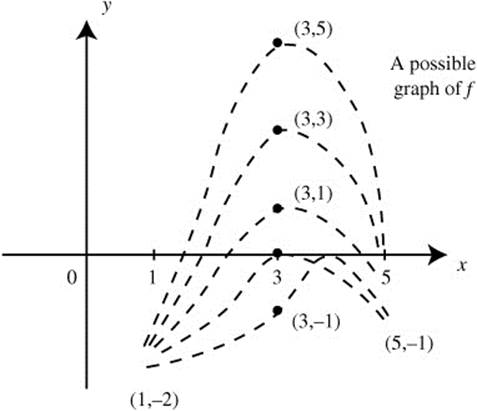
Figure 2TS-2
If b = 0, then r = 3, but r cannot be 3.
If b = 1, 3, or 5, f would have more than one root. Thus, of all the choices, the only possible value for b is − 1.
19. The correct answer is (A).
20. The correct answer is (E).
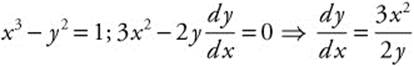
At x = 1, 13 − y2 = 1 ⇒ y = 0 ⇒ (1, 0)
 undefined.
21. The correct answer is (C).
I. f is differentiable on (a, b) since the graph is a smooth curve.
II. There exists a horizontal tangent to the graph on (a, b); thus, f′(k) = 0 for some k on (a, b).
III. The graph is concave downward; thus f″ < 0.
22. The correct answer is (D).
(See Figure 2TS-3.)
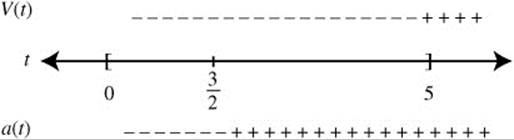
Figure 2TS-3
Since v(t) and a(t) are both negative on (0, 3/2), and are both positive on (5, ∞), the particle’s speed is increasing on these intervals.
23. The correct answer is (C).
24. The correct answer is (C).
25. The correct answer is (A).
26. The correct answer is (B).
![]()
Since ![]() or
or
27. The correct answer is (E).
![]() Substituting (0, 4)
Substituting (0, 4)
![]()
Thus, a solution is ![]() .
.
28. The correct answer is (D). (See Figure 2TS-4.)
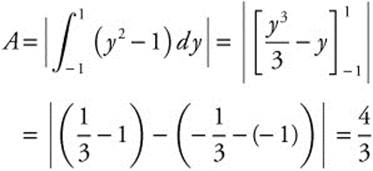
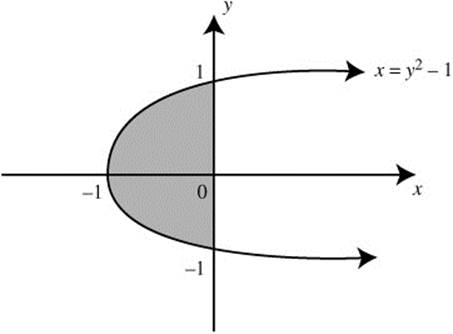
Figure 2TS-4
Section I—Part B
76. The correct answer is (E).
At x = x3, f′ = 0. Thus the tangent to the graph of f at x = x3 is horizontal.
77. The correct answer is (E).
s(t) = 5 + 4t − t2; v(t) = s′(t) = 4 − 2t
(See Figure 2TS-5.)
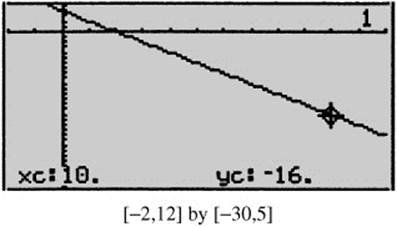
Figure 2TS-5
Since v(t) is a straight line with a negative slope, the maximum speed for 0 ≤ t ≤ 10 occurs at t = 10 where v(t) = 4 − 2(10) = −16. Thus maximum speed = 16.
78. The correct answer is (D).
(See Figure 2TS-6.)
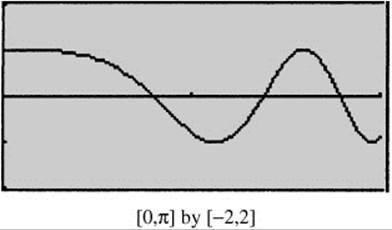
Figure 2TS-6
Using the [Inflection] function of your calculator, you will find three points of inflection. They occur at x = 1.335, 2.195, and 2.8.
79. The correct answer is (D).
80. The correct answer is (D).
f(−1) = 2 ⇒ a point (−1, 2).
![]() the slope at x = −1 is
the slope at x = −1 is ![]() .
.
Equation of tangent at x = −1 is
![]() or
or ![]() .
.
Thus, ![]() .
.
81. The correct answer is (C).
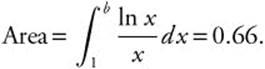
Let u = ln x; ![]() .
.
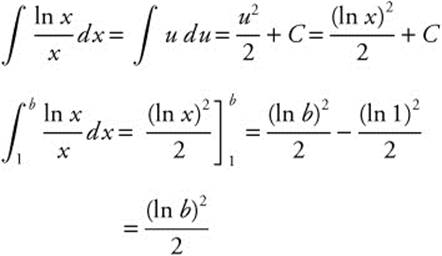
Let 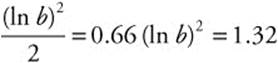 .
.
ln ![]()
82. The correct answer is (B).
(See Figure 2TS-7.)
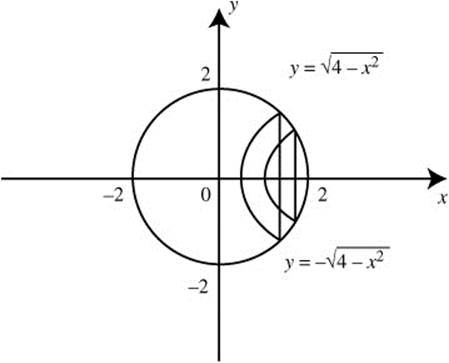
Figure 2TS-7
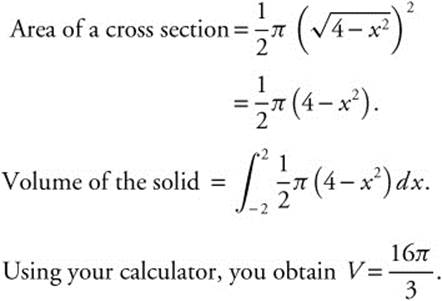
83. The correct answer is (A).
Temperature of coffee
84. The correct answer is (A).
(See Figure 2TS-8.)
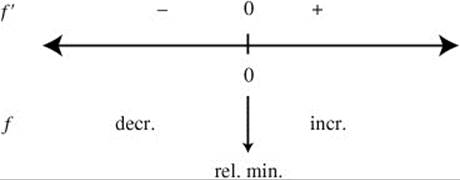
Figure 2TS-8
Only f has a relative minimum on (a, b).
85. The correct answer is (E).
(See Figure 2TS-9.)
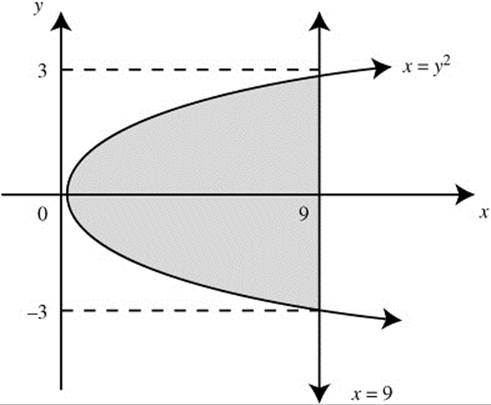
Figure 2TS-9
86. The correct answer is (E).
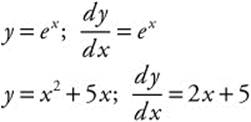
If the graphs have parallel tangents at a point, then the slopes of the tangents are equal.
Enter y1 = ex and y2 = 2x + 5. Using the [Intersection] function on your calculator, you obtain x = −2.45 and x = 2.25. (See Figure 2TS-10.)
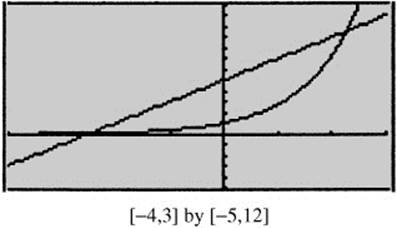
Figure 2TS-10
87. The correct answer is (E).
88. The correct answer is (B).
h′(x) = (x − 5)3
(See Figure 2TS-11.)
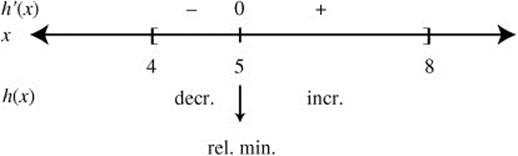
Figure 2TS-11
Thus, h has a relative minimum at x = 5.
89. The correct answer is (C).
(See Figure 2TS-12.)
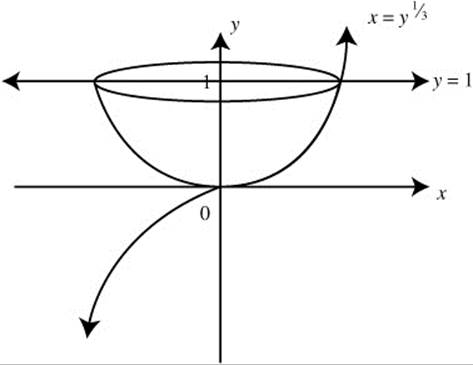
Figure 2TS-12
Using your calculator, you obtain V = 3π/5.
90. The correct answer is (E).
(See Figure 2TS-13.)
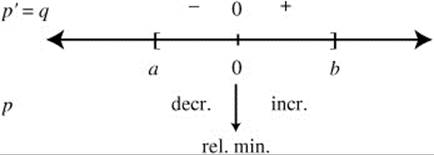
Figure 2TS-13
The graph in choice (E) is the one that satisfies the behavior of p.
91. The correct answer is (E).
(See Figure 2TS-14.)
Figure 2TS-14
The function f is not differentiable at x = 3, has a relative maximum at x = 3, and has no point of inflection. Thus, all three statements are untrue.
92. The correct answer is (B).
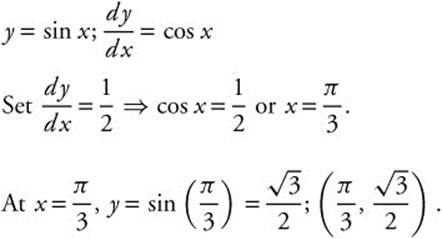
Equation of tangent line at ![]() :
:
Solutions to AB Practice Exam 2—Section II
Section II—Part A
1. (See Figure 2TS-15.)
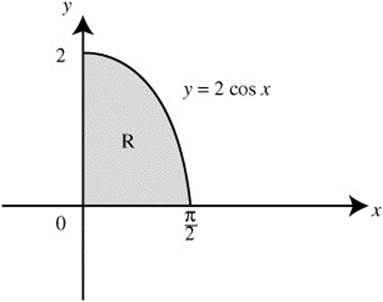
Figure 2TS-15
2. (A) (See Figure 2TS-16.)
Figure 2TS-16
(B) Average Temperature
Using your calculator, you obtain:
(C) Set the temperature of the liquid equal to 86°F. Using your calculator, let ![]() .
.
To find the intersection point of y1 and y2, let y3 = y1 − y2 and find the zeros of y3. Using the [Zero] function of your calculator, you obtain x = 15.708. Since y1 < y2 on the interval 15.708 < x ≤ 20, the temperature of the liquid is below 86°F when 15.708 < t ≤ 20.
(D) Average temperature below 86°
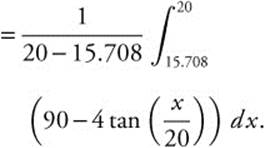
Using your calculator, you obtain:
Section II—Part B
3. (A) The midpoints of 3 subintervals of equal length are:
t = 4, 12, and 20.
The length of each interval is ![]() .
.
Thus,
(D) a(t) = 0 at t = 6 and t = 14, since the slopes of tangents at t = 6 and t = 14 are 0.
4.
(D) (See Figure 2TS-17.)
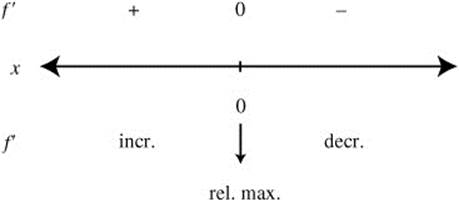
Figure 2TS-17
![]()
f(0) = 3, since f has only one critical point (at x = 0), thus at x = 0, f has an absolute maximum. The absolute maximum value is 3.
(E)
Setting
f′(x) > 0 if x < 0 and f′(x) if x > 0. Thus, f has a relative maximum at x = 0, and since it is the only critical point, f has an absolute maximum at x = 0. Since f(0) = a, the absolute maximum for f is a.
5.
(B) The function f increases on (0, 1) and decreases on (1, 3). Thus f has a relative maximum at x = 1. Also, f decreases on (−3, −1) and increases on (−1, 0). Thus, f has a relative minimum at x = −1.
(C) f′(x) = g(x) and f″(x) = g′(x) (See Figure 2TS-18.)
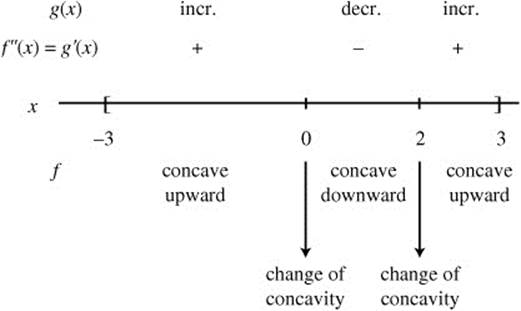
Figure 2TS-18
The function f has a change of concavity at x = 0 and x = 2. Thus, f has a point of inflection at x = 0 and x = 2.
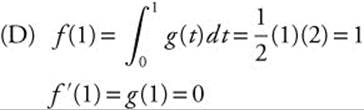
Thus, m = 0, point (1, 1); the equation of the tangent line to f(x) at x = 1 is y = 1.
6.
Equation of tangent:
Since e0 = 1, ![]() .
.
Thus, ![]() .
.
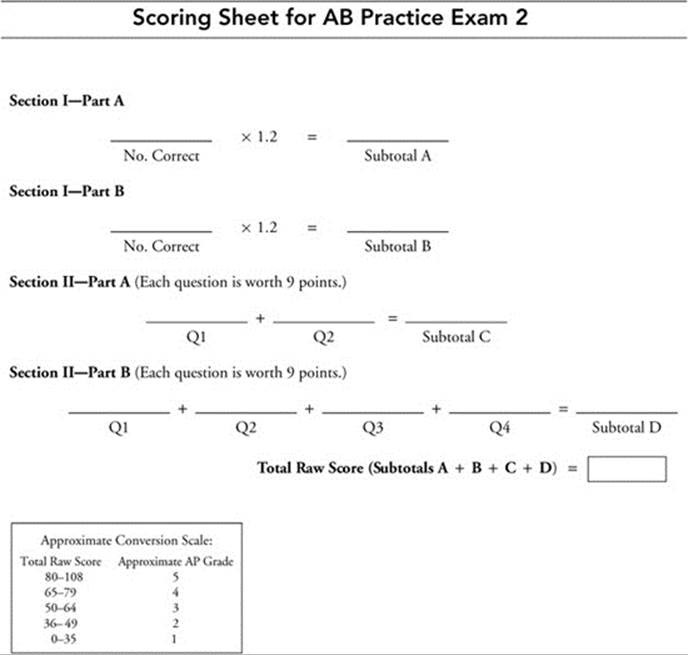
Scoring Sheet for AB Practice Exam 2