Calculus AB and Calculus BC
DIAGNOSTIC TESTS
Diagnostic Test Calculus BC
All questions are linked to their individual answers. Simply click on the question numbers to move back and forth.
SECTION I
Part A TIME: 55 MINUTES
The use of calculators is not permitted for this part of the examination.
There are 28 questions in Part A, for which 55 minutes are allowed. Because there is no deduction for wrong answers, you should answer every question, even if you need to guess.
Directions: Choose the best answer for each question.
1. ![]()
(A) 3
(B) 1
(C) −3
(D) ∞
(E) 0
2. 
(A) 1
(B) nonexistent
(C) 0
(D) −1
(E) none of these
3. If, for all x, f ′(x) = (x − 2)4 (x − 1)3, it follows that the function f has
(A) a relative minimum at x = 1
(B) a relative maximum at x = 1
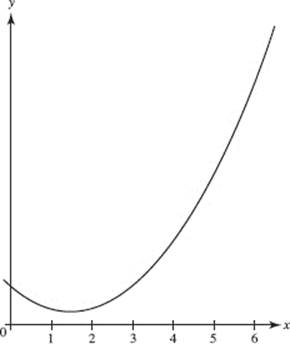
(C) both a relative minimum at x = 1 and a relative maximum at x = 1
(D) neither a relative maximum nor a relative minimum
(E) relative minima at x = 1 and at x = 2
4. Let ![]() Which of the following statements is (are) true?
Which of the following statements is (are) true?
I. F ′(0) = 5
II. F(2) < F(6)
III. F is concave upward.
(A) I only
(B) II only
(C) III only
(D) I and II only
(E) I and III only
5. If f (x) = 10x and 101.04 ![]() 10.96, which is closest to f ′(1)?
10.96, which is closest to f ′(1)?
(A) 0.24
(B) 0.92
(C) 0.96
(D) 10.5
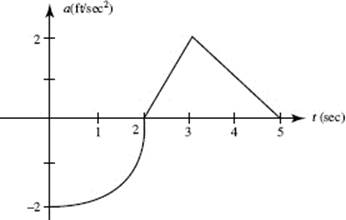
(E) 24
6. If f is differentiable, we can use the line tangent to f at x = a to approximate values of f near x = a. Suppose this method always underestimates the correct values. If so, then at x = a, the graph of f must be
(A) positive
(B) increasing
(C) decreasing
(D) concave upward
(E) concave downward
7. The region in the first quadrant bounded by the x-axis, the y-axis, and the curve of y = e− x is rotated about the x-axis. The volume of the solid obtained is equal to
(A) π
(B) 2π
(C) ![]()
(D) ![]()
(E) none of these
8. ![]() is equal to
is equal to
(A) ![]()
(B) ln ![]()
(C) ![]()
(D) ![]()
(E) ln 2
9. ![]()
(A) = 0
(B) = 1
(C) = e
(D) = ∞
(E) does not exist
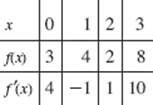
Questions 10 and 11. Use the table below, which shows the values of differentiable functions f and g.
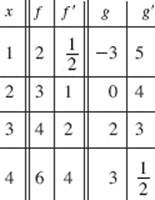
10. If P(x) = g2 (x), then P ′(3) equals
(A) 4
(B) 6
(C) 9
(D) 12
(E) 18
11. If H(x) = f −1(x), then H ′(3) equals
(A) ![]()
(B) ![]()
(C) ![]()
(D) ![]()
(E) 1
12. ![]()
(A) 1
(B) −1
(C) 2 − e
(D) ![]()
(E) e − 1
13. The graph of ![]() is concave upward when
is concave upward when
(A) x > 3
(B) 1 < x < 3
(C) x > 1
(D) x < 1
(E) x < 3
14. As an ice block melts, the rate at which its mass, M, decreases is directly proportional to the square root of the mass. Which equation describes this relationship?
(A) ![]()
(B) ![]()
(C) ![]()
(D) ![]()
(E) ![]()
15. The length of the curve y = 2x3/2 between x = 0 and x = 1 is equal to
(A) 
(B) ![]()
(C) ![]()
(D) ![]()
(E) none of these
16. If ![]() = kx, and if x = 2 when t = 0 and x = 6 when t = 1, then k equals
= kx, and if x = 2 when t = 0 and x = 6 when t = 1, then k equals
(A) ln 4
(B) 8
(C) e3
(D) 3
(E) none of these
17. If y = x2 ln x (x > 0), then y ″ is equal to
(A) 3 + ln x
(B) 3 + 2 ln x
(C) 3 ln x
(D) 3 + 3 ln x
(E) 2 + x + ln x
18. A particle moves along the curve given parametrically by x = tan t and y = 2 sin t. At the instant when ![]() the particle’s speed equals
the particle’s speed equals
(A) ![]()
(B) ![]()
(C) ![]()
(D) ![]()
(E) none of these
19. Suppose ![]() and y = 2 when x = 0. Use Euler’s method with two steps to estimate y at x = 1.
and y = 2 when x = 0. Use Euler’s method with two steps to estimate y at x = 1.
(A) 1
(B) 2
(C) 3
(D) 4
(E) ![]()
Questions 20 and 21. The graph below consists of a quarter-circle and two line segments, and represents the velocity of an object during a 6-second interval.
20. The object’s average speed (in units/sec) during the 6-second interval is
(A) ![]()
(B) ![]()
(C) −1
(D) ![]()
(E) 1
21. The object’s acceleration (in units/sec2) at t = 4.5 is
(A) 0
(B) −1
(C) −2
(D) ![]()
(E) ![]()
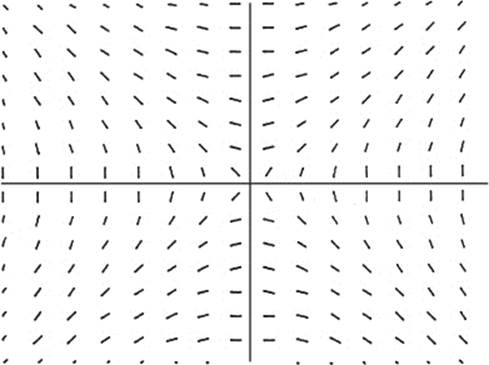
22. Which of the following equations can be a solution of the differential equation whose slope field is shown above?
(A) 2xy = 1
(B) 2x + y = 1
(C) 2x2 + y2 = 1
(D) 2x2 − y2 = 1
(E) y = 2x2 + 1
23. If y is a differentiable function of x, then the slope of the curve of xy2 − 2y + 4y3 = 6 at the point where y = 1 is
(A) ![]()
(B) ![]()
(C) ![]()
(D) ![]()
(E) 2
24. For the function f shown in the graph, which has the smallest value on the interval 2 ≤ x ≤ 6?
(A) ![]()
(B) The left Riemann sum with 8 subintervals.
(C) The right Riemann sum with 8 subintervals.
(D) The midpoint Riemann sum with 8 subintervals.
(E) The trapezoidal approximation with 8 subintervals
25. The table shows some values of a differentiable function f and its derivative f ′:
Find ![]()
(A) 5
(B) 6
(C) 11.5
(D) 14
(E) 17
26. The solution of the differential equation ![]() for which y = −1 when x = 1 is
for which y = −1 when x = 1 is
(A) ![]()
(B) ![]()
(C) ln y2 = x2 − 1 for all x
(D) ![]()
(E) ![]()
27. The base of a solid is the region bounded by the parabola y2 = 4x and the line x = 2. Each plane section perpendicular to the x-axis is a square. The volume of the solid is
(A) 6
(B) 8
(C) 10
(D) 16
(E) 32
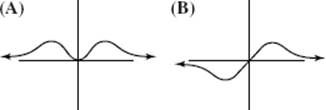
28. Which of the following could be the graph of ![]()
Part B TIME: 50 MINUTES
Some questions in this part of the examination require the use of a graphing calculator. There are 17 questions in Part B, for which 50 minutes are allowed. Because there is no deduction for wrong answers, you should answer every question, even if you need to guess.
Directions: Choose the best answer for each question. If the exact numerical value of the correct answer is not listed as a choice, select the choice that is closest to the exact numerical answer.
29. When partial fractions are used, the decomposition of ![]() is equal to
is equal to
(A) ![]()
(B) ![]()
(C) ![]()
(D) ![]()
(E) ![]()
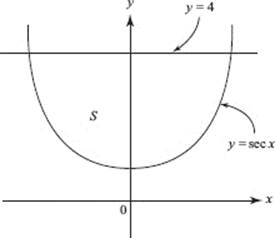
30. The region S in the figure above is bounded by y = sec x and y = 4. What is the volume of the solid formed when S is rotated about the x-axis?
(A) 0.304
(B) 39.867
(C) 53.126
(D) 54.088
(E) 108.177
31. The series
![]()
converges
(A) for all real x
(B) if 0 ![]() x < 2
x < 2
(C) if 0 < x ![]() 2
2
(D) only if x = 1
(E) for all x except 0 < x < 2
32. If f (x) is continuous at the point where x = a, which of the following statements may be false?
(A) ![]()
(B) ![]()
(C) f ′(a) exists.
(D) f (a) is defined.
(E) ![]()
33. A Maclaurin polynomial is to be used to approximate y = sin x on the interval − π ![]() x
x ![]() π. What is the least number of terms needed to guarantee no error greater than 0.1?
π. What is the least number of terms needed to guarantee no error greater than 0.1?
(A) 3
(B) 4
(C) 5
(D) 6
(E) none of these
34. Find the area bounded by the y-axis and the curve defined parametrically by x(t) = 4 − t2, y(t) = 2t.
(A) 6.328
(B) 8.916
(C) 10.667
(D) 12.190
(E) 74.529
35. Which series diverges?
(A) ![]()
(B) ![]()
(C) ![]()
(D) ![]()
(E) ![]()
36. If x = 2t − 1 and y = 3 − 4t2, then ![]() is
is
(A) 4t
(B) −4t
(C) ![]()
(D) 2(x + 1)
(E) −4(x + 1)
37. For the substitution x = sin θ, which integral is equivalent to 
(A) ![]()
(B) ![]()
(C) ![]()
(D) ![]()
(E) none of these
38. The coefficient of x3 in the Taylor series of ln (1 − x) about x = 0 (the Maclaurin series) is
(A) ![]()
(B) ![]()
(C) ![]()
(D) 0
(E) ![]()
39. The rate at which a rumor spreads across a campus of college students is given by ![]() where P(T) represents the number of students who have heard the rumor after t days. If 200 students heard the rumor today (t = 0), how many will have heard it by midnight the day after tomorrow (t = 2)?
where P(T) represents the number of students who have heard the rumor after t days. If 200 students heard the rumor today (t = 0), how many will have heard it by midnight the day after tomorrow (t = 2)?
(A) 320
(B) 474
(C) 494
(D) 520
(E) 726
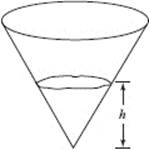
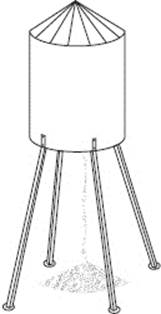
40. Water is poured at a constant rate into the conical reservoir shown above. If the depth of the water, h, is graphed as a function of time, the graph is
(A) decreasing
(B) constant
(C) linear
(D) concave upward
(E) concave downward
41. A 26-foot ladder leans against a building so that its foot moves away from the building at the rate of 3 feet per second. When the foot of the ladder is 10 feet from the building, the top is moving down at the rate of r feet per second, where r is
(A) ![]()
(B) ![]()
(C) ![]()
(D) ![]()
(E) ![]()
42. If ![]() then F ′(x) =
then F ′(x) =
(A) ![]()
(B) ![]()
(C) ![]()
(D) ![]()
(E) ![]()
43. The graph above shows an object’s acceleration (in ft/sec2). It consists of a quarter-circle and two line segments. If the object was at rest at t = 5 seconds, what was its initial velocity?
(A) −2 ft/sec
(B) 3 − π ft/sec
(C) 0 ft/sec
(D) π − 3 ft/sec
(E) π + 3 ft/sec
44. Water is leaking from a tank at the rate of R(t) = 5 arctan ![]() gallons per hour, where t is the number of hours since the leak began. How many gallons will leak out during the first day?
gallons per hour, where t is the number of hours since the leak began. How many gallons will leak out during the first day?
(A) 7
(B) 82
(C) 124
(D) 141
(E) 164
45. The first-quandrant area inside the rose r = 3 sin 2θ is approximately
(A) 0.59
(B) 1.50
(C) 1.77
(D) 3.00
(E) 3.53
Section II
Part A TIME: 30 MINUTES
2 PROBLEMS
A graphing calculator is required for some of these problems.
See instructions.
1. (a) For what positive values of x does 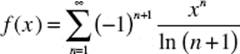 converge?
(b) How many terms are needed to estimate f (0.5) to within 0.01?
(c) Would an estimate for f (−0.5) using the same number of terms be more accurate, less accurate, or the same? Explain.
2. An object in motion along the x-axis has velocity v(t) = (t + et )sin t2 for 1 ≤ t ≤ 3.
(a) Sketch the graph of velocity as a function of time in the window [1,3] × [−15,20].
(b) When is the object moving to the left?
(c) Give one value of t from the interval in part (b) at which the speed of the object is increasing. Justify your answer.
(d) At t = 1 this object’s position was x = 10. Where is the object when t = 3?
Part B TIME: 60 MINUTES
4 PROBLEMS
No calculator is allowed for any of these problems.
If you finish Part B before time has expired, you may return to work on Part A, but you may not use a calculator.
3. When a faulty seam opened at the bottom of an elevated hopper, grain began leaking out onto the ground. After a while, a worker spotted the growing pile below and began making repairs. The following table shows how fast the grain was leaking (in cubic feet per minute) at various times during the 20 minutes it took to repair the hopper.
|
t (min) |
0 |
4 |
5 |
7 |
10 |
12 |
18 |
20 |
|
L(t) (ft3 /min) |
4 |
7 |
9 |
8 |
6 |
5 |
2 |
0 |
(a) Estimate L ′(15).
(b) Explain in this context what your answer to part a means.
(c) The falling grain forms a conical pile that the worker estimates to be 5 times as far across as it is deep. The pile was 3 feet deep when the repairs had been half completed. How fast was the depth increasing then?
(d) Estimate the total amount of grain that leaked out while the repairs were underway.
4. Let f be the function satisfying the differential equation ![]() and passing through (0, −1).
and passing through (0, −1).
(a) Sketch the slope field for this differential equation at the points shown.
(b) Use Euler’s method with a step size of 0.5 to estimate f (1).
(c) Solve the differential equation, expressing f as a function of x.
5. Let C represent the arc of the curve determined by P(t) = (9 − t2, 2 t ) between its y-intercepts. Let R represent the region bounded by C and the y-axis. Set up, but do not evaluate, an integral in terms of a single variable for:
(a) the area of R;
(b) the length of C;
(c) the volume of the solid generated when R is rotated around the y-axis.
6. The graph of function f consists of the semicircle and line segment shown in the figure. Define the area function ![]()
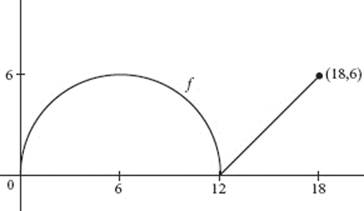
(a) Find A(6) and A(18).
(b) What is the average value of f on the interval 0 ≤ x ≤ 18?
(c) Write the equation of the line tangent to the graph of A at x = 6.
(d) Use this line to estimate the area between f and the x-axis on [0,7].
(e) Give the coordinates of any points of inflection on the graph of A. Justify your answer.