Calculus AB and Calculus BC
CHAPTER 4 Applications of Differential Calculus
G. FURTHER AIDS IN SKETCHING
It is often very helpful to investigate one or more of the following before sketching the graph of a function or of an equation:
(1) Intercepts. Set x = 0 and y = 0 to find any y- and x-intercepts respectively.
(2) Symmetry. Let the point (x, y) satisfy an equation. Then its graph is symmetric about
the x-axis if (x, −y) also satisfies the equation;
the y-axis if (−x, y) also satisfies the equation;
the origin if (−x, −y) also satisfies the equation.
(3) Asymptotes. The line y = b is a horizontal asymptote of the graph of a function f if either ![]() inspect the degrees of P(x) and Q(x), then use the Rational Function Theorem. The line x = c is a vertical asymptote of the rational function
inspect the degrees of P(x) and Q(x), then use the Rational Function Theorem. The line x = c is a vertical asymptote of the rational function ![]() if Q(c) = 0 but P(c) ≠ 0.
if Q(c) = 0 but P(c) ≠ 0.
(4) Points of discontinuity. Identify points not in the domain of a function, particularly where the denominator equals zero.
EXAMPLE 19
Sketch the graph of ![]()
SOLUTION: If x = 0, then y = −1. Also, y = 0 when the numerator equals zero, which is when ![]() A check shows that the graph does not possess any of the symmetries described above. Since y → 2 as x → ±∞, y = 2 is a horizontal asymptote; also, x = 1 is a vertical asymptote. The function is defined for all reals except x = 1 ; the latter is the only point of discontinuity.
A check shows that the graph does not possess any of the symmetries described above. Since y → 2 as x → ±∞, y = 2 is a horizontal asymptote; also, x = 1 is a vertical asymptote. The function is defined for all reals except x = 1 ; the latter is the only point of discontinuity.
We find derivatives: ![]()
From y ′ we see that the function decreases everywhere (except at x = 1), and from y ″ that the curve is concave down if x < 1, up if x > 1. See Figure N4–8.
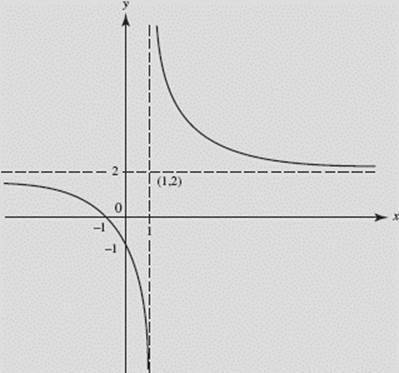
FIGURE N4–8
Verify the preceding on your calculator, using [−4,4] × [−4, 8].
EXAMPLE 20
Describe any symmetries of the graphs of
(a) 3y2 + x = 2; (b) y = x + ![]() (c) x2 − 3y2 = 27.
(c) x2 − 3y2 = 27.
SOLUTIONS:
(a) Suppose point (x, y) is on this graph. Then so is point (x, −y), since 3(−y)2 + x = 2 is equivalent to 3y2 + x = 2. Then (a) is symmetric about the x-axis.
(b) Note that point (−x, −y) satisfies the equation if point (x, y) does:
![]()
Therefore the graph of this function is symmetric about the origin.
(c) This graph is symmetric about the x-axis, the y-axis, and the origin. It is easy to see that, if point (x, y) satisfies the equation, so do points (x, −y), (−x, y), and (−x, −y).