Calculus AB and Calculus BC
CHAPTER 4 Applications of Differential Calculus
I. RELATING A FUNCTION AND ITS DERIVATIVES GRAPHICALLY
The following table shows the characteristics of a function f and their implications for f ’s derivatives. These are crucial in obtaining one graph from another. The table can be used reading from left to right or from right to left.
Note that the slope at x = c of any graph of a function is equal to the ordinate at c of the derivative of the function.
If f ′(c) does not exist, check the signs of f ′ as x increases through c: plus-to-minus yields a local maximum; minus-to-plus yields a local minimum; no sign change means no maximum or minimum, but check the possibility of a point of inflection.
AN IMPORTANT NOTE:
Tables and number lines showing sign changes of the function and its derivatives can be very helpful in organizing all of this information. Note, however, that the AP Exam requires that students write sentences that describe the behavior of the function based on the sign of its derivative.
EXAMPLE 25A
Given the graph of f (x) shown in Figure N4–12, sketch f ′(x).
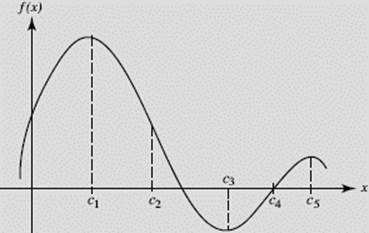
FIGURE N4–12
|
Point x = |
Behavior of f |
Behavior of f ′ |
|
c1 |
f (c1) is a local max |
f ′(c1) = 0; f ′ changes sign from + to − |
|
c2 |
c2 is an inflection point of f; the graph of f changes concavity from down to up |
f ′ changes from decreasing to increasing; f ′(c2) is a local minimum |
|
c3 |
f (c3) is a local minimum |
f ′(c3) = 0; f ′ changes sign from − to + |
|
c4 |
c4 is an inflection point of f; the graph of f changes concavity from up to down |
f ′ changes from increasing to decreasing; f ′(c4) is a local maximum |
|
c5 |
f (c5) is a local maximum |
f ′(c5) = 0; f ′ changes sign from + to − |
EXAMPLE 25B
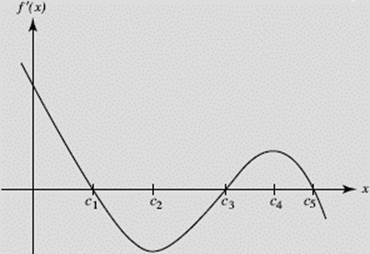
Given the graph of f ′(x) shown in Figure N4–13, sketch a possible graph of f.
FIGURE N4–13
SOLUTION: First, we note that f ′(−3) and f ′(2) are both 0. Thus the graph of f must have horizontal tangents at x = −3 and x = 2. Since f ′(x) < 0 for x < −3, we see that f must be decreasing there. Below is a complete signs analysis of f ′, showing what it implies for the behavior of f.
![]()
Because f ′ changes from negative to positive at x = −3, f must have a minimum there, but f has neither a minimum nor a maximum at x = 2.
We note next from the graph that f ′ is increasing for x < −1. This means that the derivative of f ′, f ″, must be positive for x < −1 and that f is concave upward there. Analyzing the signs of f ″ yields the following:
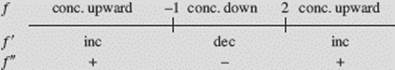
We conclude that the graph of f has two points of inflection, because it changes concavity from upward to downward at x = −1 and back to upward at x = 2. We use the information obtained to sketch a possible graph of f, shown in Figure N4–14. Note that other graphs are possible; in fact, any vertical translation of this f will do!
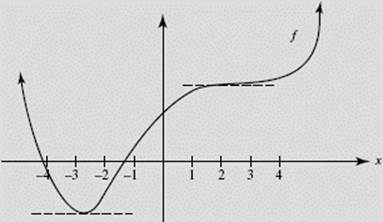
FIGURE N4–14