Calculus AB and Calculus BC
CHAPTER 6 Definite Integrals
D. DEFINITION OF DEFINITE INTEGRAL AS THE LIMIT OF A SUM: THE FUNDAMENTAL THEOREM AGAIN
Most applications of integration are based on the FTC. This theorem provides the tool for evaluating an infinite sum by means of a definite integral. Suppose that a function f (x) is continuous on the closed interval [a, b]. Divide the interval into n subintervals of lengths* Δxk. Choose numbers, one in each subinterval, as follows: x1 in the first, x2 in the second, …, xk in the kth, …, xn in the nth. Then
![]()
Any sum of the form ![]() is called a Riemann sum.
is called a Riemann sum.
AREA
If f (x) is nonnegative on [a, b], we see (Figure N6–1) that f (xk) Δxk can be regarded as the area of a typical approximating rectangle. As the number of rectangles increases, or, equivalently, as the width Δx of the rectangles approaches zero, the rectangles become an increasingly better fit to the curve. The sum of their areas gets closer and closer to the exact area under the curve. Finally, the area bounded by the x-axis, the curve, and the vertical lines x = a and x = b is given exactly by
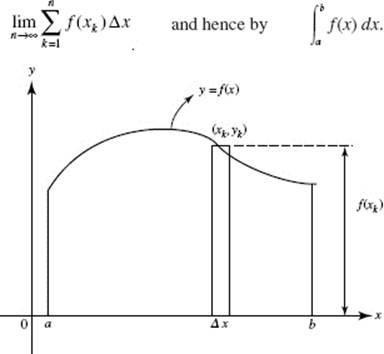
FIGURE N6–1
*It is not necessary that the subintervals be of equal length, but the formulation is generally simpler if they are.
What if f (x) is negative? Then any area above the graph and below the x-axis is counted as negative (Figure N6–2).
The shaded area above the curve and below the x-axis equals
![]()
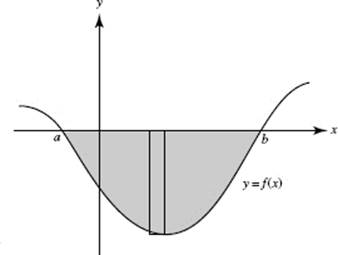
FIGURE N6–2
where the integral yields a negative number. Note that every product f (xk) Δx in the shaded region is negative, since f (xk) is negative for all x between a and b.
We see from Figure N6–3 that the graph of f crosses the x-axis at c, that area A1 lies above the x-axis, and that area A2 lies below the x-axis. Since, by property (5),
![]()
therefore
![]()
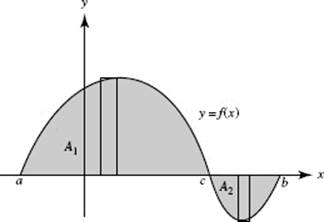
FIGURE N6–3
Note that if f is continuous then the area between the graph of f on [a, b] and the x-axis is given by
![]()
This implies that, over any interval within [a, b] for which f (x) < 0 (for which its graph dips below the x-axis), |f (x)| = −f (x). The area between the graph of f and the x-axis in Figure N6–3 equals
![]()
This topic is discussed further in Chapter 7.