Calculus AB and Calculus BC
AB Practice Examination 3
SECTION I
Part A TIME: 55 MINUTES
The use of calculators is not permitted for this part of the examination. There are 28 questions in Part A, for which 55 minutes are allowed. Because there is no deduction for wrong answers, you should answer every question, even if you need to guess.
Directions: Choose the best answer for each question.
1. ![]() (where [x] is the greatest integer in x) is
(where [x] is the greatest integer in x) is
(A) 1
(B) 2
(C) 3
(D) ∞
(E) nonexistent
2. 
(A) 1
(B) −1
(C) 0
(D) ∞
(E) none of these
3. If f (x) = x ln x, then f′″(e) equals
(A) ![]()
(B) 0
(C) ![]()
(D) ![]()
(E) ![]()
4. The equation of the tangent to the curve 2x2 − y4 = 1 at the point (−1, 1) is
(A) y = −x
(B) y = 2 − x
(C) 4y + 5x + 1 = 0
(D) x − 2y + 3 = 0
(E) x − 4y + 5 = 0
5. On which interval(s) does the function f (x) = x4 − 4x3 + 4x2 + 6 increase?
(A) x < 0 and 1 < x < 2
(B) x > 2 only
(C) 0 < x < 1 and x > 2
(D) 0 < x < 1 only
(E) 1 < x < 2 only
6. ![]()
(A) ![]()
(B) ![]()
(C) ![]()
(D) 2ln|4 + 2sinx| + C
(E) ![]()
7. A relative maximum value of the function ![]() is
is
(A) 1
(B) e
(C) ![]()
(D) ![]()
(E) none of these
8. If a particle moves on a line according to the law s = t5 + 2t3, then the number of times it reverses direction is
(A) 4
(B) 3
(C) 2
(D) 1
(E) 0
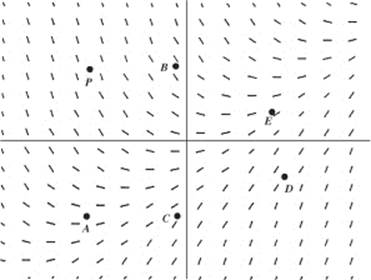
9. A particular solution of the differential equation whose slope field is shown above contains point P. This solution may also contain which other point?
(A) A
(B) B
(C) C
(D) D
(E) E
10. Let ![]() . Which of the following statements is (are) true?
. Which of the following statements is (are) true?
I. The domain of F is x ≠ ±1.
II. F(2) > 0.
III. The graph of F is concave upward.
(A) none
(B) I only
(C) II only
(D) III only
(E) II and III only
11. As the tides change, the water level in a bay varies sinusoidally. At high tide today at 8 A.M., the water level was 15 feet; at low tide, 6 hours later at 2 P.M., it was 3 feet. How fast, in feet per hour, was the water level dropping at noon today?
(A) 3
(B) ![]()
(C) ![]()
(D) ![]()
(E) ![]()
12. A smooth curve with equation y = f (x) is such that its slope at each x equals x2. If the curve goes through the point (−1, 2), then its equation is
(A) ![]()
(B) x3 − 3y + 7 = 0
(C) y = x3 + 3
(D) y − 3x3 − 5 = 0
(E) none of these
13. ![]() is equal to
is equal to
(A) ln(1 + e2u) + C
(B) ![]()
(C) ![]()
(D) tan−1eu + C
(E) ![]()
14. Given f (x) = log10x and log10(102) ![]() 2.0086, which is closest to f ′(100)?
2.0086, which is closest to f ′(100)?
(A) 0.0043
(B) 0.0086
(C) 0.01
(D) 1.0043
(E) 2
15. If G(2) = 5 and ![]() then an estimate of G(2.2) using a tangent-line approximation is
then an estimate of G(2.2) using a tangent-line approximation is
(A) 5.4
(B) 5.5
(C) 5.8
(D) 8.8
(E) 13.8
16. The area bounded by the parabola y = x2 and the lines y = 1 and y = 9 equals
(A) 8
(B) ![]()
(C) ![]()
(D) 32
(E) ![]()
17. Suppose ![]() if x ≠ 0 and f (0) = 1. Which of the following statements is (are) true of f ?
if x ≠ 0 and f (0) = 1. Which of the following statements is (are) true of f ?
I. f is defined at x = 0.
II. ![]()
III. f is continuous at x = 0.
(A) I only
(B) II only
(C) I and II only
(D) None of the statements is true.
(E) All are true.
18. Which function could have the graph shown below?
(A) ![]()
(B) ![]()
(C) ![]()
(D) ![]()
(E) ![]()
19. Suppose the graph of f is both increasing and concave up on a ≤ x ≤ b. Then, using the same number of subdivisions, and with L, R, M, and T denoting, respectively, left, right, midpoint, and trapezoid sums, it follows that
(A) R ≤ T ≤ M ≤ L
(B) L ≤ T ≤ M ≤ R
(C) R ≤ M ≤ T ≤ L
(D) L ≤ M ≤ T ≤ R
(E) none of these
20. ![]()
(A) + ∞
(B) 0
(C) ![]()
(D) −∞
(E) nonexistent
21. The only function that does not satisfy the Mean Value Theorem on the interval specified is
(A) f (x) = x2 − 2x on [−3, 1]
(B) ![]()
(C) ![]()
(D) ![]()
(E) ![]()
22. Suppose f ′(x) = x(x − 2)2(x + 3). Which of the following is (are) true?
I. f has a local maximum at x = −3.
II. f has a local minimum at x = 0.
III. f has neither a local maximum nor a local minimum at x = 2.
(A) I only
(B) II only
(C) III only
(D) I and II only
(E) I, II, and III
23. If ![]()
(A) ![]()
(B) ![]()
(C) ![]()
(D) ![]()
(E) ![]()
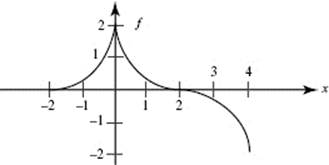
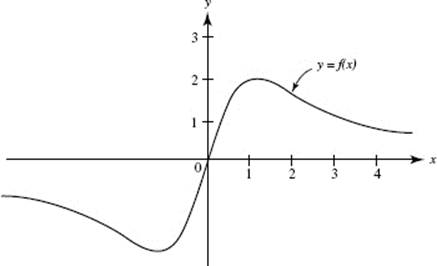
24. The graph of function f shown above consists of three quarter-circles.
Which of the following is (are) equivalent to ![]()
I. ![]()
II. ![]()
III. ![]()
(A) I only
(B) II only
(C) III only
(D) I and II only
(E) I, II, and III
25. The base of a solid is the first-quadrant region bounded by ![]() and each cross section perpendicular to the x-axis is a semicircle with a diameter in the xy-plane. The volume of the solid is
and each cross section perpendicular to the x-axis is a semicircle with a diameter in the xy-plane. The volume of the solid is
(A) ![]()
(B) ![]()
(C) ![]()
(D) ![]()
(E) ![]()
26. The average value of f (x) = 3 + |x| on the interval [−2, 4] is
(A) ![]()
(B) ![]()
(C) ![]()
(D) ![]()
(E) 6
27. ![]()
(A) ![]()
(B) ![]()
(C) 1
(D) 3
(E) nonexistent
28. The area of the region in the xy-plane bounded by the curves y = ex, y = e−x, and x = 1 is equal to
(A) ![]()
(B) ![]()
(C) ![]()
(D) 2e − 2
(E) none of these
Part B TIME: 50 MINUTES
Some questions in this part of the examination require the use of a graphing calculator. There are 17 questions in Part B, for which 50 minutes are allowed. Because there is no deduction for wrong answers, you should answer every question, even if you need to guess.
Directions: Choose the best answer for each question. If the exact numerical value of the correct answer is not listed as a choice, select the choice that is closest to the exact numerical answer.
29. ![]() Then f ′(x) =
Then f ′(x) =
(A) ![]()
(B) ![]()
(C) ![]()
(D) ![]()
(E) ![]()
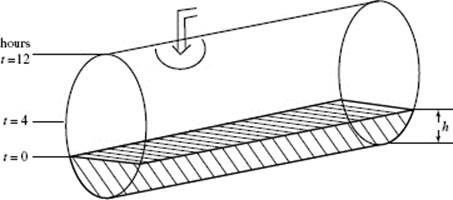
30. A cylindrical tank, shown in the figure above, is partially full of water at time t = 0, when more water begins flowing in at a constant rate. The tank becomes half full when t = 4, and is completely full when t = 12. Let h represent the height of the water at time t. During which interval is ![]() increasing?
increasing?
(A) none
(B) 0 < t < 4
(C) 0 < t < 8
(D) 0 < t < 12
(E) 4 < t < 12
31. A particle moves on a line according to the law s = f (t) so that its velocity v = ks, where k is a nonzero constant. Its acceleration is
(A) k2v
(B) k2s
(C) k
(D) 0
(E) none of these
32. A cup of coffee placed on a table cools at a rate of ![]() per minute, where H represents the temperature of the coffee and t is time in minutes. If the coffee was at 120°F initially, what will its temperature be 10 minutes later?
per minute, where H represents the temperature of the coffee and t is time in minutes. If the coffee was at 120°F initially, what will its temperature be 10 minutes later?
(A) 73°F
(B) 95°F
(C) 100°F
(D) 118°F
(E) 143°F
33. An investment of $4000 grows at the rate of 320e0.08t dollars per year after t years. Its value after 10 years is approximately
(A) $4902
(B) $8902
(C) $7122
(D) $12,902
(E) none of these
34. If f (x) = (1 + ex) then the domain of f −1(x) is
(A) (−∞,∞)
(B) (0,∞)
(C) (1,∞)
(D) {x|x ≥ 1}
(E) {x|x ≥ 2}
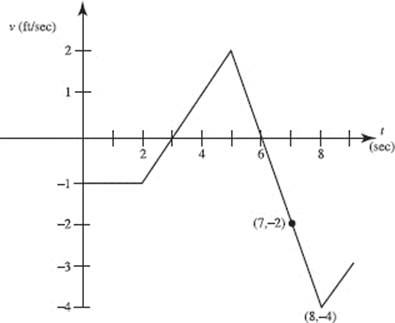
Questions 35 and 36. The graph shows the velocity of an object during the interval 0 ≤ t ≤ 9.
35. The object attains its greatest speed at t =
(A) 2
(B) 3
(C) 5
(D) 6
(E) 8
36. The object was at the origin at t = 3. It returned to the origin
(A) at t = 5
(B) at t = 6
(C) during 6 < t < 7
(D) at t = 7
(E) during 7 < t < 8
37. When the region bounded by the y-axis, y = ex, and y = 2 is rotated around the y-axis it forms a solid with volume
(A) 0.039
(B) 0.386
(C) 0.592
(D) 1.214
(E) 4.712
38. If ![]() is replaced by u, then
is replaced by u, then ![]() is equivalent to
is equivalent to
(A) ![]()
(B) ![]()
(C) ![]()
(D) ![]()
(E) ![]()
39. The line tangent to the graph of function f at the point (8,1) intersects the y-axis at y = 3. Find f ′(8).
(A) ![]()
(B) 0
(C) ![]()
(D) 1
(E) 3
40. How many points of inflection does the function f have on the interval 0 ≤ x ≤ 6 if ![]()
(A) 1
(B) 2
(C) 3
(D) 4
(E) 5
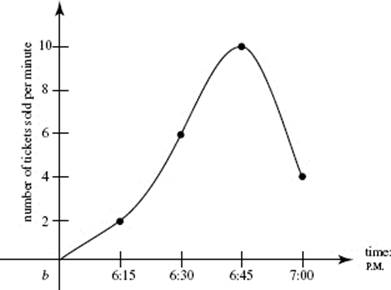
41. The graph shows the rate at which tickets were sold at a movie theater during the last hour before showtime. Using the right-rectangle method, estimate the size of the audience.
(A) 230
(B) 300
(C) 330
(D) 375
(E) 420
42. At what point of intersection of f (x) = 4sin x and g(x) = ln (x2) do their derivatives have the same sign?
(A) −5.2
(B) −4.0
(C) −1.2
(D) 2.6
(E) 7.8
43. Which statement is true?
(A) If f (x) is continuous at x = c, then f ′(c) exists.
(B) If f ′(c) = 0, then f has a local maximum or minimum at (c, f (c)).
(C) If f ″(c) = 0, then the graph of f has an inflection point at (c, f (c)).
(D) If f is differentiable at x = c, then f is continuous at x = c.
(E) If f is continuous on (a,b), then f attains a maximum value on (a, b).
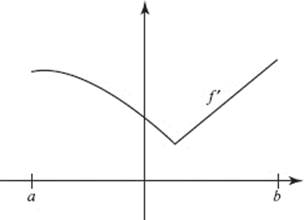
44. The graph of f ′ is shown above. Which statements about f must be true for a < x < b ?
I. f is increasing.
II. f is continuous.
III. f is differentiable.
(A) I only
(B) II only
(C) I and II only
(D) I and III only
(E) I, II, and III
45. After a bomb explodes, pieces can be found scattered around the center of the blast. The density of bomb fragments lying x meters from ground zero is given by ![]() fragments per square meter. How many fragments will be found within 20 meters of the point where the bomb exploded?
fragments per square meter. How many fragments will be found within 20 meters of the point where the bomb exploded?
(A) 13
(B) 278
(C) 556
(D) 712
(E) 4383
SECTION II
Part A TIME: 30 MINUTES
2 PROBLEMS
A graphing calculator is required for some of these problems.
1. A curve is defined by x2y − 3y2 = 48.
(a) Verify that ![]()
(b) Write an equation of the line tangent to this curve at (5,3).
(c) Using your equation from part (a), estimate the y-coordinate of the point on the curve where x = 4.93.
(d) Show that this curve has no horizontal tangent lines.
2. The table shows the depth of water, W, in a river, as measured at 4-hour intervals during a day-long flood. Assume that W is a differentiable function of time t.
|
t (hr) |
0 |
4 |
8 |
12 |
16 |
20 |
24 |
|
W(t) (ft) |
32 |
36 |
38 |
37 |
35 |
33 |
32 |
(a) Find the approximate value of W ′(16). Indicate units of measure.
(b) Estimate the average depth of the water, in feet, over the time interval 0 ≤ t ≤ 24 hours by using a trapezoidal approximation with subintervals of length Δt = 4 days.
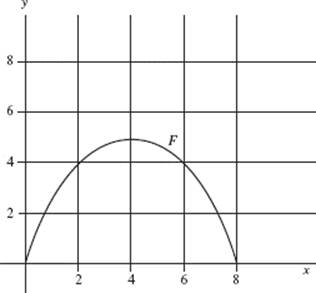
(c) Scientists studying the flooding believe they can model the depth of the water with the function ![]() where F(t) represents the depth of the water, in feet, after t hours. Find F ′(16) and explain the meaning of your answer, with appropriate units, in terms of the river depth.
where F(t) represents the depth of the water, in feet, after t hours. Find F ′(16) and explain the meaning of your answer, with appropriate units, in terms of the river depth.
(d) Use the function F to find the average depth of the water, in feet, over the time interval 0 ≤ t ≤ 24 hours.
Part B TIME: 60 MINUTES
4 PROBLEMS
No calculator is allowed for any of these problems.
If you finish Part B before time has expired, you may return to work on Part A, but you may not use a calculator.
3. The region R is bounded by the curves f (x) = cos(πx) − 1 and g(x) = x(2 − x), as shown in the figure.
(a) Find the area of R.
(b) A solid has base R, and each cross section perpendicular to the x-axis is an isosceles right triangle whose hypotenuse lies in R. Set up, but do not evaluate, an integral for the volume of this solid.
(b) Set up, but do not evaluate, an integral for the volume of the solid formed when R is rotated around the line y = 3.
4. Two autos, P and Q, start from the same point and race along a straight road for 10 seconds. The velocity of P is given by ![]() feet per second.
feet per second.
The velocity of Q is shown in the graph.
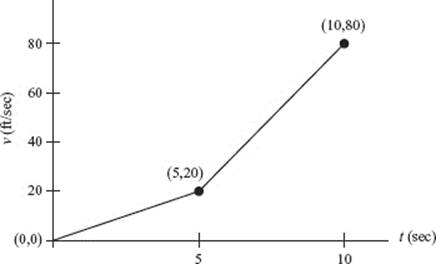
(a) At what time is P’s actual acceleration (in ft/sec2) equal to its average acceleration for the entire race?
(b) What is Q’s acceleration (in ft/sec2) then?
(c) At the end of the race, which auto was ahead? Explain.
5. Given the differential equation ![]()
(a) Sketch the slope field for this differential equation at the points shown in the figure.
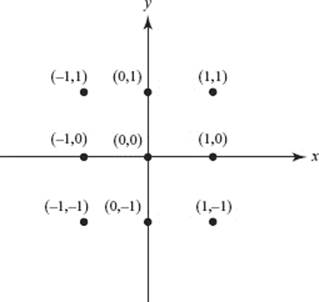
(b) Let f be the particular solution to the differential equation whose graph passes through (0,1). Express f as a function of x, and state its domain.
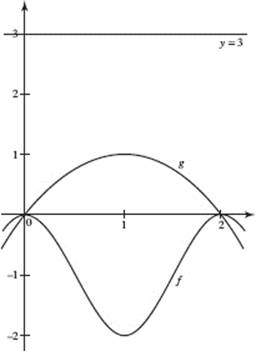
6. The graph shown is for ![]()
(a) What is ![]()
(b) What is ![]()
(c) At what value of x does f (x) = 0?
(d) Over what interval is f ′(x) negative?
(e) Let ![]() Sketch the graph of G on the same axes.
Sketch the graph of G on the same axes.
![]()
BC PRACTICE
EXAMINATIONS
![]()