Calculus AB and Calculus BC
Answers Explained
Multiple-Choice
Part A
1. (C) Use the Rational Function Theorem.
2. (D) 
3. (A) Since f ′(1) = 0 and f ′ changes from negative to positive there, f reaches a minimum at x = 1. Although f ′(2) = 0 as well, f ′ does not change sign there, and thus f has neither a maximum nor a minimum at x = 2.
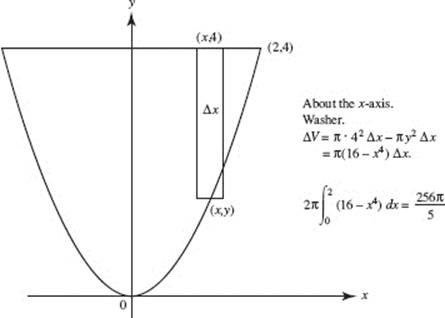
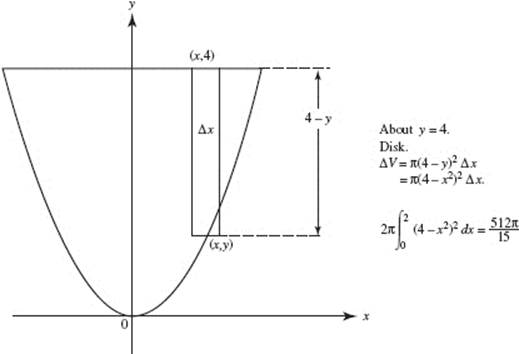
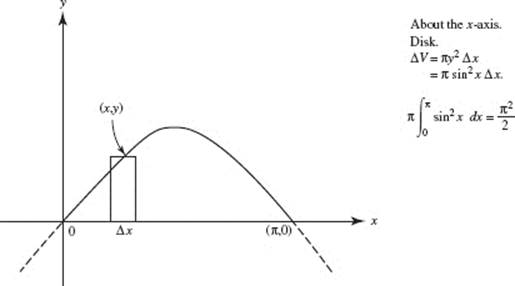
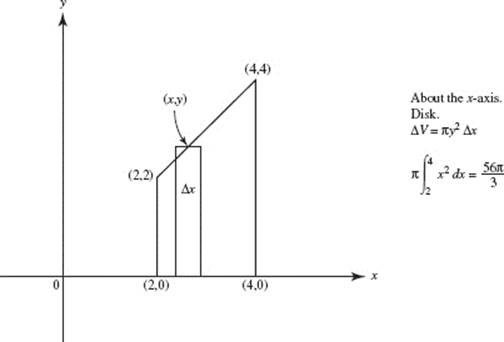
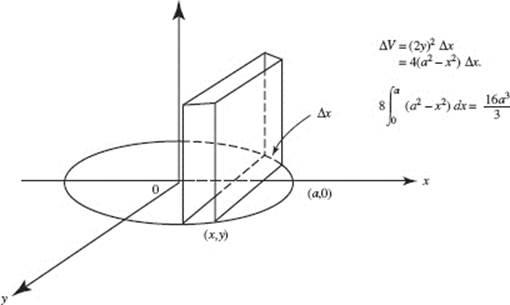
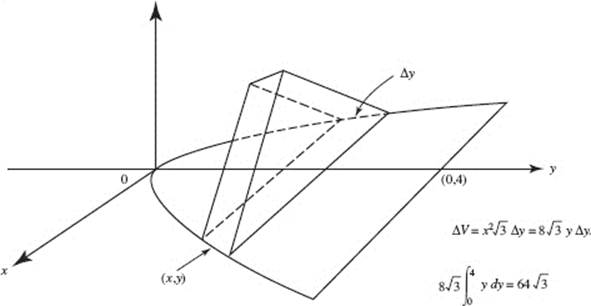
4. (D) ![]()
5. (E) ![]()
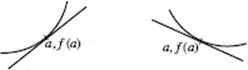
6. (D) The graph must look like one of these two:
7. (E) F ′(x) = 3 cos x cos 3x − sin x sin 3x.
![]()
8. (B) 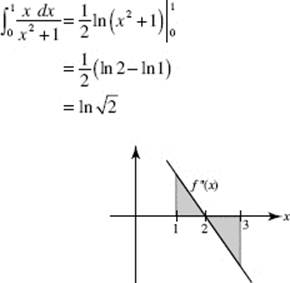
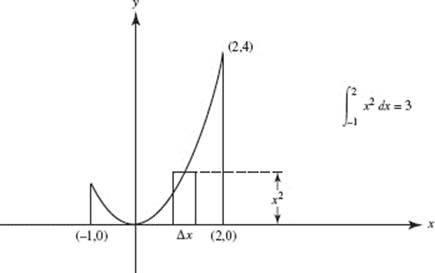
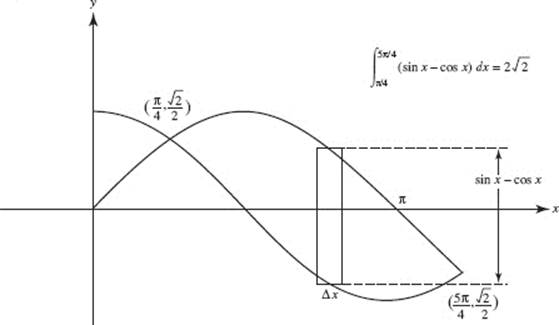
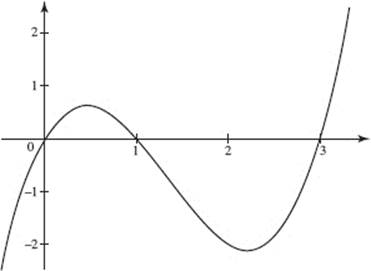
9. (C) Let ![]() Then f ′ increases for 1 < x < 2, then begins to decrease. In the figure above, the area below the x-axis, from 2 to 3, is equal in magnitude to that above the x-axis, hence,
Then f ′ increases for 1 < x < 2, then begins to decrease. In the figure above, the area below the x-axis, from 2 to 3, is equal in magnitude to that above the x-axis, hence, ![]()
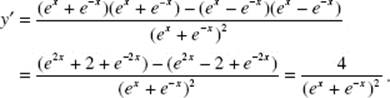
10. (D) P ′(x) = 2g(x) · g ′(x)
11. (E) Note that H(3) = f −1 (3) = 2. Therefore
![]()
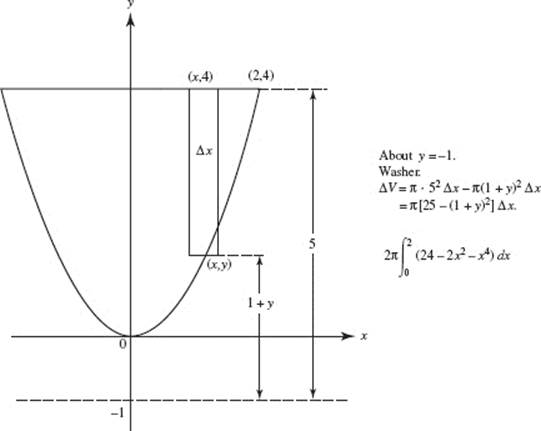
12. (D) Note that the domain of y is all x such that |x| ![]() 1 and that the graph is symmetric to the origin. The area is given by
1 and that the graph is symmetric to the origin. The area is given by
![]()
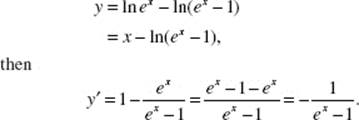
13. (E) Since
y ′ = 2(x − 3)−2 and = ![]()
y ″ is positive when x < 3.
14. (D) ![]() represents the rate of change of mass with respect to time; y is directly proportional to x if y = kx.
represents the rate of change of mass with respect to time; y is directly proportional to x if y = kx.
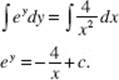
15. (B) ![]()
16. (E) [cos (x2)] ′ = −sin (x2) · 2x. The missing factor 2x cannot be created through introduction of constants alone.
17. (E) As the water gets deeper, the depth increases more slowly. Hence, the rate of change of depth decreases: ![]()
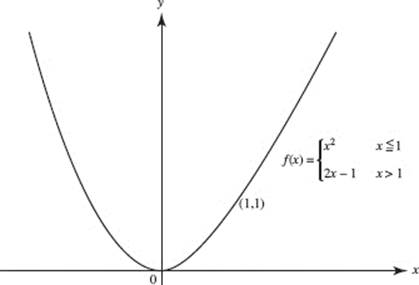
18. (D) The graph of f is shown in the figure above; f is defined and continuous at all x, including x = 1. Since
![]()
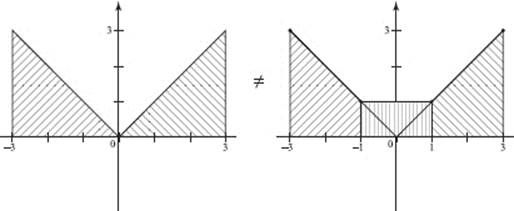
f ′(1) exists and is equal to 2.
19. (B) Since |x − 2| = 2 − x if x < 2, the limit as ![]()
20. (A) 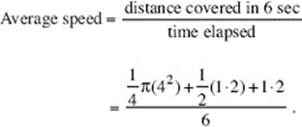
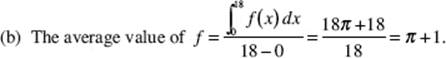
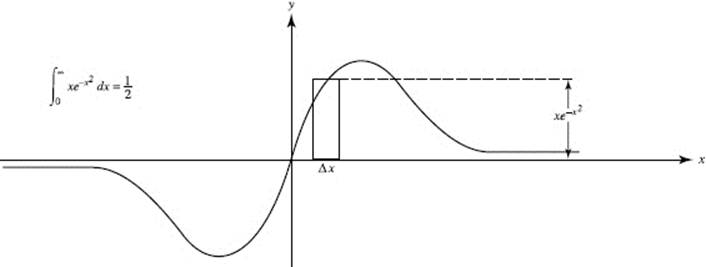
Note that the distance covered in 6 seconds is ![]() the area between the velocity curve and the t-axis.
the area between the velocity curve and the t-axis.
21. (C) Acceleration is the slope of the velocity curve, ![]()
22. (D) Particular solutions appear to be branches of hyperbolas.
23. (A) Differentiating implicitly yields 2xyy ′ + y2 − 2y ′ + 12y2 y ′ = 0. When y = 1, x = 4. Substitute to find y ′.
24. (C)
25. (A) ![]()
26. (B) Separate to get ![]() Since −(−1) = 1 + C implies that C = 0, the solution is
Since −(−1) = 1 + C implies that C = 0, the solution is ![]()
This function is discontinuous at x = 0. Since the particular solution must be differentiable in an interval containing the initial value x = 1, the domain is x > 0.
27. (E)
28. (C) Note that ![]() for all x.
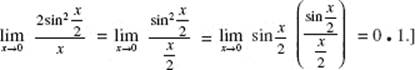
for all x.
Part B
29. (B) At x = 3, the equation of the tangent line is y − 8 = −4(x − 3), so f (x) ![]() −4(x − 3) + 8. f (3.02)
−4(x − 3) + 8. f (3.02) ![]() −4(0.02) + 8.
−4(0.02) + 8.
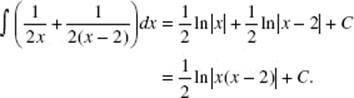
30. (C)
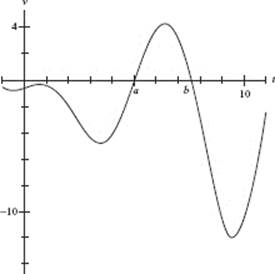
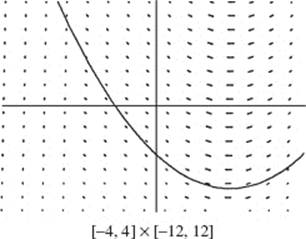
The velocity is graphed in [−1,11] × [−15, 5]. The object reverses direction when the velocity changes sign, that is, when the graph crosses the x-axis. There are two such reversals − at x = a and at x = b.
31. (D) The sign diagram shows that f changes from increasing to decreasing at x = 4
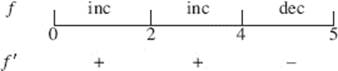
and thus f has a maximum there. Because f increases to the right of x = 0 and decreases to the left of x = 5, there are minima at the endpoints.
32. (D) Since f ′ decreases, increases, then decreases, f ″ changes from negative to positive, then back to negative. Hence, the graph of f changes concavity at x = 2 and x = 3.
33. (B)
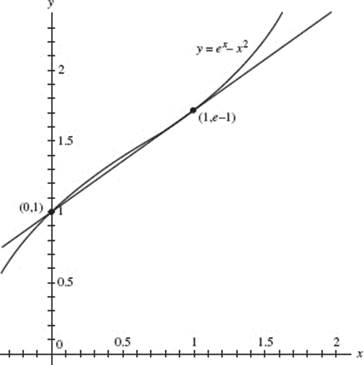
On the curve of f (x) − ex − x2, the two points labeled are (0,1) and (1, e − 1).
The slope of the secant line is ![]() Find c in [0,1] such that, f ′(c) = e − 2, or f ′(c) − (e − 2) = 0. Since f ′(x) = ex − 2x, c can be calculated by solving 0 = ex − 2x − (e − 2). The answer is 0.351.
Find c in [0,1] such that, f ′(c) = e − 2, or f ′(c) − (e − 2) = 0. Since f ′(x) = ex − 2x, c can be calculated by solving 0 = ex − 2x − (e − 2). The answer is 0.351.
34. (B)
Use disks; then ΔV = πR2 H = π(ln y)2 Δy. Note that the limits of the definite integral are 1 and 2. Evaluate the integral
![]()
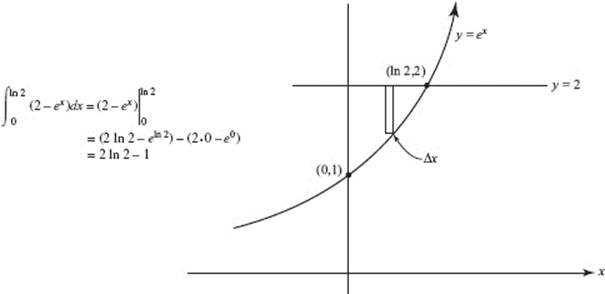
Alternatively, use shells*; then ΔV = 2πRHT = 2πx(2 − ex) Δx. Here, the upper limit of integration is the value of x for which ex = 2, namely, ln 2. Now evaluate
![]()
* No question requiring the use of the shells method will appear on the AP exam.
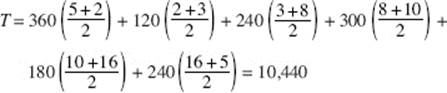
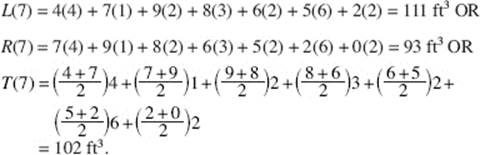
35. (C) Note that the rate is people per minute, so the first interval width from midnight to 6 A.M. is 360 minutes. The total number of people is estimated as the sum of the areas of six trapezoids:
36. (C) ![]() so v = 3t3 + c.
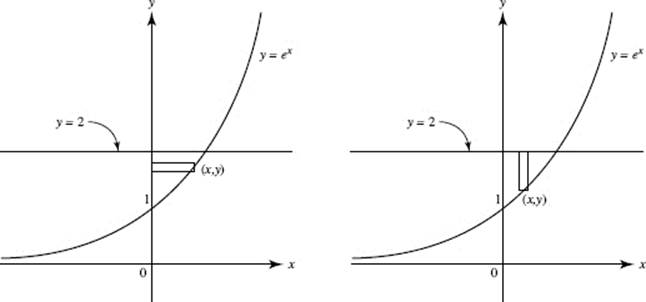
so v = 3t3 + c.
Since v = 1 when t = 0, c = 1.
Now ![]() so s = t3 + t + c.
so s = t3 + t + c.
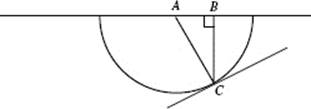
Since, s = 3 when t = 0, c = 3; then s = t3 + t + 3.
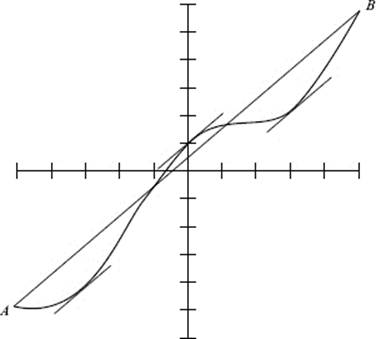
37. (A) Let u = x2. Then
![]()
38. (C)
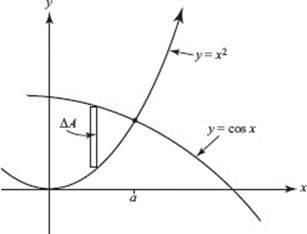
To find a, the point of intersection of y = x2 and y = cos (x), use your calculator to solve the equation x2 − cos (x) = 0. (Store the value for later use; a ≈ 0.8241.)
As shown in the diagram above, ΔA = (cos (x) − x2) Δx.
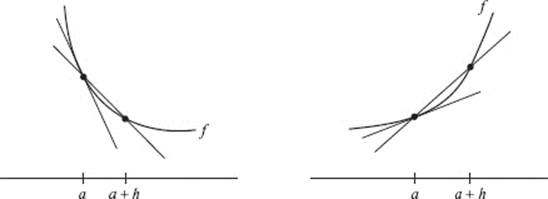
Evaluate the area: ![]()
39. (D) If x = 2t + 1, then ![]() When t = 0, x = 1; when t = 3, x = 7.
When t = 0, x = 1; when t = 3, x = 7.
40. (E) Use A(t) = A0 ekt, where the initial amount A0 is 50. Then A(t) = 50ekt. Since 45 g remain after 9 days, 45 = 50ek·9, which yields ![]()
To find t when 20 g remain, solve ![]() for t.
for t.
Thus, ![]()
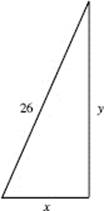
41. (C) See the figure above. Since x2 + y2 = 262, it follows that
![]()
at any time t. When x = 10, then y = 24 and it is given that ![]()
Hence, ![]()
42. (E) Let u = 2x and note that ![]()
Then ![]()
43. (D) ![]()
−v(0) = −π + 3; so v(0) = π − 3.
44. (C) ![]()
45. (D) Let y = (x3 − 4x2 + 8)ecos(x2). The equation of the tangent at point (2, y (2)) is y − y(2) = y ′(2)(x − 2). Note that y(2) = 0. To find the y-intercept, let x = 0 and solve for y: y = −2y ′(2). A calculator yields y = 4.161.
Free-Response
Part A
AB 1/BC 3. (a) ![]() (Review Chapter 3)
(Review Chapter 3)
(b) After 15 minutes the rate at which grain is leaking is slowing down at the rate of one half a cubic foot per minute per minute. (Review Chapter 3)
(c) Let h = the height of the cone and r = its radius. The cone’s diameter is given to be 5h, so ![]() and the cone’s volume,
and the cone’s volume,
![]()
Then
![]()
At t = 10 the table shows ![]() and it is given that h = 3; thus:
and it is given that h = 3; thus:
![]()
(Review Chapter 4)
(d) Use one of these Riemann sums:
(Review Chapter 6)
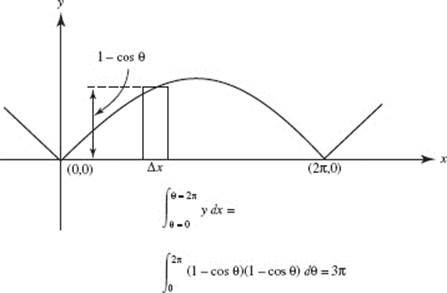
AB/BC 2. (a) Graph y = (x + ex) sin (x2) in [1, 3] × [−15, 20], Note that y represents velocity v and x represents time t.
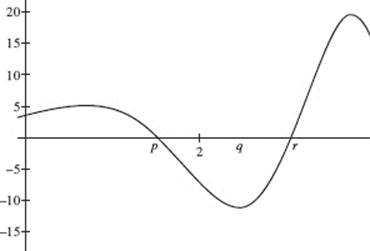
(b) The object moves to the left when the velocity is negative, namely, on the interval p < t < r. Use the calculator to solve (x + ex)(sin (x2)) = 0; then p = 1.772 and r = 2.507. The answer is 1.772 < t < 2.507.
(c) As the object moves to the left (with v(t) negative), the speed of the object increases when its acceleration v ′(t) is also negative, that is, when v(t) is decreasing. This is true when, for example, t = 2.
(d) The displacement of an object from time t1, to time t2, is equal to
![]()
Evaluate this integral on the calculator; to three decimal places the answer is 4.491. This means that at t = 3 the object is 4.491 units to the right of its position at t = 1, given to be x = 10. Hence, at t = 3 the object is at x = 10 + 4.491 = 14.491.
(Review Chapter 8)
Part B
AB 3. One possible graph of h is shown; it has the following properties:
• continuity on [−4,4],
• symmetry about the y-axis,
• roots at x = −1, 1,
• horizontal tangents at x = −2, 0, 2,
• points of inflection at x = −3, −2, −1, 1, 2, 3,
• corners at x = −3, 3.
(Review Chapter 4)
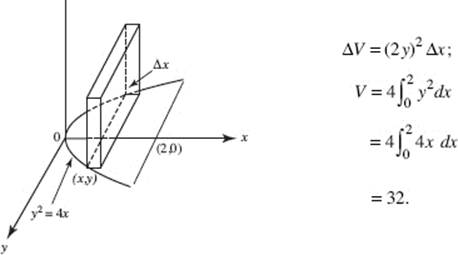
AB 4. (a) Draw elements as shown. Then
(b) ![]()
(c) Revolving the element around the x-axis generates disks. Then
(Review Chapter 7)
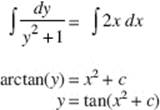
AB 5. (a) The differential equation ![]() is separable:
is separable:
If y = 0 when x = 2, then ![]() thus c = 3, and
thus c = 3, and ![]()
Solving for y gives the solution: ![]()
Note that ![]() is defined only if
is defined only if ![]()
![]() only if the numerator and denominator have the same sign.
only if the numerator and denominator have the same sign.
Since the particular solution must be continuous on an interval containing the initial point x = 2, the domain is ![]() (Review Chapter 9)
(Review Chapter 9)
(b) Since ![]() the function
the function ![]() has a horizontal asymptote at y = ln 3. (Review Chapter 2)
has a horizontal asymptote at y = ln 3. (Review Chapter 2)
AB/BC 6. (a) ![]()
(c) The line tangent to the graph of A at x = 6 passes through point (6, A(6)) or (6, 9π). Since A ′(x) = f (x), the graph of f shows that A ′(6) = f (6) = 6. Hence, an equation of the line is y − 9π = 6(x − 6).
(d) Use the tangent line; then A(x) = y ≈ 6(x − 6) + 9π, so A(7) ≈ 6(7 − 6) + 9π = 6 + 9π.
(e) Since f is increasing on [0,6], f ′ is positive there. Because f (x) = A ′(x), f ′(x) = A ″(x); thus A is concave upward for [0,6]. Similarly, the graph of A is concave downward for [6,12], and upward for [12,18]. There are points of inflection on the graph of A at (6,9π) and (12,18π).
Answers Explained
The explanations for questions not given below will be found in the answer section for Calculus AB Diagnostic Test. Some questions in Section I of Diagnostic Tests AB 1 and BC 1 are identical. Explanations of the answers for Questions 1–6, not given below, will be found in Section I of Calculus AB Diagnostic Test Answers 1–6.
Multiple-Choice
Part A
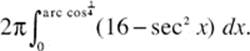
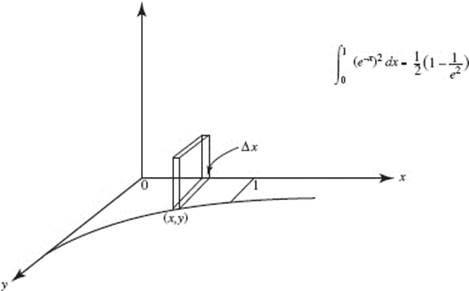
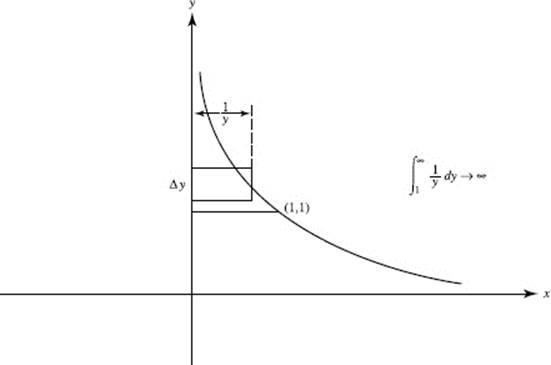
7. (D) The volume is given by ![]() an improper integral.
an improper integral.
9. (B) Let y = xx and take logarithms. ln ![]() this function has the indeterminate form ∞/∞. Apply L’Hôpital’s rule:
this function has the indeterminate form ∞/∞. Apply L’Hôpital’s rule:
![]()
So y → e0 or 1.
12. (A) Use the Parts Formula with u = x and dv = ex dx. Then du = dx and v = ex, and
![]()
15. (B) The arc length is given by the integral ![]() dx which is
dx which is
![]()
16. (E) Separating variables yields ![]() Integrating gives ln x = kt + C. Since x = 2 when t = 0, ln 2 = C. Then ln x = kt + ln 2. Using x = 6 when t = 1, it follows that ln 6 = k + ln 2, so k = ln 6 − ln 2 =
Integrating gives ln x = kt + C. Since x = 2 when t = 0, ln 2 = C. Then ln x = kt + ln 2. Using x = 6 when t = 1, it follows that ln 6 = k + ln 2, so k = ln 6 − ln 2 = ![]()
17. (B) y ′ = x + 2x ln x and ![]()
18. (D) ![]()
19. (C) At (0, 2), ![]() With step size
With step size ![]() the first step gives
the first step gives ![]()
where  so the next step produces
 ![]()
24. (B) Since function f is increasing on the interval [2,6], rectangles based on left endpoints of the subintervals will all lie completely below the curve, and thus have smaller areas than any of the other sums or the definite integral.
Part B
29. (B) Set
30. (E) S is the region bounded by y = sec x, the y-axis, and y = 4.
We send region S about the x-axis. Using washers, Δ V = π(R2 − r2) Δx. Symmetry allows us to double the volume generated by the first-quadrant portion of S. So for V we have
A calculator yields 108.177.
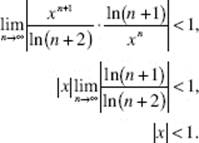
31. (A) Use the Ratio Test:
![]()
which equals zero if x ≠ 1. The series also converges if x = 1 (each term equals 0).
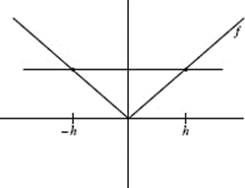
32. (C) The absolute value function f (x) = |x| is continuous at x = 0, but f ′(0) does not exist.
33. (B) The Maclaurin series is
![]()
When an alternating series satisfies the Altering Series Test, the sum is approximated by using a finite number of terms, and the error is less than the first term omitted. On the interval −π ![]() x
x ![]() π, the maximum error (numerically) occurs when x = π. Since
π, the maximum error (numerically) occurs when x = π. Since
![]()
four terms will suffice to assure no error greater than 0.1.
34. (B)
Graph x = 4 − t2 and y = 2t for −3 ≤ t ≤ 3 in the window [−1, 5] × [−1, 5]. Now ΔA = x Δy; the limits of integration are the two points where the curve cuts the y-axis, that is, where x = 0. In terms of t, these are t1 = 2 and t2 = + 2. So
![]()
35. (E) ![]()
36. (B) ![]()
37. (C) ![]() = cos θ dx = cos θ dθ, sin−1 0 = 0,
= cos θ dx = cos θ dθ, sin−1 0 = 0, ![]()
38. (C) The power series for ln (1 − x), if ![]()
39. (B) Solve by separation of variables; then
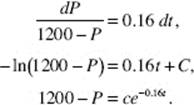
Use P(0) = 200; then c = 1000, so P(x) = 1200 − 1000e−0.16t. Now P(2) = 473.85.
40. (E) As the water gets deeper, the depth increases more slowly. Hence, the rate of change of depth decreases: d2 h/dt2 < 0.
45. (E) The first quadrant area is ![]() (3 sin 2θ)2 d
(3 sin 2θ)2 d![]() ≈ 3.53.
≈ 3.53.
Free-Response
Part A
1. (a) Use the Ratio Test:
The radius of convergence is 1. At the endpoint x = 1, ![]()
Since
![]()
this series converges by the Alternating Series Test. Thus ![]() converges for positive values 0 < x ≤ 1.
converges for positive values 0 < x ≤ 1.
(b) Because ![]() satisfies the Alternating Series Test, the error in approximation after n terms is less than the magnitude of the next term. The calculator shows that
satisfies the Alternating Series Test, the error in approximation after n terms is less than the magnitude of the next term. The calculator shows that ![]() at n = 5 terms.
at n = 5 terms.
(c) ![]() is a negative series. Therefore the error will be larger than the magnitude of the first omitted term, and thus less accurate than the estimate for f (0.5).
is a negative series. Therefore the error will be larger than the magnitude of the first omitted term, and thus less accurate than the estimate for f (0.5).
2. See solution for AB-2.
Part B
3. See solution for AB 1.
4. (a) Using the differential equation, evaluate the derivative at each point, then sketch a short segment having that slope. For example, at (−1, −1), ![]() draw a segment at (−1, −1) that decreases steeply. Repeat this process at each of the other points. The result is shown below.
draw a segment at (−1, −1) that decreases steeply. Repeat this process at each of the other points. The result is shown below.
(b) At (0, −1), ![]() For Δx = 0.5 and
For Δx = 0.5 and ![]() Δy = 0, so move to (0 + 0.5, −1 + 0) = (0.5, −1).
Δy = 0, so move to (0 + 0.5, −1 + 0) = (0.5, −1).
At (0.5, −1), ![]() Thus, for Δx = 0.5 and
Thus, for Δx = 0.5 and ![]() Δy = 1.
Δy = 1.
Move to (0.5 + 0.5, −1 + 1) = (1,0), then f (1) ≈ 0.
(c) The differential equation ![]() is separable:
is separable:
It is given that f passes through (0, −1), so −1 = tan(02 + c) and ![]()
The solution is ![]()
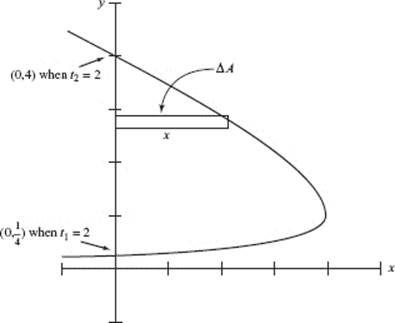
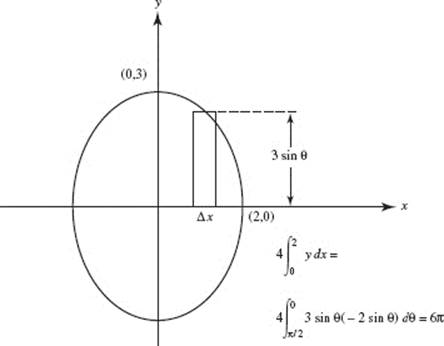
5. (a) To find the y-intercepts of the graph of P(t) = (9 − t2,2t), let x = 9 − t2 = 0, and solve: t = −3, 3. Then  and P(3) = (0, 8).
Draw a horizontal element of area as shown in the graph. Then:
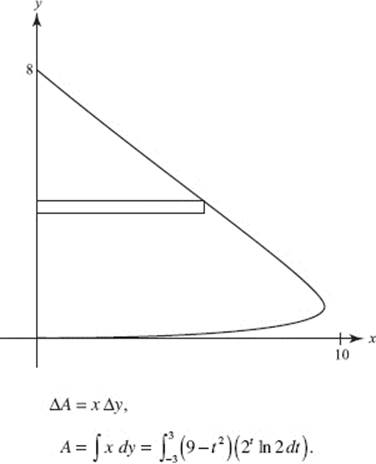
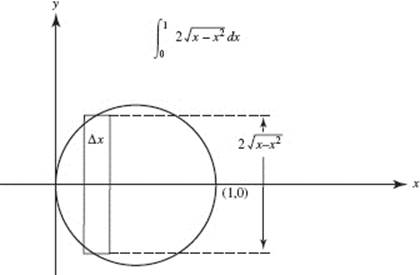
(b) 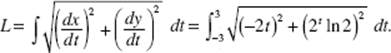
(c) Use disks. Then ΔV = πx2 Δy,
![]()
6. See solution for AB-6.
Answers Explained
1. (C) f (−2) = (−2)3 − 2(−2) − 1 = −5.
2. (E) The denominator, x2 + 1, is never 0.
3. (D) Since x − 2 may not be negative, x ![]() 2. The denominator equals 0 at x = 0 and x = 1, but these values are not in the interval x ≥ 2.
2. The denominator equals 0 at x = 0 and x = 1, but these values are not in the interval x ≥ 2.
4. (E) Since g(x) = 2, g is a constant function. Thus, for all f (x), g(f (x)) = 2.
5. (D) f (g(x)) = f (2) = −3.
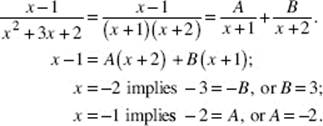
6. (B) Solve the pair of equations
![]()
Add to get A; substitute in either equation to get B. A = 2 and B = 4.
7. (C) The graph of f (x) is symmetrical to the origin if f (−x) = −f (x). ln (C), f (−x) = (−x)3 + 2(−x) = −x3 − 2x = −(x3 + 2x) = −f (x).
8. (C) For g to have an inverse function it must be one-to-one. Note, that although the graph of y = xe−x2 is symmetric to the origin, it is not one-to-one.
9. (B) Note that ![]() the sine function varies from −1 to 1 as the argument varies from
the sine function varies from −1 to 1 as the argument varies from ![]()
10. (E) The maximum value of g is 2, attained when cos x = −1. On [0,2π], cos x = −1 for x = π.
11. (C) f is odd if f (−x) = −f (x). ln (C), f (−x) = (−x)3 + 1 = −x3 + 1 ≠ −f (x)
12. (B) Since f (q) = 0 if q = 1 or q = −2, f (2x) = 0 if 2x, a replacement for q, equals 1 or −2.
13. (B) f (x) = x(x2 + 4x + 4) = x(x + 2)2; f (x) = 0 for x = 0 and x = −2.
14. (E) Solving simultaneously yields (x + 2)2 = 4x; x2 + 4x + 4 = 4x; x2 + 4 = 0.
There are no real solutions.
15. (A) The reflection of y = f (x) in the y-axis is y = f (−x).
16. (B) If g is the inverse of f, then f is the inverse of g. This implies that the function f assigns to each value g(x) the number x.
17. (D) Since f is continuous, then, if f is negative at a and positive at b, f must equal 0 at some intermediate point. Since f (1) = −2 and f (2) = 13, this point is between 1 and 2.
18. (D) The function sin bx has period ![]() Then
Then ![]()
19. (A) Since ln q is defined only if q > 0, the domain of ln cos x is the set of x for which cos x > 0, that is, when 0 < cos x ![]() 1. Thus − ∞ < ln cos x
1. Thus − ∞ < ln cos x ![]() 0.
0.
20. (E) ![]() implies
implies ![]() Then
Then ![]() and 3 = b1/2. So 32 = b.
and 3 = b1/2. So 32 = b.
21. (E) Interchange x and y: x = y3 + 2.
Solve for y: ![]()
22. (D) Since f (1) = 0, x − 1 is a factor of f. Since f (x) divided by x − 1 yields x2 − x − 2, f (x) = (x − 1) (x + 1) (x − 2); the roots are x = 1,−1, and 2.
23. (B) If ![]() then − ∞< tan x < ∞ and 0 < etanx < ∞.
then − ∞< tan x < ∞ and 0 < etanx < ∞.
24. (A) The reflection of f (x) in the x-axis is −f (x).
25. (C) f (x) attains its maximum when ![]() does. The maximum value of the sine function is 1; the smallest positive occurrence is at
does. The maximum value of the sine function is 1; the smallest positive occurrence is at ![]() Set
Set ![]() equal to
equal to ![]()
26. (A) arccos ![]()
27. (A) Interchange x and y: x = 2e−y
Solve for y: ![]()
Thus ![]()
28. (C) The function in (C) is not one-to-one since, for each y between ![]() (except 0), there are two x’s in the domain.
(except 0), there are two x’s in the domain.
29. (D) The domain of the In function is the set of positive reals. The function g(x) > 0 if x2 < 9.
30. (C) Since the domain of f (g) is (−3, 3), ln (9 − x2) takes on every real value less than or equal to ln 9.
31. (A) Substituting t2 = x − 3 in y(t) = t2 + 4 yields y = x + 1.
32. (D) Using the identity ![]()
33. (D) 2 cos 5![]() = 0 when
= 0 when ![]()
34. (C) If 2 + 2 cos ![]() = 3, then
= 3, then ![]()
35. (B) For polar functions x = r cos ![]() . Solving (
. Solving (![]() − 2 cos
− 2 cos ![]() ) cos
) cos ![]() = 2 yields
= 2 yields ![]() ≈ 5.201, and thus y = r sin
≈ 5.201, and thus y = r sin ![]() = (5.201 − 2 cos 5.201)sin 5.201.
= (5.201 − 2 cos 5.201)sin 5.201.
Answers Explained
1. (B) The limit as x → 2 is 0 ÷ 8.
2. (D) Use the Rational Function Theorem. The degrees of P(x) and Q(x) are the same.
3. (C) Remove the common factor x − 3 from numerator and denominator.
4. (A) The fraction equals 1 for all nonzero x.
5. (D) Note that ![]()
6. (B) Use the Rational Function Theorem.
7. (A) Use the Rational Function Theorem.
8. (E) Use the Rational Function Theorem.
9. (C) The fraction is equivalent to ![]() the denominator approaches ∞
the denominator approaches ∞
10. (D) Since ![]() therefore, as x → −∞ the fraction → +∞
therefore, as x → −∞ the fraction → +∞
11. (D) ![]()
12. (B) ![]()
13. (B) Because the graph of y = tan x has vertical asymptotes at ![]() the graph of the inverse function y = arctan x has horizontal asymptotes at
the graph of the inverse function y = arctan x has horizontal asymptotes at ![]()
14. (C) Since ![]() (provided x ≠ 3), y can be defined to be equal to 2 at x = 3, removing the discontinuity at that point.
(provided x ≠ 3), y can be defined to be equal to 2 at x = 3, removing the discontinuity at that point.
15. (B) Note that ![]()
16. (C) As x → 0, ![]() takes on varying finite values as it increases. Since the sine function repeats,
takes on varying finite values as it increases. Since the sine function repeats, ![]() oscillates, taking on, infinitely many times, each value between −1 and 1. The calculator graph of Y1 = sin(1/X) exhibits this oscillating discontinuity at x = 0.
oscillates, taking on, infinitely many times, each value between −1 and 1. The calculator graph of Y1 = sin(1/X) exhibits this oscillating discontinuity at x = 0.
17. (A) Note that, since ![]() both x = 2 and
both x = 2 and ![]() are vertical asymptotes. Also,
are vertical asymptotes. Also, ![]() is a horizontal asymptote.
is a horizontal asymptote.
18. (B) ![]() Use the Rational Function Theorem.
Use the Rational Function Theorem.
19. (B) Since |x| = x if x > 0 but equals −x if x < 0, ![]() while
while ![]()
20. (E) Note that x ![]() can be rewritten as
can be rewritten as ![]() and that, as x → ∞,
and that, as x → ∞, ![]()
21. (A) As x → π, (π − x) → 0.
22. (C) Since f (x) = x + 1 if x ≠ 1, ![]() exists (and is equal to 2).
exists (and is equal to 2).
23. (B) ![]() for all x ≠ 0. For f to be continuous at x = 0,
for all x ≠ 0. For f to be continuous at x = 0, ![]() must equal f (0).
must equal f (0). ![]()
24. (B) Only x = 1 and x = 2 need be checked. Since ![]() for x ≠ 1, 2, and
for x ≠ 1, 2, and ![]() = −3 = f (1), f is continuous at x = 1. Since
= −3 = f (1), f is continuous at x = 1. Since ![]() does not exist, f is not continuous at x = 2.
does not exist, f is not continuous at x = 2.
25. (C) As x → ±∞, y = f (x) → 0, so the x-axis is a horizontal asymptote. Also, as x → ±1, y → ∞, so x = ±1 are vertical asymptotes.
26. (C) As x → ∞, ![]() the denominator (but not the numerator) of y equals 0 at x = 0 and at x = 1.
the denominator (but not the numerator) of y equals 0 at x = 0 and at x = 1.
27. (D) The function is defined at 0 to be 1, which is also ![]()
28. (D) See Figure N2–1.
29. (E) Note, from Figure N2–1, that ![]()
30. (E) As x → ∞, the function sin x oscillates between −1 and 1; hence the limit does not exist.
31. (A) Note that ![]() if x ≠ 0 and that
if x ≠ 0 and that ![]()
32. (A) ![]()
33. (E) Verify that f is defined at x = 0, 1, 2, and 3 (as well as at all other points in [−1,3]).
34. (C) Note that ![]() However, f (2) = 1. Redefining f (2) as 0 removes the discontinuity.
However, f (2) = 1. Redefining f (2) as 0 removes the discontinuity.
35. (B) The function is not continuous at x = 0, 1, or 2.
36. (B) ![]()
37. (E) As x → 0−, arctan 
The graph has a jump discontinuity at x = 0. (Verify with a calculator.)
38. (D) No information is given about the domain of f except in the neighborhood of x = −3.
39. (E) As x → 0+, ![]() and therefore y → 0. As x → 0−,
and therefore y → 0. As x → 0−, ![]() → −∞, so
→ −∞, so ![]() and therefore
and therefore ![]() Because the two one-sided limits are not equal, the limit does not exist. (Verify with a calculator.)
Because the two one-sided limits are not equal, the limit does not exist. (Verify with a calculator.)
40. (A) ![]() but f (−1) = 2. The limit does not exist at a = 1 and f (2) does not exist.
but f (−1) = 2. The limit does not exist at a = 1 and f (2) does not exist.
41. (B) ![]()
42. (D) ![]() but since these two limits are not the same,
but since these two limits are not the same, ![]() does not exist.
does not exist.
Answers Explained
Many of the explanations provided include intermediate steps that would normally be reached on the way to a final algebraically simplified result. You may not need to reach the final answer.
NOTE: the formulas or rules cited in parentheses in the explanations are given.
1. (E) By the Product Rule, (5),
y ′ = x5 (tan x) ′ + (x5) ′ (tan x).
2. (A) By the Quotient Rule, (6),
![]()
3. (B) Since y = (3 − 2x)1/2, by the Power Rule, (3),
![]()
4. (B) Since y = 2(5x + 1)−3, y ′ = −6(5x + 1)−4 (5).
5. (E) ![]()
6. (D) Rewrite: ![]()
7. (A) Rewrite: y = (x2 + 2x − 1)1/2; then ![]() (x2 + 2x − 1)−1/2 (2x + 2).
(x2 + 2x − 1)−1/2 (2x + 2).
8. (D) Use the Quotient Rule:
![]()
9. (C) Since
10. (E) Use formula (18): 
11. (A) Use formulas (13), (11), and (9):
![]()
12. (D) By the Quotient Rule,
13. (D) Since ![]() ln (x2 + 1)
ln (x2 + 1)
![]()
14. (C) ![]()
15. (A) Since ![]() (−csc 2x cot 2x · 2).
(−csc 2x cot 2x · 2).
16. (A) y ′ = e−x (−2 sin 2x) + cos 2x(−e−x).
17. (C) y ′ = (2 sec x)(sec x tan x).
18. (E) ![]() The correct answer is 3 ln2 x + ln3 x.
The correct answer is 3 ln2 x + ln3 x.
19. (B) ![]()
20. (C) ![]()
21. (D) Let y ′ be ![]() then 3x2 − 3y2 y ′ = 0;
then 3x2 − 3y2 y ′ = 0; ![]()
22. (A) 1 − sin (x + y)(1 + y ′) = 0; ![]()
23. (D) cos x + sin y · y′ = 0; ![]()
24. (B) 6x − 2(xy ′ + y) + 10yy ′ = 0; y ′(10y − 2x) = 2y − 6x.
25. (A) ![]()
26. (E) f ′(x) = 4x3 − 12x2 + 8x = 4x(x − 1)(x − 2).
27. (E) f ′(x) = 8x−1/2; ![]()
28. (A) f (x) = 3 ln x; ![]() Replace x by 3.
Replace x by 3.
29. (D) 2x + 2yy ′ = 0; ![]()
30. (E) ![]() Replace t by 1.
Replace t by 1.
31. (D) ![]()
32. (D) y ′ = ex · 1 + ex (x − 1) = xex;
y ″ = xex + ex and y ″(0) = 0 · 1 + 1 = 1.
33. (E) When simplified, ![]()
34. (B) Since (if sin t ≠ 0)
![]() = −2 sin t = −4 sin t cos t and
= −2 sin t = −4 sin t cos t and ![]()
then ![]() Thus:
Thus:
![]()
BC ONLY
NOTE: Since each of the limits in Questions 35–39 yields an indeterminate form of the type ![]() we can apply L’Hôpital’s Rule in each case, getting identical answers.
we can apply L’Hôpital’s Rule in each case, getting identical answers.
35. (C) The given limit is the derivative of f (x) = x6 at x = 1.
36. (B) The given limit is the definition for f ′(8), where f (x) = ![]()
![]()
37. (B) The given limit is f ′(e), where f (x) = ln x.
38. (B) The given limit is the derivative of f (x) = cos x at x = 0; f ′(x) = − sin x.
39. (B) ![]() but f (1) = 4.
but f (1) = 4.
Thus f is discontinuous at x = 1, so it cannot be differentiable.
40. (E) ![]() so the limit exists. Because g(3) = 9, g is continuous at x = 3. Since
so the limit exists. Because g(3) = 9, g is continuous at x = 3. Since ![]()
41. (E) Since ![]() f ′(0) is not defined; f ′(x) must be defined on (−8,8).
f ′(0) is not defined; f ′(x) must be defined on (−8,8).
42. (A) Note that f (0) = ![]() = 0 and that f ′(x) exists on the given interval. By the MVT, there is a number, c, in the interval such that f ′(c) = 0. If c = 1, then 6c2 − 6 = 0. (−1 is not in the interval.)
= 0 and that f ′(x) exists on the given interval. By the MVT, there is a number, c, in the interval such that f ′(c) = 0. If c = 1, then 6c2 − 6 = 0. (−1 is not in the interval.)
43. (B) Since the inverse, h, of f (x) = ![]() is h(x) =
is h(x) = ![]() then h ′(x) =
then h ′(x) = ![]() Replace x by 3.
Replace x by 3.
44. (D) After 50(!) applications of L’Hôpital’s Rule we get ![]() which “equals” ∞. A perfunctory examination of the limit, however, shows immediately that the answer is ∞. In fact,
which “equals” ∞. A perfunctory examination of the limit, however, shows immediately that the answer is ∞. In fact, ![]() for any positive integer n, no matter how large, is ∞.
for any positive integer n, no matter how large, is ∞.
45. (C) cos(xy)(xy ′ + y) = 1; x cos(xy)y ′ = 1 − y cos(xy);
![]()
NOTE: In Questions 46–50 the limits are all indeterminate forms of the type ![]() We have therefore applied L’Hôpital’s Rule in each one. The indeterminacy can also be resolved by introducing
We have therefore applied L’Hôpital’s Rule in each one. The indeterminacy can also be resolved by introducing ![]() which approaches 1 as a approaches 0. The latter technique is presented in square brackets.
which approaches 1 as a approaches 0. The latter technique is presented in square brackets.
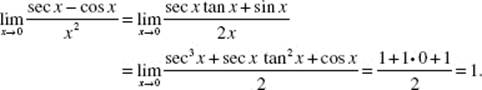
46. (B) ![]()
[Using sin 2x = 2 sin x cos x yields ![]() cos x = 2 · 1 · 1 = 2.]
cos x = 2 · 1 · 1 = 2.]
47. (C) ![]()
[We rewrite ![]() As x → 0, so do 3x and 4x; the fraction approaches 1 · 1 ·
As x → 0, so do 3x and 4x; the fraction approaches 1 · 1 · ![]() ]
]
48. (E) ![]()
[We can replace 1 − cos x by ![]() getting
getting
49. (D) ![]()
[![]() as x (or πx) approaches 0, the original fraction approaches π · 1 ·
as x (or πx) approaches 0, the original fraction approaches π · 1 · ![]() = π]
= π]
50. (C) The limit is easiest to obtain here if we rewrite:
![]()
51. (B) Since x − 3 = 2 sin t and y + 1 = 2 cos t,
(x − 3)2 + (y + 1)2 = 4.
This is the equation of a circle with center at (3,−1) and radius 2. In the domain given, −π ≤ t ≤ π, the entire circle is traced by a particle moving counterclockwise, starting from and returning to (3, −3).
52. (C) Use L’Hôpital’s Rule; then
53. (A) 
54. (D) 
55. (E) 
56. (C) Since 
57. (B) (f + 2g) ′ (3) = f ′(3) + 2g ′(3) = 4 + 2(−1)
58. (B) (f · g) ′ (2) = f (2) · g ′(2) + g(2) · f ′(2) = 5(−2) + 1(3)
59. (E) ![]()
60. (D) ![]()
61. (C) ![]()
62. (A) M ′(1) = f ′(g(1)) · g ′(1) = f ′(3)g ′(1) = 4(−3).
63. (B) [f (x3)] ′ = f ′(x3)·3x2, so P ′(1) = f ′(13)·3·12 = 2·3.
64. (D) f (S(x)) = x implies that f ′(S(x)) · S ′(x) = 1, so
![]()
65. (E) Since g ′(a) exists, g is differentiable and thus continuous; g ′(a) > 0.
66. (C) Near a vertical asymptote the slopes must approach ±∞.
67. (A) There is only one horizontal tangent.
68. (D) Use the symmetric difference quotient; then
![]()
69. (E) Since the water level rises more slowly as the cone fills, the rate of depth change is decreasing, as in (C) and (E). However, at every instant the portion of the cone containing water is similar to the entire cone; the volume is proportional to the cube of the depth of the water. The rate of change of depth (the derivative) is therefore not linear, as in (C).
70. (C) The only horizontal tangent is at x = 4. Note that f ′(1) does not exist.
71. (E) The graph has corners at x = 1 and x = 2; the tangent line is vertical at x = 6.
72. (B) Consider triangle ABC: AB = 1; radius AC = 2; thus, BC = ![]() and AC has m = −
and AC has m = −![]() The tangent line is perpendicular to the radius.
The tangent line is perpendicular to the radius.
73. (D) The graph of y = x + cos x is shown in window [−5,5] × [−6,6]. The average rate of change is represented by the slope of secant segment ![]() There appear to be 3 points at which tangent lines are parallel to
There appear to be 3 points at which tangent lines are parallel to ![]()
74. (C) ![]()
75. (A) Since an estimate of the answer for Question 74 is f ′(2) ≈ −5, then
![]()
76. (B) When x = 3 on g−1, y = 3 on the original half-parabola. 3 = x2 − 8x + 10 at x = 1 (and at x = 7, but that value is not in the given domain).
![]()
77. (E) f satisfies Rolle’s Theorem on [2,10].
78. (C) The diagrams show secant lines (whose slope is the difference quotient) with greater slopes than the tangent line. In both cases, f is concave upward.
79. (C) (f ο g) ′ at x = 3 equals f ′(g(3)) · g ′(3) equals cos u (at u = 0) times 2x (at x = 3) = 1 · 6 = 6.
80. (E) Here f ′(x) equals ![]()
81. (A) 
82. (A) 
83. (B) Note that f (g(x)) = ![]()
84. (B) Sketch the graph of f (x) = 1 − |x|; note that f (−1) = f (1) = 0 and that f is continuous on [−1,1]. Only (B) holds.
85. (C) Since f ′(x) = 6x2 − 3, therefore ![]() also, f (x), or 2x3 − 3x, equals −1, by observation, for x = 1. So h ′(−1) or
also, f (x), or 2x3 − 3x, equals −1, by observation, for x = 1. So h ′(−1) or ![]() (when x = 1) equals
(when x = 1) equals ![]()
86. (D) ![]()
87. (B) Since f (0) = 5, ![]()
88. (D) The given limit is the derivative of g(x) at x = 0.
89. (B) The tangent line appears to contain (3,−2.6) and (4,−1.8).
90. (D) f ′(x) is least at the point of inflection of the curve, at about 0.7.
91. (C) ![]()
92. (B) By calculator, f ′(0) = 1.386294805 and ![]()
93. (E) Now ![]()
94. (B) Note that any line determined by two points equidistant from the origin will necessarily be horizontal.
95. (D) Note that ![]() f (h(x)) = f ′(h(x)) · h ′(x) = g(h(x)) · h ′(x) = g(sin x) · cos x.
f (h(x)) = f ′(h(x)) · h ′(x) = g(h(x)) · h ′(x) = g(sin x) · cos x.
96. (E) Since f (x) = 3x − x3, then f ′(x) = 3x ln 3 − 3x2. Furthermore, f is continuous on [0,3] and f ′ is differentiable on (0,3), so the MVT applies. We therefore seek c such that ![]() Solving 3x ln 3 − 3x2 =
Solving 3x ln 3 − 3x2 = ![]() with a calculator, we find that c may be either 1.244 or 2.727. These values are the x-coordinates of points on the graph of f (x) at which the tangents are parallel to the secant through points (0,1) and (3,0) on the curve.
with a calculator, we find that c may be either 1.244 or 2.727. These values are the x-coordinates of points on the graph of f (x) at which the tangents are parallel to the secant through points (0,1) and (3,0) on the curve.
97. (A) The line segment passes through (1,−3) and (2,−4).
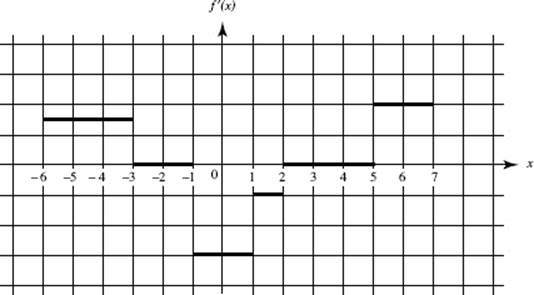
Use the graph of f ′(x), shown above, for Questions 98–101.
98. (E) f ′(x) = 0 when the slope of f (x) is 0; that is, when the graph of f is a horizontal segment.
99. (E) The graph of f ′(x) jumps at each corner of the graph of f (x), namely, at x equal to −3, −1, 1,2, and 5.
100. (D) On the interval (−6,−3), f (x) = ![]()
101. (B) Verify that all choices but (B) are true. The graph of f ′(x) has five (not four) jump discontinuities.
102. (C) The best approximation to f ′(0.10) is ![]()
103. (D)
The average rate of change is represented by the slope of secant segment ![]() There appear to be 3 points at which the tangent lines are parallel to
There appear to be 3 points at which the tangent lines are parallel to ![]()
Answers Explained
1. (D) Substituting y = 2 yields x = 1. We find y ′ implicitly.
3 y2 y ′ − (2 xyy ′ + y2) = 0; (3 y2 − 2xy)y ′ − y2 = 0.
Replace x by 1 and y by 2; solve for y ′.
2. (A) 2yy ′ − (xy ′ + y) − 3 = 0. Replace x by 0 and y by −1; solve for y ′.
3. (E) Find the slope of the curve at ![]()
![]() The equation is
The equation is ![]()
4. (B) Since y ′ = e−x (1 − x) and e−x > 0 for all x, y ′ = 0 when x = 1.
5. (D) The slope y ′ = 5x4 + 3x2 − 2. Let g = y ′. Since g ′(x) = 20x3 + 6x = 2x(10x2 + 3), g ′(x) = 0 only if x = 0. Since g ″ (x) = 60x2 + 6, g ″ is always positive, assuring that x = 0 yields the minimum slope. Find y ′ when x = 0.
6. (C) Since 2x − 2yy ′ = 0, ![]() At (4, 2), y ′ = 2. The equation of the tangent at (4, 2) is y − 2 = 2(x − 4).
At (4, 2), y ′ = 2. The equation of the tangent at (4, 2) is y − 2 = 2(x − 4).
7. (D) Since ![]() the tangent is vertical for x = 2y. Substitute in the given equation and solve for y.
the tangent is vertical for x = 2y. Substitute in the given equation and solve for y.
8. (D) Since ![]() therefore, dV = 4πr2 dr. The approximate increase in volume is dV ≈ 4π(32)(0.1) in3.
therefore, dV = 4πr2 dr. The approximate increase in volume is dV ≈ 4π(32)(0.1) in3.
9. (C) Differentiating implicitly yields 4x − 3y2 y ′ = 0. So ![]() The linear approximation for the true value of y when x changes from 3 to 3.04 is
The linear approximation for the true value of y when x changes from 3 to 3.04 is
![]()
Since it is given that, when x = 3, y = 2, the approximate value of y is
![]()
or
![]()
10. (B) We want to approximate the change in area of the square when a side of length e increases by 0.01e. The answer is
A ′(e)(0.01e) or 2e (0.01e).
11. (D) Since V = e3, V ′ = 3e2. Therefore at e = 10, the slope of the tangent line is 300. The change in volume is approximately 300(±0.1) = 30 in.3
12. (E) f ′(x) = 4x3 − 8x = 4x(x2 − 2). f ′ = 0 if x = 0 or ![]()
f ″(x) = 12x2 − 8; f ″ is positive if x = ![]() negative if x = 0.
negative if x = 0.
13. (C) Since f ″(x) = 4(3x2 − 2), it equals 0 if ![]() Since f ″ changes sign from positive to negative at
Since f ″ changes sign from positive to negative at ![]() and from negative to positive at
and from negative to positive at ![]() both locate inflection points.
both locate inflection points.
14. (A) The domain of y is {x | x ![]() 2}. Note that y is negative for each x in the domain except 2, where y = 0.
2}. Note that y is negative for each x in the domain except 2, where y = 0.
15. (B) f ′(x) changes sign (from negative to positive) as x passes through zero only.
16. (E) The graph must be decreasing and concave downward.
17. (B) The graph must be concave upward but decreasing.
18. (B) The distance is increasing when v is positive. Since ![]() = 3(t − 2)2, v > 0 for all t ≠ 2.
= 3(t − 2)2, v > 0 for all t ≠ 2.
19. (D) The speed = |v|. From Question 18, |v| = v. The least value of v is 0.
20. (A) The acceleration ![]() From Question 18, a = 6(t − 2).
From Question 18, a = 6(t − 2).
21. (E) The speed is decreasing when v and a have opposite signs. The answer is t < 2, since for all such t the velocity is positive while the acceleration is negative. For t > 2, both v and a are positive.
22. (B) The particle is at rest when v = 0; v = 2t(2t2 − 9t + 12) = 0 only if t = 0. Note that the discriminant of the quadratic factor (b2 − 4ac) is negative.
23. (D) Since a = 12(t − 1)(t − 2), we check the signs of a in the intervals t < 1, 1 < t < 2, and t > 2. We choose those where a > 0.
24. (A) From Questions 22 and 23 we see that v > 0 if t > 0 and that a > 0 if t < 1 or t > 2. So both v and a are positive if 0 < t < 1 or t > 2. There are no values of t for which both v and a are negative.
25. (D) See the figure, which shows the motion of the particle during the time interval −2 ≤ t ≤ 4. The particle is at rest when t = 0 or 3, but reverses direction only at 3. The endpoints need to be checked here, of course. Indeed, the maximum displacement occurs at one of those, namely, when t = −2.
26. (C) Since v = 5t3 (t + 4), v = 0 when t = −4 or 0. Note that v does change sign at each of these times.
27. (E) Since ![]()
28. (A) Note that 
29. (B) 
30. (D) The slope of the curve is the slope of v, namely, ![]() At
At ![]() the slope is equal to
the slope is equal to
31. (C) Since ![]()
32. (B) See Figure N4–22. Replace the printed measurements of the radius and height by 10 and 20, respectively. We are given here that ![]() and that
and that ![]()
![]()
Replace h by 8.
33. (D) ![]() Since y ′ = 0 if x = 1 and changes from negative to positive as x increases through 1, x = 1 yields a minimum. Evaluate y at x = 1.
Since y ′ = 0 if x = 1 and changes from negative to positive as x increases through 1, x = 1 yields a minimum. Evaluate y at x = 1.
34. (A) The domain of y is −∞ < x < ∞. The graph of y, which is nonnegative, is symmetric to the y-axis. The inscribed rectangle has area A = 2xe−x2. Thus ![]() which is 0 when the positive value of x is
which is 0 when the positive value of x is ![]() This value of x yields maximum area. Evaluate A.
This value of x yields maximum area. Evaluate A.
35. (B) See the figure. If we let m be the slope of the line, then its equation is y − 2 = m(x − 1) with intercepts as indicated in the figure.
The area A of the triangle is given by
![]()
Then ![]() and equals 0 when m = ±2; m must be negative.
and equals 0 when m = ±2; m must be negative.
36. (C) Let q = (x − 6)2 + y2 be the quantity to be minimized. Then
q = (x − 6)2 + (x2 − 4);
q ′ = 0 when x = 3. Note that it suffices to minimize the square of the distance.
37. (E) Minimize, if possible, xy, where x2 + y2 = 200 (x, y > 0). The derivative of the product is ![]() which equals 0 for x = 10. The derivative is positive to the left of that point and negative to the right, showing that x = 10 yields a maximum product. No minimum exists.
which equals 0 for x = 10. The derivative is positive to the left of that point and negative to the right, showing that x = 10 yields a maximum product. No minimum exists.
38. (C) Minimize ![]() Since
Since
![]()
q ′ = 0 if x = 3. Since q ′ is negative to the left of x = 3 and positive to the right, the minimum value of q occurs at x = 3.
39. (A) The best approximation for ![]() when h is small is the local linear (or tangent line) approximation. If we let
when h is small is the local linear (or tangent line) approximation. If we let ![]() then
then ![]() and
and ![]() The approximation for f (h) is f (0) + f ′(0) · h, which equals
The approximation for f (h) is f (0) + f ′(0) · h, which equals ![]()
40. (A) Since f ′(x) = e−x (1 − x), f ′(0) > 0.
41. (E) The graph shown serves as a counterexample for A−D.
42. (D) Since V = 10![]() w,
w, ![]() = 10(8 · −4 + 6 · 2).
= 10(8 · −4 + 6 · 2).
43. (E) We differentiate implicitly: 3x2 + x2 y ′ + 2xy + 4y ′ = 0. Then ![]() At (3, −2),
At (3, −2), ![]()
44. (D) Since ab > 0, a and b have the same sign; therefore f ″(x) = 12ax2 + 2b never equals 0. The curve has one horizontal tangent at x = 0.
45. (C) Since the first derivative is positive, the function must be increasing. However, the negative second derivative indicates that the rate of increase is slowing down, as seen in table C.
46. (B) Since ![]() therefore, at t = 1,
therefore, at t = 1, ![]() Also, x = 3 and y = 2.
Also, x = 3 and y = 2.
47. (A) Let f (x) = x1/3, and find the slope of the tangent line at (64, 4). Since ![]() If we move one unit to the left of 64, the tangent line will drop approximately
If we move one unit to the left of 64, the tangent line will drop approximately ![]() unit.
unit.
48. (D) ![]()
49. (E) ekh ![]() ek·0 + kek·0 (h − 0) = 1 + kh
ek·0 + kek·0 (h − 0) = 1 + kh
50. (E) Since the curve has a positive y-intercept, e > 0. Note that f ′(x) = 2cx + d and f ″(x) = 2c. Since the curve is concave down, f ″(x) < 0, implying that c < 0. Since the curve is decreasing at x = 0, f ′(0) must be negative, implying, since f ′(0) = d, that d < 0. Therefore c < 0, d < 0, and e> 0.
51. (A) Since the slope of the tangent to the curve is ![]() the slope of the normal is
the slope of the normal is ![]()
52. (E) The slope ![]() at the given point
at the given point ![]() and y = 1. The equation is therefore
and y = 1. The equation is therefore
y − 1 = −1(x + 2) or x + y + 1 = 0.
53. (C) ![]()
54. (E) Since f ′ < 0 on 5 ≤ x < 7, the function decreases as it approaches the right endpoint.
55. (B) For x < 5, f ′ > 0, so f is increasing; for x > 5, f is decreasing.
56. (D) The graph of f being concave downward implies that f ″ < 0, which implies that f ′ is decreasing.
57. (D) Speed is the magnitude of velocity; at t = 3, speed = 10 ft/sec.
58. (D) Speed increases from 0 at t = 2 to 10 at t = 3; it is constant or decreasing elsewhere.
59. (E) Acceleration is positive when the velocity increases.
60. (D) Acceleration is undefined when velocity is not differentiable. Here that occurs at t = 1, 2, 3.
61. (A) Acceleration is the derivative of velocity. Since the velocity is linear, its derivative is its slope.
62. (C) Positive velocity implies motion to the right (t < 2); negative velocity (t > 2) implies motion to the left.
63. (B) The average rate of change of velocity is ![]()
64. (E) The slope of y = x3 is 3x2. It is equal to 3 when x = ±1. At x = 1, the equation of the tangent is
y − 1 = 3(x − 1) or y = 3x + 2.
At x = −1, the equation is
y + 1 = 3(x + 1) or y = 3x + 2.
65. (C) Let the tangent to the parabola from (3, 5) meet the curve at (x1, y1). Its equation is y − 5 = 2x1 (x − 3). Since the point (x1, y1) is on both the tangent and the parabola, we solve simultaneously:
y1 − 5 = 2x1 (x1 − 3) and ![]()
The points of tangency are (5, 25) and (1, 1). The slopes, which equal 2x1, are 10 and 2.
66. (E) ![]()
67. (D) The graph of f ′(x) = x sin x − cos x is drawn here in the window [0,4] × [−3,3]:
A local maximum exists at x = 0, where f ′ changes from positive to negative; use your calculator to approximate a.
68. (C) f ″ changes sign when f ′ changes from increasing to decreasing (or vice versa). Again, use your calculator to approximate the x-coordinate at b.
69. (E) Eliminating t yields the equation ![]()
70. (B) ![]()
71. (A) Since ![]() We note that, as t increases through 2, the sign of |v| ′ changes from negative to positive, assuring a minimum of |v| at t = 2. Evaluate |v| at t = 2.
We note that, as t increases through 2, the sign of |v| ′ changes from negative to positive, assuring a minimum of |v| at t = 2. Evaluate |v| at t = 2.
72. (C) The direction of a is  the acceleration is always directed downward. Its magnitude,
 ![]() is 2 for all t.
is 2 for all t.
73. (D) Using the notations vx, vy, ax, and ay, we are given that ![]() where k is a constant. Then
where k is a constant. Then
![]()
74. (E) ![]()
75. (B) The rate of change of the distance from the origin with respect to time is given by ![]()
76. (B) In parametric form, x = r cos ![]() = 6 cos 2
= 6 cos 2![]() cos
cos ![]() ; hence:
; hence:
![]()
77. (B) A local minimum exists where f changes from decreasing (f ′ < 0) to increasing (f ′ > 0). Note that f has local maxima at both endpoints, x = 0 and x = 5.
78. (D) See Answer 68.
79. (D) At x = a, f ′ changes from increasing (f ″ > 0) to decreasing (f ″ < 0). Thus f changes from concave upward to concave downward, and therefore has a point of inflection at x = a. Note that f is differentiable at a (because f ′(a) exists) and therefore continuous at a.
80. (C) We know that ![]()
![]()
81. (E) The equation of the tangent is y = −2x + 5. Its intercepts are ![]() and 5.
and 5.
82. (D) See the figure. At noon, car A is at O, car B at N; the cars are shown t hours after noon. We know that ![]() Using s2 = x2 + y2, we get
Using s2 = x2 + y2, we get
At 1 P.M., x = 30, y = 40, and s = 50.
83. (B) ![]() (from Question 82) is zero when
(from Question 82) is zero when ![]() Note that x = 90 − 60t and y = 40t.
Note that x = 90 − 60t and y = 40t.
84. (B) Maximum acceleration occurs when the derivative (slope) of velocity is greatest.
85. (B) The object changes direction only when velocity changes sign. Velocity changes sign from negative to positive at t = 5.
86. (D) From the graph, f ′(2) = 3, and we are told the line passes through (2,10). We therefore have f (x) ![]() 10 + 3(x − 2) = 3x + 4.
10 + 3(x − 2) = 3x + 4.
87. (C) At x = 1 and 3, f ′(x) = 0; therefore f has horizontal tangents.
For x < 1, f ′ > 0; therefore f is increasing.
For x > 1, f ′ < 0, so f is decreasing.
For x < 2, f ′ is decreasing, so f ″ < 0 and the graph of f is concave downward.
For x > 2, f ′ is increasing, so f ″ > 0 and the graph of f is concave upward.
88. (C) Note that ![]() at Q, R, and T. At Q,
at Q, R, and T. At Q, ![]() at T,
at T, ![]()
89. (D) Only at S does the graph both rise and change concavity.
90. (E) Only at T is the tangent horizontal and the curve concave down.
91. (C) Since f ′(6) = 4, the equation of the tangent at (6, 30) is y − 30 = 4(x − 6). Therefore f (x) ![]() 4x + 6 and f (6.02)
4x + 6 and f (6.02) ![]() 30.08.
30.08.
92. (C) ![]()
Answers Explained
All the references in parentheses below are to the basic integration formulas. In general, if u is a function of x, then du = u ′(x) dx.
1. (C) Use, first, formula (2), then (3), replacing u by x.
2. (E) Hint: Expand. ![]()
3. (A) By formula (3), with u = 4 − 2t and ![]()
4. (D) Rewrite: ![]()
5. (E) Rewrite:
![]()
Use (3).
6. (B) Rewrite:
![]()
Using (3) yields ![]()
7. (A) This is equivalent to ![]() Use (4).
Use (4).
8. (E) Rewrite as ![]() Use (3).
Use (3).
9. (D) Use (5) with u = 3x; du = 3 dx: ![]()
10. (A) Use (4). If u = 1 + 4x2, du = 8x dx: ![]()
11. (D) Use (18). Let u = 2x; then du = 2 dx: ![]()
12. (C) Rewrite as ![]() Use (3) with n = −2.
Use (3) with n = −2.
13. (B) Rewrite as ![]() Use (3) with
Use (3) with ![]()
Note carefully the differences in the integrands in Questions 10–13.
14. (C) Use (17); rewrite as 
15. (B) Rewrite as ![]() Use (3).
Use (3).
Compare the integrands in Questions 14 and 15, noting the difference.
16. (A) Divide to obtain ![]() Use (2), (3), and (4). Remember that
Use (2), (3), and (4). Remember that ![]() whenever k ≠ 0.
whenever k ≠ 0.
17. (E) ![]()
(Note the Binomial Theorem with n = 3 to expand (x − 2)3.)
18. (D) The integral is equivalent to ![]() Integrate term by term.
Integrate term by term.
19. (A) Integrate term by term.
20. (D) Division yields
![]()
21. (E) Use formula (4) with u = 1 − ![]() = 1 − y1/2. Then
= 1 − y1/2. Then ![]() Note that the integral can be written as
Note that the integral can be written as ![]()
22. (E) Rewrite as ![]() and use formula (3).
and use formula (3).
23. (B) The integral is equal to ![]() Use formula (6) with u = 2θ; du = 2 dθ.
Use formula (6) with u = 2θ; du = 2 dθ.
24. (C) Use formula (6) with ![]()
25. (A) Use formula (5) with u = 4t2; du = 8t dt; ![]()
26. (A) Using the Half-Angle Formula (23) with α = 2x yields ![]()
27. (E) Use formula (6): ![]()
28. (B) Integrate by parts. Let u = x and dv = cos x dx. Then du = dx and v = sin x. The given integral equals ![]()
29. (D) Replace ![]() by sec2 3u; then use formula (9):
by sec2 3u; then use formula (9): ![]()
30. (C) Rewrite using u = 1 + sin x and du = cos x dx as ![]()
Use formula (3).
31. (B) The integral is equivalent to ![]() Use formula (12).
Use formula (12).
32. (E) Use formula (13) with ![]()
33. (A) Replace sin 2x by 2 sin x cos x; then the integral is equivalent to
![]()
where u = 1 + cos2 x and du = −2 sin x cos x dx. Use formula (3).
34. (D) Rewriting in terms of sines and cosines yields
![]()
35. (E) Use formula (7).
36. (C) Replace ![]() by csc2 2x and use formula (10):
by csc2 2x and use formula (10): ![]()
37. (E) Let u = tan−1 y; then integrate ![]() The correct answer is
The correct answer is ![]()
38. (A) Replacing sin 2θ by 2 sin θ cos θ yields
![]()
39. (C) ![]()
40. (B) Rewrite as ![]() and use formula (8).
and use formula (8).
41. (E) Use formula (4) with u = ex − 1; du = ex dx.
42. (D) Use partial fractions; find A and B such that
![]()
Then x − 1 = A(x − 2) + Bx.
Set x = 0: −1 = −2A and ![]()
Set x = 2: 1 = 2B and ![]()
So the given integral equals
43. (A) Use formula (15) with u = x2; du = 2x dx; ![]()
44. (B) Use formula (15) with u = sin θ; du = cos θ dθ.
45. (C) Use formula (6) with u = e2θ; du = 2e2θ dθ: ![]()
46. (B) Use formula (15) with ![]()
47. (C) Use the Parts Formula. Let u = x, dv = e−x dx; du = dx, v = −e−x. Then,
![]()
48. (C) See Example 44.
49. (D) The integral is of the form ![]()
50. (A) The integral has the form ![]() Use formula (18), with u = ex, du = ex dx.
Use formula (18), with u = ex, du = ex dx.
51. (C) Let u = ln v; then ![]() Use formula (3) for
Use formula (3) for ![]()
52. (E) Hint: ln ![]() ln x; the integral is
ln x; the integral is ![]()
53. (B) Use parts, letting u = ln x and dv = x3 dx. Then ![]() and
and ![]() The integral equals
The integral equals ![]()
54. (B) Use parts, letting u = ln ![]() and dv = dx. Then
and dv = dx. Then ![]() and v =
and v = ![]() . The integral equals
. The integral equals ![]() ln
ln ![]()
55. (B) Rewrite ln x3 as 3 ln x, and use the method of Answer 54.
56. (D) Use parts, letting u = ln y and dv = y−2 dy. Then ![]() and
and ![]() The Parts Formula yields
The Parts Formula yields ![]()
57. (E) The integral has the form ![]() where
where 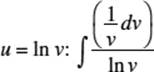
58. (A) By long division, the integrand is equivalent to ![]()
59. (C) ![]() use formula (18) with u = x + 1.
use formula (18) with u = x + 1.
60. (D) Multiply to get ![]()
61. (C) See Example 45. Replace x by θ.
62. (E) The integral equals ![]() it is equivalent to
it is equivalent to ![]() where u = 1 − ln t.
where u = 1 − ln t.
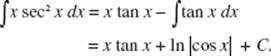
63. (A) Replace u by x in the given integral to avoid confusion in applying the Parts Formula. To integrate ![]() let the variable u in the Parts Formula be x, and let dv be sec2 x dx. Then du = dx and v = tan x, so
let the variable u in the Parts Formula be x, and let dv be sec2 x dx. Then du = dx and v = tan x, so
64. (D) The integral is equivalent to ![]() Use formula (4) on the first integral and (18) on the second.
Use formula (4) on the first integral and (18) on the second.
65. (D) The integral is equivalent to ![]() Use formula (17) on the first integral. Rewrite the second integral as
Use formula (17) on the first integral. Rewrite the second integral as ![]() and use (3).
and use (3).
66. (E) Rewrite: ![]()
67. (B) Hint: Divide, getting ![]()
68. (D) Letting u = sin θ yields the integral ![]() Use formula (18).
Use formula (18).
69. (E) Use integration by parts, letting u = arctan x and dv = dx. Then
![]()
The Parts Formula yields
![]()
70. (B) Hint: Note that
![]()
Or multiply the integrand by ![]() recognizing that the correct answer is equivalent to −ln|e−x − 1|.
recognizing that the correct answer is equivalent to −ln|e−x − 1|.
71. (D) Hint: Expand the numerator and divide. Then integrate term by term.
72. (C) Hint: Observe that e2 ln u = u2.
73. (A) Let u = 1 + ln y2 = 1 + 2 ln |y|; integrate 
74. (B) Hint: Expand and note that
![]()
Use formulas (9) and (7).
75. (E) Multiply by ![]() The correct answer is tan θ − sec θ + C.
The correct answer is tan θ − sec θ + C.
76. (D) Note the initial conditions: when t = 0, v = 0 and s = 0. Integrate twice: v = 6t2 and s = 2t3. Let t = 3.
77. (D) Since y ′ = x2 − 2, ![]() Replacing x by 1 and y by −3 yields
Replacing x by 1 and y by −3 yields ![]()
78. (D) When t = 0, v = 3 and s = 2, so
v = 2t + 3t2 + 3 and s = t2 + t3 + 3t + 2.
Let t = 1.
79. (C) Let ![]() then
then
v = at + C. (*)
Since v = 75 when t = 0, therefore C = 75. Then (*) becomes
v = at + 75
so
0 = at + 75 and a = −15.
80. (A) Divide to obtain ![]() Use partial fractions to get
Use partial fractions to get
![]()
Answers Explained
1. (C) The integral is equal to
![]()
2. (B) Rewrite as ![]() This equals
This equals
![]()
3. (E) Rewrite as
![]()
4. (B) This integral equals
5. (D) ![]()
6. (A) Rewrite as
![]()
7. (D) ![]()
8. (A) 
9. (C) 
10. (D) You get ![]() = −(e−1 − 1).
= −(e−1 − 1).
11. (B) ![]()
12. (B) Evaluate ![]() which equals
which equals ![]() (0 − 1).
(0 − 1).
13. (E) ![]()
14. (C) If x = 2 sin θ, ![]() = 2 cos θ, dx = 2 cos θ dθ. When x = 1,
= 2 cos θ, dx = 2 cos θ dθ. When x = 1, ![]()
when x = 2, ![]() The integral is equivalent to
The integral is equivalent to ![]()
15. (D) Evaluate ![]() This equals
This equals ![]()
16. (A) ![]()
17. (C) Use the Parts Formula with u = x and dv = ex dx. Then du = dx and v = ex.
The result is ![]()
18. (E) ![]()
19. (A) 
20. (E) ![]()
21. (C) 
22. (A) ![]()
23. (E) Evaluate ln ![]() getting ln (e + 1) − ln 2.
getting ln (e + 1) − ln 2.
24. (C) Note that dx = sec2 θ dθ and that ![]() Be sure to express the limits as values of θ: 1 = tan θ yields
Be sure to express the limits as values of θ: 1 = tan θ yields ![]()
25. (B) If ![]() then u2 = x + 1, and 2u du = dx. When you substitute for the limits, you get
then u2 = x + 1, and 2u du = dx. When you substitute for the limits, you get ![]() Since u ≠ 0 on its interval of integration, you may divide numerator and denominator by it.
Since u ≠ 0 on its interval of integration, you may divide numerator and denominator by it.
26. (D) ![]() f ′(x) dx = f (0) − f (8) = 11 − 7 = 4
f ′(x) dx = f (0) − f (8) = 11 − 7 = 4
27. (D) On [0,6] with n = 3, Δx = 2. Heights of rectangles at x = 1, 3, and 5 are 5, 9, and 5, respectively; M(3) = (5 + 9 + 5)(2).
28. (D) 
29. (E) For L(2) use the circumscribed rectangles: ![]()
for R(2) use the inscribed rectangles: ![]()
30. (D) On [0, 1] f (x) = cos x is decreasing, so R < L. Furthermore, f is concave downward, so T < A.
31. (D) On the interval [−1,3] the area under the graph of y = |x| is the sum of the areas of two triangles: ![]()
32. (E) Note that the graph y = |x + 1| is the graph of y = |x| translated one unit to the left. The area under the graph y = |x + 1| on the interval [−3,2] is the sum of the areas of two triangles: ![]()
33. (C) Because ![]() is a semicircle of radius 8, its area is 32π. The domain is [−8,8], or 16 units wide. Hence the average height of the function is
is a semicircle of radius 8, its area is 32π. The domain is [−8,8], or 16 units wide. Hence the average height of the function is ![]()
34. (C) The average value is equal to ![]()
35. (C) The average value is equal to ![]()
36. (E) The average value is ![]() The integral represents the area of a trapezoid:
The integral represents the area of a trapezoid: ![]() (5 + 3) · 10 = 40. The average value is
(5 + 3) · 10 = 40. The average value is ![]() (40).
(40).
37. (B) Since x2 + y2 = 16 is a circle, the given integral equals the area of a semicircle of radius 4.
38. (B) Use a graphing calculator.
39. (D) A vertical line at x = 2 divides the area under f into a trapezoid and a triangle; hence, ![]() Thus, the average value of f on [0,6] is
Thus, the average value of f on [0,6] is ![]() There are points on f with y-values of
There are points on f with y-values of ![]() in the intervals [0,2] and [2,4],
in the intervals [0,2] and [2,4],
40. (B) ![]()
41. (D) g ′(x) = f (2x) · 2; thus g ′(1) = f (2) · 2
42. (C) ![]() (Why 14? See the solution for question 39.)
(Why 14? See the solution for question 39.)
43. (C) This is the Mean Value Theorem for Integrals.
44. (D) This is theorem (2). Prove by counterexamples that (A), (B), (C), and (D) are false.
45. (A) This is a restatement of the Fundamental Theorem. In theorem (1), interchange t and x.
46. (D) Apply theorem (1), noting that
![]()
47. (E) Let ![]() and u = x2; then
and u = x2; then
![]()
By the Chain Rule, ![]() where theorem (1) is used to find
where theorem (1) is used to find ![]() Replace u by x2.
Replace u by x2.
48. (E) Since dx = −4 sin θ dθ, you get the new integral ![]() Use theorem (4) to get the correct answer.
Use theorem (4) to get the correct answer.
49. (C) Since dx = 2a sec2 θ dθ, you get 8πa3 ![]() Use the fact that cos2 θ sec2
Use the fact that cos2 θ sec2 ![]() = 1.
= 1.
50. (D) Use the facts that dx = sin t dt, that t = 0 when x = 0, and that ![]() when
when ![]()
51. (E) The expression for L(5) does not multiply the heights of the rectangles by Δx = 0.2
52. (D) The average value is ![]()
53. (B) 
Answers Explained
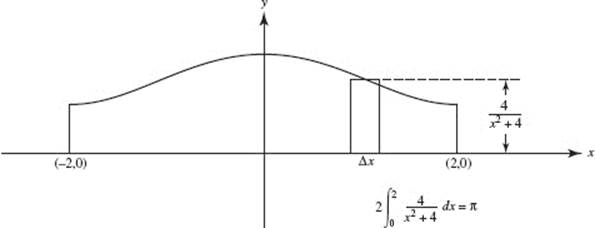
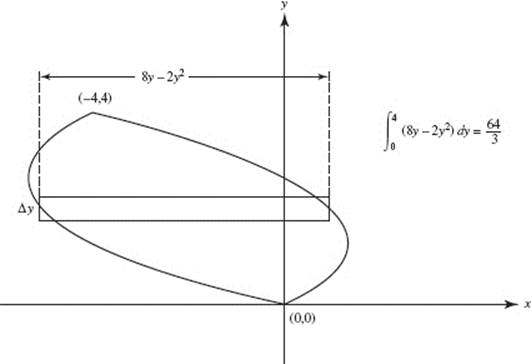
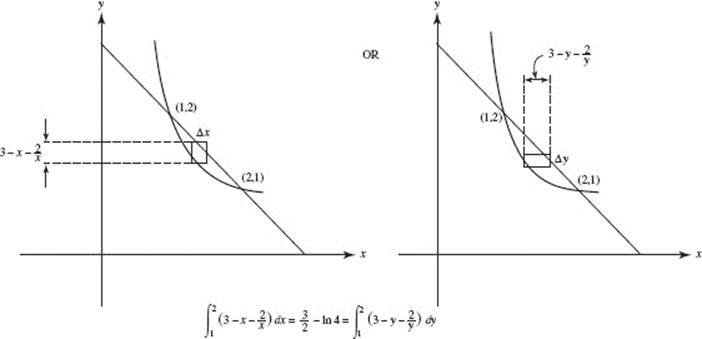
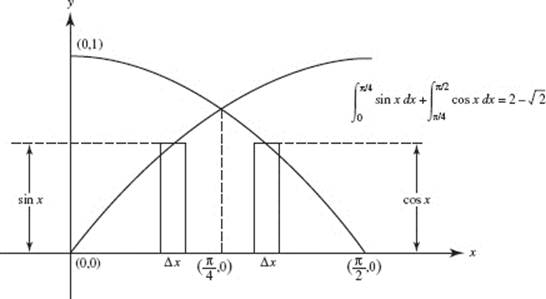
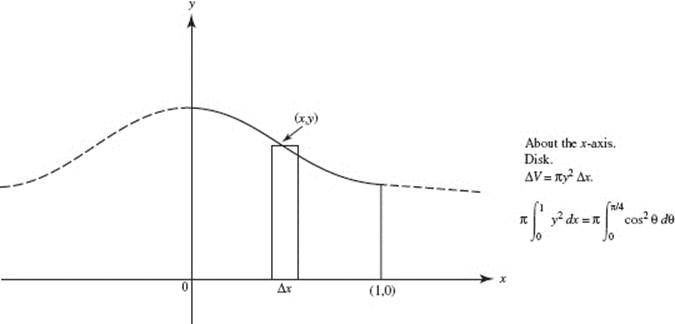
AREA
We give below, for each of Questions 1–17, a sketch of the region, and indicate a typical element of area. The area of the region is given by the definite integral. We exploit symmetry wherever possible.
1. (C)
2. (C)
3. (A)
4. (D)
5. (D)
6. (C)
7. (E)
8. (A)
9. (A)
10. (D)
11. (D)
12. (C)
13. (D)
14. (A)
15. (B)
16. (B)
17. (C)
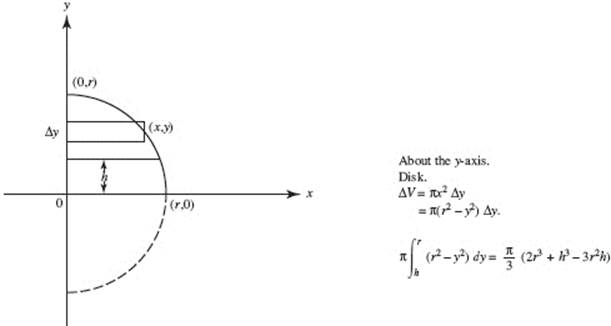
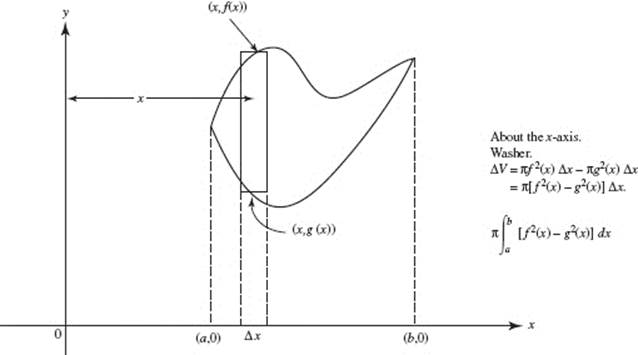
VOLUME
A sketch is given below, for each of Questions 18–27, in addition to the definite integral for each volume.
18. (E)
19. (D)
20. (A)
21. (C)
22. (D)
23. (B)
24. (A)
25. (D)
26. (B)
27. (E)
ARC LENGTH
28. (C) Note that the curve is symmetric to the x-axis. The arc length equals ![]()
29. (A) Integrate ![]() Replace the integrand by sec x, and use formula (13) to get
Replace the integrand by sec x, and use formula (13) to get ![]()
IMPROPER INTEGRALS
30. (A) The integral equals ![]()
31. (E) ![]() So the integral diverges to infinity.
So the integral diverges to infinity.
32. (B) Redefine as ![]()
33. (A) Rewrite as ![]() Each integral converges to 3.
Each integral converges to 3.
34. (E) ![]() Neither of the latter integrals converges; therefore the original integral diverges.
Neither of the latter integrals converges; therefore the original integral diverges.
35. (C) Evaluate ![]()
36. (A)
37. (C)
38. (E)
39. (B)
40. (D)
41. (B)
42. (A)
AREA
43. (C)
44. (D)
45. (E) T(4) = ![]() (1.62 + 2(4.15) + 2(7.5) + 2(9.0) + 12.13).
(1.62 + 2(4.15) + 2(7.5) + 2(9.0) + 12.13).
46. (B) ![]() 2θ dθ = 1.571, using a graphing calculator.
2θ dθ = 1.571, using a graphing calculator.
47. (C) The small loop is generated as θ varies from ![]() (C) uses the loop’s symmetry.
(C) uses the loop’s symmetry.
VOLUME
48. (D)
49. (B)
50. (C)
51. (B)
52. (C)
53. (A)
54. (D)
ARC LENGTH
55. (D) From (3), we obtain the length:
![]()
56. (D) Note that the curve is symmetric to the x-axis. Use (2).
57. (B) Use (3) to get the integral:
![]()
IMPROPER INTEGRALS
58. (C) The integrand is discontinuous at x = 1, which is on the interval of integration.
59. (D) The integral in (D) is the sum of two integrals from −1 to 0 and from 0 to 1. (see Example 29). Both diverge. Note that (A), (B), and (C) all converge.
60. (E) Choices (A), (C), and (D) can be shown convergent by the Comparison Test; the convergence of (B) is shown in Example 24.
Answers Explained
1. (D) Velocity ![]() and changes sign both when t = 1 and when t = 3.
and changes sign both when t = 1 and when t = 3.
2. (A) Since v > 0 for 0 ![]() t
t ![]() 2, the distance is equal to
2, the distance is equal to ![]()
3. (E) The answer is 8. Since the particle reverses direction when t = 2, and v > 0 for t > 2 but v < 0 for t < 2, therefore, the total distance is
![]()
4. (E) ![]() so there is no change in position.
so there is no change in position.
5. (B) Since v = sin t is positive on 0 < t ![]() 2, the distance covered is
2, the distance covered is
![]() sin t dt = 1 − cos 2.
sin t dt = 1 − cos 2.
6. (D) ![]() .
.
7. (D) The velocity v of the car is linear since its acceleration is constant:
![]()
8. (D) ![]() Since R(0) = 〈0,1〉,
Since R(0) = 〈0,1〉,
c1 = 0 and c2 = 1.
9. (A) a = v′(t) = 〈1,1〉 for all t.
10. (B) ![]()
11. (B) Since R = 〈x, y〉, its slope is ![]() since
since ![]() its slope is
its slope is ![]()
If R is perpendicular to v, then ![]() so
so
![]() and x2 + y2 = k (k > 0).
and x2 + y2 = k (k > 0).
Since (4, 3) is on the curve, the equation must be
x2 + y2 = 25.
12. (D) ![]() since
since ![]() and e° + c2 = 0; hence c1 = 2 and c2 = −1.
and e° + c2 = 0; hence c1 = 2 and c2 = −1.
13. (B) The object’s position is given by ![]() Since the object was at the origin at
Since the object was at the origin at ![]() and 4 · 1 + c2 = 0, making the position
and 4 · 1 + c2 = 0, making the position ![]() When t = 0, x(0) = −2, y(0) = −4.
When t = 0, x(0) = −2, y(0) = −4.
14. (D) ![]()
15. (B) We want the accumulated number of people to be 100:
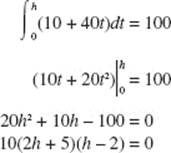
This occurs at h = 2 hours after 8 A.M.
16. (C) ![]()
17. (A) ![]()
18. (A) The number of new people who hear the rumor during the second week is
![]()
Be careful with the units! The answer is the total change, of course, in F(t) from t = 7 to t = 14 days, where F ′(t) = t2 + 10t.
19. (B) Total gallons = ![]()
20. (A) Be careful! The number of cars is to be measured over a distance of x (not 20) mi. The answer to the question is a function, not a number. Note that choice (C) gives the total number of cars on the entire 20-mi stretch.
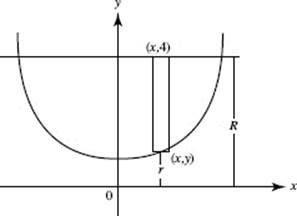
21. (C) Since the strip of the city shown in the figure is at a distance r mi from the highway, it is ![]() mi long and its area is
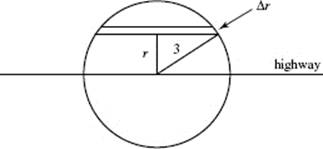
mi long and its area is ![]() The strip’s population is approximately 2(12 − 2r)
The strip’s population is approximately 2(12 − 2r) ![]() Δr. The total population of the entire city is twice the integral
Δr. The total population of the entire city is twice the integral ![]() as it includes both halves of the city.
as it includes both halves of the city.
22. (C)
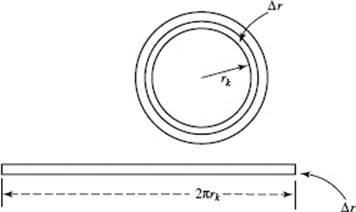
The population equals ∑ (area · density). We partition the interval [0,10] along a radius from the center of town into 5 equal subintervals each of width Δr = 2 mi. We will divide Winnipeg into 5 rings. Each has area equal to (circumference × width), so the area is 2πrk Δr or 4πrk. The population in the ring is
(4πrk)· (density at rk) = 4πrk · f (rk).
A Riemann sum, using left-hand values, is 4π · 0 · 50 + 4π · 2 · 45 + 4π · 4 · 40 + 4π · 6 · 30 + 4π · 8 · 15 = 4π(90 + 160 + 180 + 120) ![]() 6912 hundred people—or about 691,200 people.
6912 hundred people—or about 691,200 people.
23. (E) The total amount dumped after 7 weeks is
![]()
24. (B) The total change in temperature of the roast 20 min after it is put in the refrigerator is
![]()
Since its temperature was 160°F when placed in the refrigerator, then 20 min later it is (160 − 89.7)°F or about 70°F. Note that the temperature of the refrigerator (45°F) is not used in answering the question because it is already “built into” the cooling rate.
25. (A) Let T be the number of weeks required to release 9 tons. We can use parts to integrate ![]() then substitute the limits. We must then set the resulting expression equal to 9 and solve for T. A faster, less painful alternative is to use a graphing calculator to solve the equation
then substitute the limits. We must then set the resulting expression equal to 9 and solve for T. A faster, less painful alternative is to use a graphing calculator to solve the equation
![]()
The answer is about 10.2 weeks.
26. (D) Note that the curve is above the x-axis on [0, 1], but below on [1, 3], and that the areas for x < 0 and x > 3 are unbounded.
Using the calculator, we get
![]()
27. (E) The FTC yields total change:
![]()
28. (C) The total change (increase) in population during the second hour is given by ![]() The answer is 1046.
The answer is 1046.
29. (C) Call the time in hours t and the function for visitors/hour R(t). Then the area under the curve represents the number of visitors V. We will estimate the time k when ![]() using a Riemann sum.
using a Riemann sum.
|
The table shows one |
|
|||
|
Hour |
Visitors/hour (midpoint est.) |
Total visitors since noon |
|
|
|
Noon–1 P.M. |
5 |
5 |
|
|
|
1−2 P.M. |
25 |
30 |
|
|
|
2−3 P.M. |
70 |
100 |
|
|
|
3−4 P.M. |
120 |
220 |
|
|
We estimate that there had been about 100 visitors by 3 P.M. and 220 by 4 P.M., so the 200th visitor arrived between 3 and 4 P.M.
30. (B) 
31. (C) We partition [0, 2] into n equal subintervals each of time Δt hr. Since the 18-wheeler gets (4 + 0.01v) mi/gal of diesel, it uses ![]()
Since it covers v · Δt mi during Δt hr, it uses ![]()
Since ![]() we see that the diesel fuel used in the first 2 hr is
we see that the diesel fuel used in the first 2 hr is
Answers Explained
1. (C) v(t) = 2t2 − t + C; v(1) = 3; so C = 2.
2. (B) If a(t) = 20t3 − 6t, then
v(t) = 5t4 − 3t2 + C1,
s(t) = t5 − t3 + C1 t + C2,
Since
s(−1) = −1 + 1 − C1 + C2 = 2
and
s(1) = 1 − 1 + C1 + C2 = 4,
therefore
2C2 = 6, C2, = 3,
C1 = 1.
So
v(t) = 5t4 − 3t2 + 1.
3. (D) From Answer 2, s(t) = t5 − t3 + t + 3, so s(0) = C2 = 3.
4. (B) Since a(t) = −32, v(t) = −32t + 40, and the height of the stone s(t) = −16t2 + 40t + C. When the stone hits the ground, 4 sec later, s(t) = 0, so
![]()
5. (C) From Answer 4
s(t) = −16t2 + 40t + 96.
Then
s ′(t) = −32t + 40,
which is zero if t = 5/4, and that yields maximum height, since s ″(t) = −32.
6. (E) The velocity v(t) of the car is linear, since its acceleration is constant and
7. (B) Since v = 100 − 20t, s = 100t − 10t2 + C with s(0) = 0. So s(1) = 100 − 10 = 90 ft.
8. (A) 
9. (A) The odometer measures the total trip distance from time t = a to t = b (whether the car moves forward or backward or reverses its direction one or more times from t = a to t = b). This total distance is given exactly by ![]()
10. (E) (A), (B), (C), and (D) are all true. (E) is false: see Answer 9.
11. (A) Integrating yields ![]() + C or y2 = x2 + 2C or y2 = x2 + C ′, where we have replaced the arbitrary constant 2C by C ′.
+ C or y2 = x2 + 2C or y2 = x2 + C ′, where we have replaced the arbitrary constant 2C by C ′.
12. (C) For initial point (−2,1), x2 − y2 = 3. Rewriting the d.e. y dy = x dx as ![]() reveals that the derivative does not exist when y = 0, which occurs at
reveals that the derivative does not exist when y = 0, which occurs at ![]() Since the particular solution must be differentiable in an interval containing x = −2, the domain is
Since the particular solution must be differentiable in an interval containing x = −2, the domain is ![]()
13. (E) We separate variables. ![]() The initial point yields ln
The initial point yields ln ![]() hence c = −2. With y > 0, the particular solution is ln
hence c = −2. With y > 0, the particular solution is ln ![]()
14. (C) We separate variables. ![]() The particular solution is −e−y = x − 2.
The particular solution is −e−y = x − 2.
15. (B) The general solution is ![]() when x = 4 yields C = 0.
when x = 4 yields C = 0.
16. (E) Since ![]() it follows that
it follows that
ln y = ln x + C or ln y = ln x + ln k;
so y = kx.
17. (E) ![]() hence the general solution is y = kex, k ≠ 0.
hence the general solution is y = kex, k ≠ 0.
18. (A) We rewrite and separate variables, getting ![]() The general solution is
The general solution is
![]()
19. (C) We are given that ![]() The general solution is ln |y| = 3 ln |x| + C.
The general solution is ln |y| = 3 ln |x| + C.
Thus, |y| = c |x3 |; y = ±c x3. Since y = 1 when x = 1, we get c = 1.
20. (E) The d.e. ![]() reveals that the derivative does not exist when x = 0. Since the particular solution must be differentiable in an interval containing initial value x = 1, the domain is x > 0.
reveals that the derivative does not exist when x = 0. Since the particular solution must be differentiable in an interval containing initial value x = 1, the domain is x > 0.
21. (E) The general solution is y = k ln |x| + C, and the particular solution is y = 2 ln |x| + 2.
22. (D) We carefully(!) draw a curve for a solution to the d.e. represented by the slope field. It will be the graph of a member of the family y = sin x + C. At the right we have superimposed the graph of the particular solution y = sin x − 0.5.
23. (B)
It’s easy to see that the answer must be choice (A), (B), or (C), because the slope field depends only on x: all the slope segments for a given x are parallel. Also, the solution curves in the slope field are all concave up, as they are only for choices (A) and (B). Finally, the solution curves all have a minimum at x = 2, which is true only for differential equation (B).
24. (E) The solution curve is y = tan x, which we can obtain from the differential equation y ′ = 1 + y2 with the condition y(0) = 0 as follows:
![]()
Since y(0) = 0, C = 0. Verify that (A) through (D) are incorrect.
NOTE: In matching slope fields and differential equations in Questions 25–29, keep in mind that if the slope segments along a vertical line are all parallel, signifying equal slopes for a fixed x, then the differential equation can be written as y ′ = f (x). Replace “vertical” by “horizontal” and “x” by “ y” in the preceding sentence to obtain a differential equation of the form y ′ = g(y).
25. (B) The slope field for y ′ = y must by II; it is the only one whose slopes are equal along a horizontal line.
26. (D) Of the four remaining slope fields, IV is the only one whose slopes are not equal along either a vertical or a horizontal line (the segments are not parallel). Its d.e. therefore cannot be either of type y ′ = f (x) or y ′ = g(y). The d.e. must be implicitly defined—that is, of the form y ′ = F(x,y). So the answer here is IV.
27. (C) The remaining slope fields, I, III, and V, all have d.e.’s of the type y ′ = f (x). The curves “lurking” in III are trigonometric curves—not so in I and V.
28. (A) Given y ′ = 2x, we immediately obtain the general solution, a family of parabolas, y = x2 + C. (Trace the parabola in I through (0, 0), for example.)
29. (E) V is the only slope field still unassigned! Furthermore, the slopes “match” e−x2: the slopes are equal “about” the y-axis; slopes are very small when x is close to −2 and 2; and e−x2 is a maximum at x = 0.
30. (A) From Answer 25, we know that the d.e. for slope field II is y ′ = y. The general solution is y = cex. For a solution curve to pass through point (0, −1), we have −1 = ce0; and c = −1.
31. (C) Euler’s method for y ′ = x, starting at (1, 5), with Δx = 0.1, yields
|
x |
y |
(SLOPE) *· Δx |
= Δ y |
|
|
1 |
5 |
1 · (0.1) |
= 0.1 |
*The slope is x. |
|
1.1 |
5.1 |
(1.1) · (0.1) |
= 0.11 |
|
|
1.2 |
5.21 |
32. (B) We want to compare the true value of y(1.2) to the estimated value of 5.21 obtained using Euler’s method in Solution 31. Solving the d.e. ![]() yields
yields ![]() and initial condition y(1) = 5 means that
and initial condition y(1) = 5 means that ![]() or C = 4.5. Hence
or C = 4.5. Hence ![]() + 4.5 = 5.22. The error is 5.22−5.21 = 0.01.
+ 4.5 = 5.22. The error is 5.22−5.21 = 0.01.
33. (A) Slopes depend only on the value of y, and the slope field suggests that y ′ = 0 whenever y = 0 or y = −2.
34. (D) The slope field suggests that the solution function increases (or decreases) without bound as x increases, but approaches y = 1 as a horizontal asymptote as x decreases.
35. (D) We separate variables to get ![]() We integrate:
We integrate:
![]() With t = 0 and s = 1, C = 0. When
With t = 0 and s = 1, C = 0. When ![]() we get
we get ![]()
36. (B) Since ![]() and ln R = ct + C. When t = 0, R = R0; so ln R0 = C or ln R = ct + ln R0. Thus
and ln R = ct + C. When t = 0, R = R0; so ln R0 = C or ln R = ct + ln R0. Thus
ln R − ln R0 = ct; ln ![]()
37. (D) The question gives rise to the differential equation ![]() where P = 2P0 when t = 50. We seek
where P = 2P0 when t = 50. We seek ![]() for t = 75. We get ln
for t = 75. We get ln ![]() with ln 2 = 50k; then
with ln 2 = 50k; then
![]()
38. (A) We let S equal the amount present at time t; using S = 40 when t = 0 yields ln ![]() Since, when t = 2, S = 10, we get
Since, when t = 2, S = 10, we get
![]()
39. (A) We replace g(x) by y and then solve the equation ![]() We use the constraints given to find the particular solution
We use the constraints given to find the particular solution ![]()
40. (C) The general solution of ![]() is ln y = x + C or y = cex. For a solution to pass through (2, 3), we have 3 = ce2 and c = 3/e2
is ln y = x + C or y = cex. For a solution to pass through (2, 3), we have 3 = ce2 and c = 3/e2 ![]() 0.406.
0.406.
41. (C) At a point of intersection, y ′ = x + y and x + y = 0. So y ′ = 0, which implies that y has a critical point at the intersection. Since y ″ = 1 + y ′ = 1 + (x + y) = 1 + 0 = 1, y ″ > 0 and the function has a local minimum at the point of intersection. [See Figure N9–5, showing the slope field for y ′= x + y and the curve y = ex − x − 1 that has a local minimum at (0, 0).]
42. (A) Although there is no elementary function (one made up of polynomial, trigonometric, or exponential functions or their inverses) that is an anti-derivative of F ′(x) = e−x2, we know from the FTC, since F(0) = 0, that
![]()
To approximate ![]() use your graphing calculator
use your graphing calculator
For upper limits of integration x = 50 and x = 60, answers are identical to 10 decimal places. Rounding to three decimal places yields 0.886.
43. (C) Logistic growth is modeled by equations of the form ![]() where L is the upper limit. The graph shows L = 1000, so the differential equation must be
where L is the upper limit. The graph shows L = 1000, so the differential equation must be ![]() Only equation C is of this form (k = 0.003).
Only equation C is of this form (k = 0.003).
44. (D) We start with x = 3 and y = 100. At x = 3, ![]() moving us to x = 3 + 2 = 5 and y = 100 + 5 = 105. From there
moving us to x = 3 + 2 = 5 and y = 100 + 5 = 105. From there ![]() so when x = 5 + 2 = 7 we estimate y = 105 + (−1) = 104.
so when x = 5 + 2 = 7 we estimate y = 105 + (−1) = 104.
45. (C) We separate the variables in the given d.e., then solve:
Since y(0) = 180, ln 112 = c. Then
When t = 10, y = 68 + 112e−1.1 ![]() 105°F.
105°F.
46. (E) The solution of the d.e. in Question 45, where y is the temperature of the coffee at time t, is
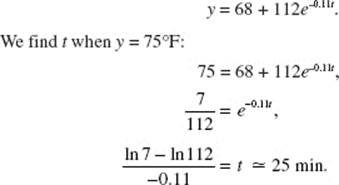
47. (D) If Q is the concentration at time t, then ![]() We separate variables and integrate:
We separate variables and integrate:
![]()
We let Q(0) = Q0. Then
![]()
We now find t when Q = 0.1Q0:
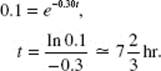
48. (E) Please read the sections on Applications for Restricted Growth and Applications for Logistic Growth in this chapter for the characteristics of the logistic model.
49. (D) (A), (B), (C), and (E) are all of the form y ′ = ky(a − y).
50. (B) The rate of growth, ![]() is greatest when its derivative is 0 and the curve of
is greatest when its derivative is 0 and the curve of ![]() is concave down. Since
is concave down. Since
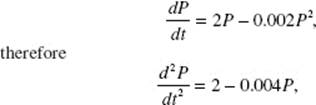
which is equal to 0 if ![]() or 500, animals. The curve of y ′ is concave down for all P, since
or 500, animals. The curve of y ′ is concave down for all P, since
![]()
so P = 500 is the maximum population.
51. (A) The description of temperature change here is an example of Case II: the rate of change is proportional to the amount or magnitude of the quantity present (i.e., the temperature of the corpse) minus a fixed constant (the temperature of the mortuary).
52. (C) Since (A) is the correct answer to Question 51, we solve the d.e. in (A) given the initial condition T(0) = 32:
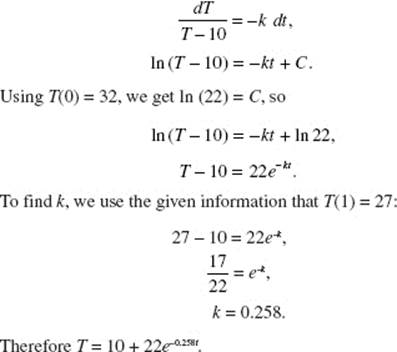
BC ONLY
Answers Explained
1. (B) ![]() converges to −1.
converges to −1.
2. (C) Note that ![]()
3. (D) The sine function varies continuously between −1 and 1 inclusive.
4. (E) Note that ![]() is a sequence of the type sn = rn with |r| < 1; also that
is a sequence of the type sn = rn with |r| < 1; also that ![]() by repeated application of L’Hôpital’s rule.
by repeated application of L’Hôpital’s rule.
5. (C) ![]()
6. (E) The harmonic series ![]() is a counterexample for (A), (B), and (C).
is a counterexample for (A), (B), and (C). ![]() shows that (D) does not follow.
shows that (D) does not follow.
7. (B) 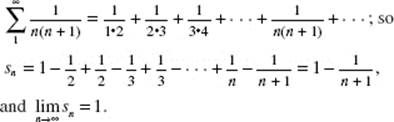
8. (A) ![]()
BC ONLY
9. (B) Find counterexamples for statements (A), (C), and (D).
10. (D) ![]() the general term of a divergent series.
the general term of a divergent series.
11. (D) (A), (B), (C), and (E) all converge; (D) is the divergent geometric series with r = −1.1.
12. (D) ![]()
13. (A) If ![]() then f (0) is not defined.
then f (0) is not defined.
14. (C) ![]() unless x = 3.
unless x = 3.
15. (B) The integrated series is ![]() See Question 27.
See Question 27.
16. (E) ![]()
17. (A) 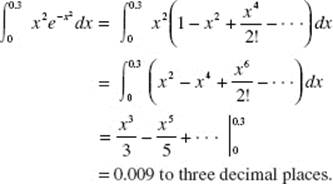
18. (E) The series satisfies the Alternating Series Test, so the error is less than the first term dropped, namely, ![]() (see (5)), in the chart for Common Maclaurin Series in Chapter 10 of this eBook. So n ≥ 500.
(see (5)), in the chart for Common Maclaurin Series in Chapter 10 of this eBook. So n ≥ 500.
19. (D) Note that the Taylor series for tan−1 x satisfies the Alternating Series Test and that ![]() then the first omitted term,
then the first omitted term, ![]() is negative. Hence P7 (x) exceeds tan−1 x.
is negative. Hence P7 (x) exceeds tan−1 x.
20. (E) Now the first omitted term, ![]() is positive for x < 0. Hence P9 (x) is less than tan−1 x.
is positive for x < 0. Hence P9 (x) is less than tan−1 x.
21. (A) If ![]() converges, so does
converges, so does ![]() where m is any positive integer; but their sums are probably different.
where m is any positive integer; but their sums are probably different.
BC ONLY
22. (E) Each series given is essentially a p-series. Only in (E) is p > 1.
23. (C) Use the Integral Test.
24. (C) The limit of the ratio for the series ![]() is 1, so this test fails; note for (E) that
is 1, so this test fails; note for (E) that
![]()
25. (B) ![]() does not equal 0.
does not equal 0.
26. (E) Note the following counterexamples:
(A) ![]()
(B) ![]()
(C) ![]()
(D) ![]()
27. (C) Since ![]() the series converges if |x| < 1. We must test the end-points: when x = 1, we get the divergent harmonic series; x = −1 yields the convergent alternating harmonic series.
the series converges if |x| < 1. We must test the end-points: when x = 1, we get the divergent harmonic series; x = −1 yields the convergent alternating harmonic series.
28. (A) ![]() for all x ≠ −1; since the given series converges to 0 if x = −1, it therefore converges for all x.
for all x ≠ −1; since the given series converges to 0 if x = −1, it therefore converges for all x.
29. (B) The differentiated series is ![]()
30. (B) See Example 52.
31. (D) Note that every derivative of ex is e at x = 1. The Taylor series is in powers of (x − 1) with coefficients of the form ![]()
32. (D) For f (x) = cos x around ![]()
33. (C) Note that ln q is defined only if q > 0, and that the derivatives must exist at x = a in the formula for the Taylor series.
34. (A) Use
![]()
![]() Or use the series for ex and let x = −0.1.
Or use the series for ex and let x = −0.1.
BC ONLY
35. (C) 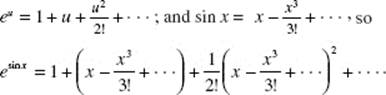
Or generate the Maclaurin series for esin x.
36. (E) (A), (B), (C), and (D) are all true statements.
37. (A) 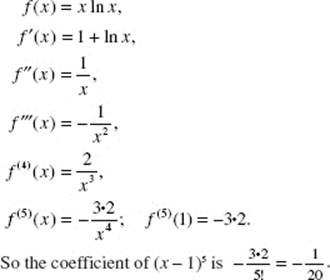
38. (C) 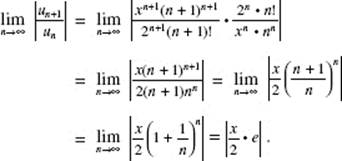
Since the series converges when ![]() that is, when
that is, when ![]() the radius of convergence is
the radius of convergence is ![]()
39. (E) The Maclaurin series sin x = ![]() converges by the Alternating Series Test, so the error |R4 | is less than the first omitted term. For x = 1, we have
converges by the Alternating Series Test, so the error |R4 | is less than the first omitted term. For x = 1, we have ![]()
40. (D) 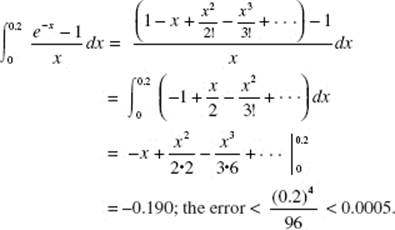
Answers Explained
Part A
1. (D) If f (x) = ![]() for x ≠ 0 and f (0) = 0 then,
for x ≠ 0 and f (0) = 0 then,
![]()
thus this function is continuous at 0. In (A), ![]() does not exist; in (B), f has a jump discontinuity; in (C), f has a removable discontinuity; and in (E), f has an infinite discontinuity.
does not exist; in (B), f has a jump discontinuity; in (C), f has a removable discontinuity; and in (E), f has an infinite discontinuity.
2. (C) To find the y-intercept, let x = 0; y = − 1.
3. (A) ![]()
4. (D) The line x + 3y + 3 = 0 has slope ![]() a line perpendicular to it has slope 3.
a line perpendicular to it has slope 3.
The slope of the tangent to y = x2 − 2x + 3 at any point is the derivative 2x − 2. Set 2x − 2 equal to 3.
5. (A)  is f′ (1), where
 ![]() Or simplify the given fraction to
Or simplify the given fraction to ![]()
6. (E) Because p ″(2) < 0 and p ″(5) > 0, p changes concavity somewhere in the interval [2,5], but we cannot be sure p ″ changes sign at x = 4.
7. (C) 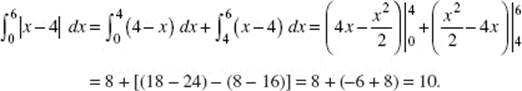
Save time by finding the area under y = |x − 4| from a sketch!
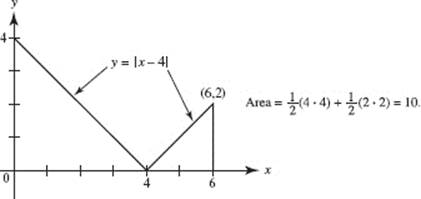
8. (A) Since the degrees of numerator and denominator are the same, the limit as x→∞ is the ratio of the coefficients of the terms of highest degree: ![]()
9. (D) On the interval [1, 4], f′ (x) = 0 only for x = 3. Since f (3) is a relative minimum, check the endpoints to find that f (4) = 6 is the absolute maximum of the function.
10. (C) To find lim f as x → 5 (if it exists), multiply f by ![]()
![]()
and if x ≠ 5 this equals ![]() So lim f (x) as x → 5 is
So lim f (x) as x → 5 is ![]() For f to be continuous at x = 5, f (5) or c must also equal
For f to be continuous at x = 5, f (5) or c must also equal ![]()
11. (D) Evaluate ![]()
12. (A) ![]() From the equation given, y = esin x.
From the equation given, y = esin x.
13. (D) If f (x) = x cos x, then f ′(x) = −x sin x + cos x, and
![]()
14. (C) If y = ex ln x, then ![]() which equals e when x = 1. Since also y = 0 when x = 1, the equation of the tangent is y = e(x − 1).
which equals e when x = 1. Since also y = 0 when x = 1, the equation of the tangent is y = e(x − 1).
15. (B) v = 4(t − 2)3 and changes sign exactly once, when t = 2.
16. (C) Evaluate ![]()
17. (C) 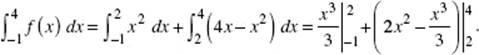
18. (C) Since v = 3t2 + 3, it is always positive, while a = 6t and is positive for t > 0 but negative for t < 0. The speed therefore increases for t > 0 but decreases for t < 0.
19. (A) Note from the figure that the area, A, of a typical rectangle is
![]()
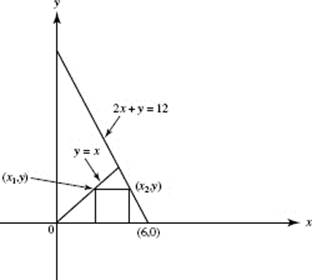
For y = 2, ![]() Note that
Note that ![]() is always negative.
is always negative.
20. (B) If S represents the square of the distance from (3, 0) to a point (x, y) on the curve, then S = (3 − x)2 + y2 = (3 − x)2 + (x2 − 1). Setting ![]() yields the minimum distance at
yields the minimum distance at ![]()
21. (D) ![]()
22. (D) See the figure. Since the area, A, of the ring equals π (y22 − y12),
A = π [(6x − x2)2 − x4] = π [36x2 − 12x3 + x4 − x4 ]
and ![]() = π (72x − 36x2) = 36πx (2 − x).
= π (72x − 36x2) = 36πx (2 − x).
It can be verified that x = 2 produces the maximum area.
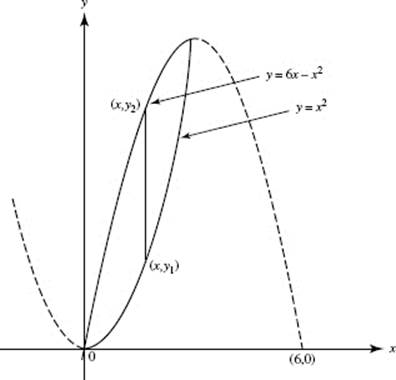
23. (A) This is of type 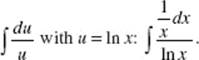
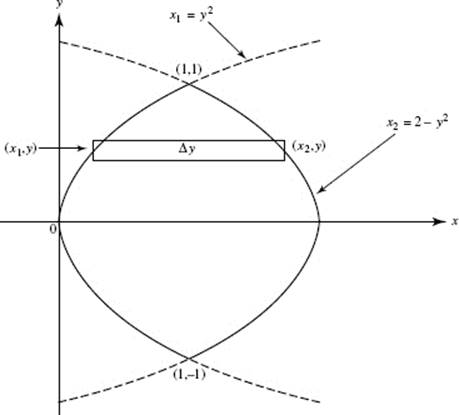
24. (A) About the y-axis; see the figure. Washer.
![]()
25. (E) Separating variables, we get y dy = (1 − 2x) dx. Integrating gives
![]()
or
y2 = 2x − 2x2 + k
or
2x2 + y2 − 2x = k.
26. (E) 2(5) + ![]()
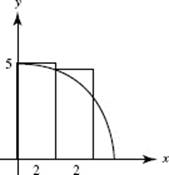
27. (E) ![]()
28. (D) Use L’Hôpital’s Rule or rewrite the expression as ![]()
29. (D) For f (x) = tan x, this is ![]()
30. (E) The parameter k determines the amplitude of the sine curve. For f = k sin x and g = ex to have a common point of tangency, say at x = q, the curves must both go through (q, y) and their slopes must be equal at q. Thus, we must have
k sin q = eq and k cos q = eq,
and therefore
sin q = cos q.
The figure shows ![]()
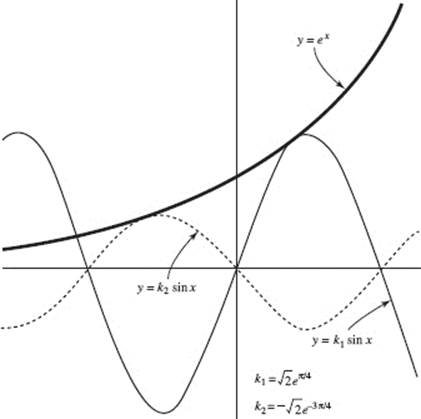
31. (D) We differentiate implicitly to find the slope ![]()
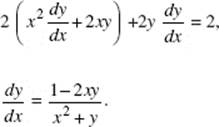
At (3, 1), ![]() The linearization is
The linearization is ![]()
32. (C) 
33. (A) About the x-axis. Disk.
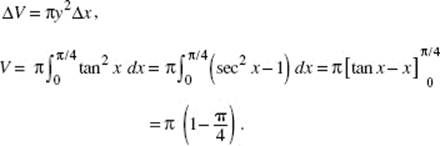
34. (C) Let f (x) = ax; then ![]() ln a = ln a.
ln a = ln a.
35. (E) ![]() is a function of x alone; curves appear to be asymptotic to the y-axis and to increase more slowly as |x| increases.
is a function of x alone; curves appear to be asymptotic to the y-axis and to increase more slowly as |x| increases.
36. (D) The given limit is equivalent to
where ![]() The answer is
The answer is ![]()
37. (B) 
38. (C) In the figure, the curve for y = ex has been superimposed on the slope field.
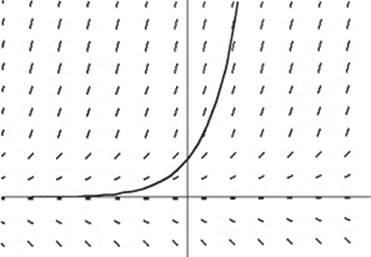
39. (C) The general solution is y = 3 ln|x2 − 4| + C. The differential equation ![]() reveals that the derivative does not exist for x = ±2. The particular solution must be differentiable in an interval containing the initial value x = −1, so the domain is −2 < x < 2.
reveals that the derivative does not exist for x = ±2. The particular solution must be differentiable in an interval containing the initial value x = −1, so the domain is −2 < x < 2.
40. (A) The solution curve shown is y = ln x, so the differential equation is ![]()
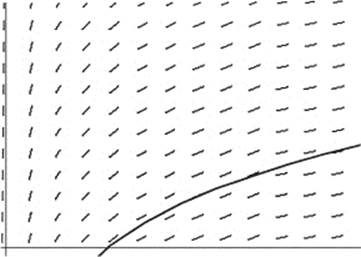
41. (D) ![]() = sec θ; dx = sec2 θ; 0 ≤ x ≤ 1; so 0 ≤ θ ≤
= sec θ; dx = sec2 θ; 0 ≤ x ≤ 1; so 0 ≤ θ ≤ ![]()
42. (C) The equations may be rewritten as ![]() = sin u and y = 1 − 2 sin2 u,
= sin u and y = 1 − 2 sin2 u,
giving ![]()
43. (D) Use the formula for area in polar coordinates,
![]()
then the required area is given by
![]()
(See polar graph 63 in the Appendix.)
44. (C) ![]()
45. (A) The first three derivatives of ![]() The first four terms of the Maclaurin series (about x = 0) are 1, + 2x,
The first four terms of the Maclaurin series (about x = 0) are 1, + 2x, ![]()
Note also that ![]() represents the sum of an infinite geometric series with first term 1 and common ratio 2x. Hence,
represents the sum of an infinite geometric series with first term 1 and common ratio 2x. Hence,
![]()
46. (D) We use parts, first letting u = x2, dv = e−x dx; then du = 2x dx, v = −e−x and
![]()
Now we use parts again, letting u = x, dv = e−x dx; then du = dx, v = −e−x and
![]()
Alternatively, we could use the Tic-Tac-Toe Method:
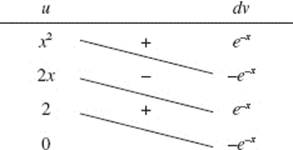
Then ![]()
47. (E) Use formula (20) in the Appendix to rewrite the integral as
![]()
48. (E) The area, A, is represented by ![]()
49. (D) 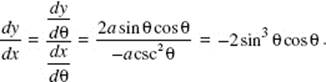
50. (C) Check to verify that each of the other improper integrals converges.
51. (D) Note that the integral is improper.
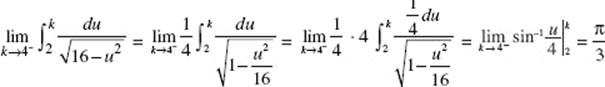
See Example 26.
52. (C) Let ![]() Then ln y = −x ln x and
Then ln y = −x ln x and
![]()
Now apply L’Hôpital’s Rule:
![]()
So, if ![]() ln y = 0, then
ln y = 0, then ![]()
53. (D) The speed, |v|, equals  and since x = 3y − y2,
![]()
Then |v| is evaluated, using y = 1, and equals ![]()
54. (A) This is an indeterminate form of type ![]() use L’Hôpital’s Rule:
use L’Hôpital’s Rule:
![]()
55. (E) We find A and B such that ![]()
After multiplying by the common denominator, we have
3x + 2 = A(x − 4) + B(x + 3).
Substituting x = −3 yields A = 1, and x = 4 yields B = 2; hence,
![]()
56. (B) Since ![]()
Then 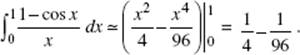
Note that ![]() so the integral is proper.
so the integral is proper.
57. (D) We represent the spiral as P(θ) = (θ cos θ, θ sin θ). So
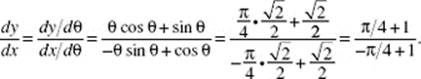
Part B
58. (D) Since h is increasing, h ′ ≥ 0. The graph of h is concave downward for x < 2 and upward for x > 2, so h ″ changes sign at x = 2, where it appears that h′ = 0 also.
59. (C) I is false since, for example, f ′(−2) = f ′(1) = 0 but neither g(−2) nor g(1) equals zero.
II is true. Note that f = 0 where g has relative extrema, and f is positive, negative, then positive on intervals where g increases, decreases, then increases.
III is also true. Check the concavity of g: when the curve is concave down, h < 0; when up, h > 0.
60. (A) If ![]()
61. (D) ![]() represents the area of the same region as
represents the area of the same region as ![]() translated one unit to the left.
translated one unit to the left.
62. (D) According to the Mean Value Theorem, there exists a number c in the interval [1,1.5] such that ![]() Use your calculator to solve the equation
Use your calculator to solve the equation ![]() for c (in radians).
for c (in radians).
63. (E) Here are the relevant sign lines:
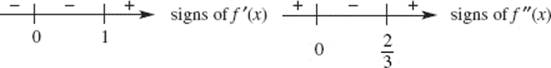
We see that f ′ and f ″ are both positive only if x > 1.
64. (E) Note from the sign lines in Question 63 that f changes from decreasing to increasing at x = 1, so f has a local minimum there.
Also, the graph of f changes from concave up to concave down at x = 0, then back to concave up at ![]() hence f has two points of inflection.
hence f has two points of inflection.
65. (C) The derivatives of ln (x + 1) are 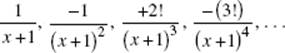
The nth derivative at ![]()
66. (C) The absolute-value function f (x) = |x| is continuous at x = 0, but f ′(0) does not exist.
67. (C) Let F ′(x) = f (x); then F ′(x + k) = f (x + k);
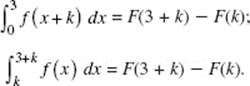
Or let u = x + k. Then dx = du, when x = 0, u = k; when x = 3, u = 3 + k.
68. (E) See the figure. The equation of the generating circle is (x − 3)2 + y2 = 1, which yields ![]()
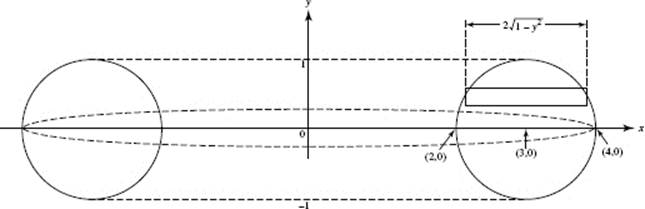
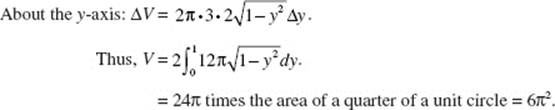
69. (D) Note that f (g(u)) = tan−1 (e2u); then the derivative is ![]()
70. (D) Let ![]() Then cos (xy) [xy′ + y] = y ′. Solve for y ′.
Then cos (xy) [xy′ + y] = y ′. Solve for y ′.
71. (E) 
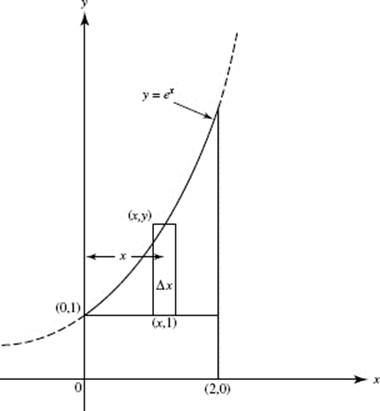
72. (C) About the x-axis; see the figure. Washer.
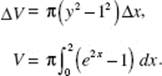
73. (C) By the Mean Value Theorem, there is a number c in [1, 2] such that
![]()
74. (D) The enclosed region, S, is bounded by y = sec x, the y-axis, and y = 4. It is to be rotated about the y-axis.
Use disks; then ΔV = πR2 H = π(arc sec y)2 Δy. Using the calculator, we find that
![]()
75. (C) If Q is the amount at time t. then Q = 40e−kt. Since Q = 20 when t = 2, k = −0.3466. Now find Q when t = 3, from Q = 40e−(0.3466) 3, getting Q = 14 to the nearest gram.
76. (A) The velocity v(t) is an antiderivative of a(t), where ![]() So
So ![]() arctan t + C. Since v (1) = 0, C = − π.
arctan t + C. Since v (1) = 0, C = − π.
77. (D) Graph y = tan x and y = 2 − x in [−1, 3] × [−1, 3]. Note that
![]()
The limits are y = 0 and y = b, where b is the ordinate of the intersection of the curve and the line. Using the calculator, solve
arctan y = 2 − y
and store the answer in memory as B. Evaluate the desired area:
![]()
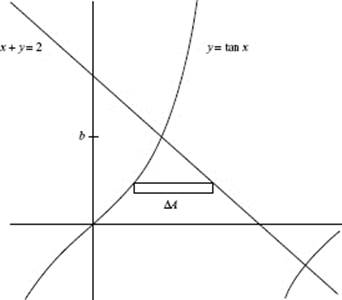
78. (E) Center the ellipse at the origin and let (x, y) be the coordinates of the vertex of the inscribed rectangle in the first quadrant, as shown in the figure.
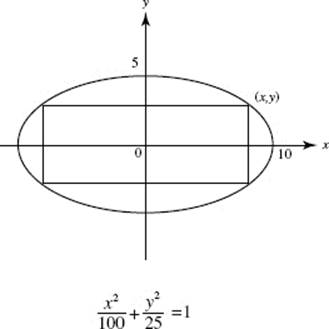
To maximize the rectangle’s area A = 4xy, solve the equation of the ellipse, getting
![]()
So ![]() Graph
Graph ![]() in the window [0,5] × [0,150],
in the window [0,5] × [0,150],
The calculator shows that the maximum area (the y-coordinate) equals 100.
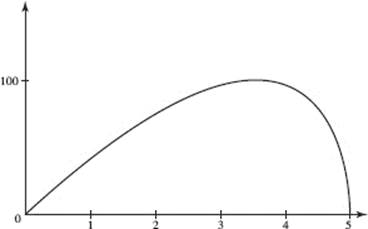
79. (B) ![]()
80. (B) When f ′ is positive, f increases. By the Fundamental Theorem of Calculus, f′ (x) = 1 − 2 (cos x)3. Graph f ′ in [0, 2π] × [−2, 4]. It is clear that f ′ > 0 on the interval a < x < b. Using the calculator to solve 1 − 2(cos x)3 = 0 yields a = 0.654 and b = 5.629.
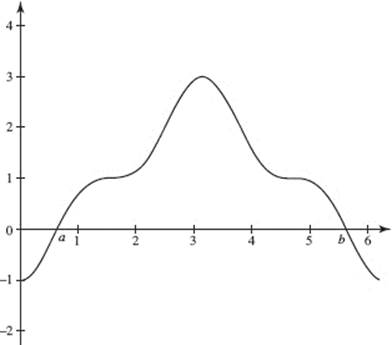
81. (C) ![]()
82. (B) The volume is composed of elements of the form ΔV = (2x)2 Δy. If h is the depth, in feet, then, after t hr,
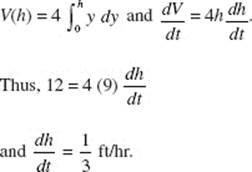
83. (B) Separating variables yields
P(0) = 300 gives c = 700. P(5) = 500 yields 500 = 1000 − 700e−5k, so k ![]() + 0.0673. Now P(10) = 1000 − 700e−0.673
+ 0.0673. Now P(10) = 1000 − 700e−0.673 ![]() 643.
643.
84. (C) ![]() dx = 4 arctan 1 = π. H′ (1) = f (1) = 2.
dx = 4 arctan 1 = π. H′ (1) = f (1) = 2.
The equation of the tangent line is y − π = 2(x − 1).
85. (C) Using midpoint diameters to determine cylinders, estimate the volume to be
V ![]() π · 82 · 25 + π · 62 · 25 + π · 42 · 25 + π · 32 · 25.
π · 82 · 25 + π · 62 · 25 + π · 42 · 25 + π · 32 · 25.
86. (A) 
87. (C) H′ (3) = f′ (g(3)) · g′ (3) = f′ (2) · g′ (3).
88. (E) M′ (3) = f (3) · g′ (3) + g(3) · f′ (3) = 4 · 3 + 2 · 2.
89. (E) 
90. (C) ![]()
91. (D) Here are the pertinent curves, with d denoting the depth of the water:
92. (B) Use areas; then ![]() Thus, f (7) − f (1) = 7.
Thus, f (7) − f (1) = 7.
93. (B) The region x units from the stage can be approximated by the semicircular ring shown; its area is then the product of its circumference and its width.
The number of people standing in the region is the product of the area and the density:
![]()
To find the total number of people, evaluate
![]()
94. (B) ![]() is positive, but decreasing; hence
is positive, but decreasing; hence ![]()
95. (C) ![]()
96. (E) On 2 ≤ t ≤ 5, the object moved ![]() ft to the right; then on 5 ≤ t ≤ 8, it moved only
ft to the right; then on 5 ≤ t ≤ 8, it moved only ![]() ft to the left.
ft to the left.
97. (B) ![]()
98. (D) Evaluate ![]()
99. (A) ![]()
Use, also, the facts that the speed is given by  and that the point moves counterclockwise; then
 ![]() = 4, yielding
= 4, yielding ![]() and
and ![]() at the given point. The velocity vector, v, at (3, 4) must therefore be
at the given point. The velocity vector, v, at (3, 4) must therefore be ![]()
100. (A) 
101. (B) The formula for length of arc is
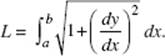
Since y = 2x, we find
![]()
102. (D) a(t) = (0, et); the acceleration is always upward.
103. (A) At (0, 1), ![]() so Euler’s method yields (0.1, 1 + 0.1(4)) = (0.1, 1.4).
so Euler’s method yields (0.1, 1 + 0.1(4)) = (0.1, 1.4). ![]() has particular solution y = e4x; the error is e4(0.1) − 1.4.
has particular solution y = e4x; the error is e4(0.1) − 1.4.
104. (D) ![]() Note that the series converges by the Alternating Series Test. Since the first term dropped in the estimate is
Note that the series converges by the Alternating Series Test. Since the first term dropped in the estimate is ![]() the estimate is too high, but within 0.1 of the true sum.
the estimate is too high, but within 0.1 of the true sum.
105. (C) ![]() which equals a constant times the harmonic series.
which equals a constant times the harmonic series.
106. (D) We seek x such that
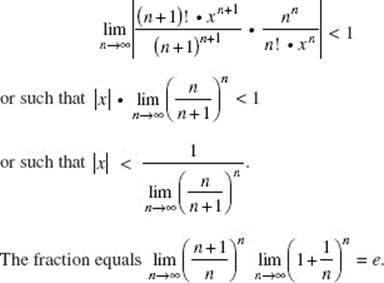
Then |x| < e and the radius of convergence is e.
107. (B) The error is less than the maximum value of ![]()
This maximum occurs at c = x = ![]()
108. (D) 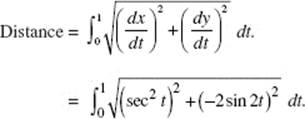
Note that the curve is traced exactly once by the parametric equations from t = 0 to t = 1.
Answers Explained
Part A
1. (a) 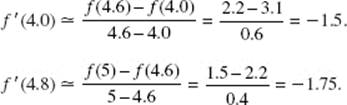
(b) It appears that the rate of change of f, while negative, is increasing. This implies that the graph of f is concave upward.
(c) L = 7.6(0.7) + 5.7(0.3) + 4.2(0.5) + 3.1(0.6) + 2.2(0.4) = 11.87.
(d) Using disks ΔV = πr2 Δx. One possible answer uses the left endpoints of the subintervals as values of r:
V ≈ π(7.6)2 (0.7) + π(5.7)2 (0.3) + π(4.2)2 (0.5) + π(3.1)2 (0.6) + π(2.2)2 (0.4)
2. (a) 12y0 + 0.3 = 24 yields y0 ![]() 1.975.
1.975.
(b) Replace x by 0.3 in the equation of the curve:
The calculator’s solution to three decimal places is y0 = 1.990.
(c) Since the true value of y0 at x = 0.3 exceeds the approximation, conclude that the given curve is concave up near x = 0. (Therefore, it is above the line tangent at x = 0.)
3. Graph f ′(x) = 2x sin x − e(−x2) + 1 in [−7, 7] × [−10, 10].
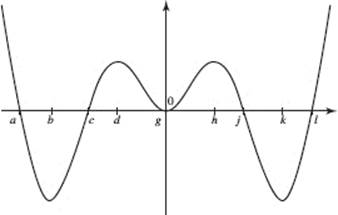
(a) Since f ′ is even and f contains (0, 0), f is odd and its graph is symmetric about the origin.
(b) Since f is decreasing when f ′ < 0, f decreases on the intervals (a, c) and (j, 1). Use the calculator to solve f′ (x) = 0. Conclude that f decreases on −6.202 < x < −3.294 and (symmetrically) on 3.294 < x < 6.202.
(c) f has a relative maximum at x = q if f ′(q) = 0 and if f changes from increasing (f ′ > 0) to decreasing (f ′ < 0) at q. There are two relative maxima here:
at x = a = −6.202 and at x = j = 3.294.
(d) f has a point of inflection when the graph of f changes its concavity; that is, when f′ changes from increasing to decreasing, as it does at points d and h, or when f′ changes from decreasing to increasing, as it does at points b, g, and k. So there are five points of inflection altogether.
4. In the graph below, C is the piece of the curve lying in the first quadrant. S is the region bounded by the curve C and the coordinate axes.
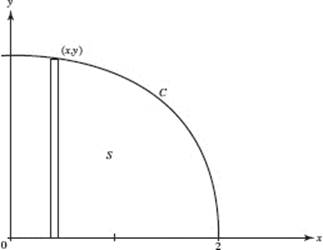
(a) Graph ![]() in [0,3] × [0,5]. Since you want dy/dx, the slope of the tangent, where y = 1, use the calculator to solve
in [0,3] × [0,5]. Since you want dy/dx, the slope of the tangent, where y = 1, use the calculator to solve
![]()
(storing the answer at B). Then evaluate the slope of the tangent to C at y = 1:
f ′(B) ≈ −21.182.
(b) Since ΔA = yΔx, A = ![]()
(c) When S is rotated about the x-axis, its volume can be obtained using disks:
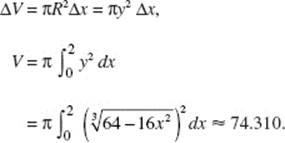
5. See the figure, where R is the point (a, b), and seek a such that
![]()
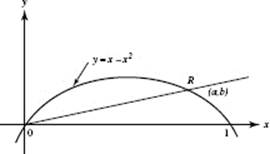
6. Graph y = sin 2x in [−1, 3.2] × [−1, 1]. Note that y = f ″.
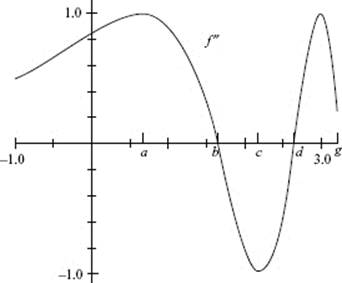
(a) The graph of f is concave downward where f ″ is negative, namely, on (b, d). Use the calculator to solve sin 2x = 0, obtaining b = 1.651 and d = 2.651. The answer to (a) is therefore 1.651 < x < 2.651.
(b) f ′ has a relative minimum at x = d, because f ″ equals 0 at d, is less than 0 on (b, d), and is greater than 0 on (d, g). Thus f ′ has a relative minimum (from part a) at x = 2.651.
(c) The graph of f ′ has a point of inflection wherever its second derivative f ″′ changes from positive to negative or vice versa. This is equivalent to f ″ changing from increasing to decreasing (as at a and g) or vice versa (as at c). Therefore, the graph of f ′ has three points of inflection on [− 1, 3.2].
7. Graph f (x) = cos x and g(x) = x2 − 1 in [−2, 2] × [−2,2], Here, y1 = f and y2 = g.
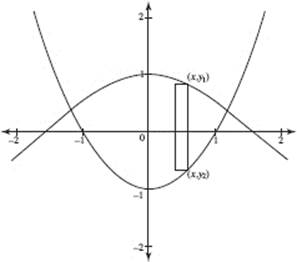
(a) Solve cos x = x2 − 1 to find the two points of intersection: (1.177,0.384) and (−1.177,0.384).
(b) Since ΔA = (y1 − y2) Δx = [f (x) − g(x)] Δx, the area A bounded by the two curves is
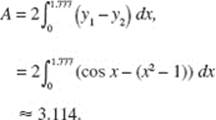
8. (a) Use the Trapezoid Rule, with h = 60 min:
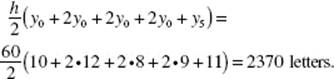
(b) Draw a horizontal line at y = 20 (as shown on the graph below), representing the rate at which letters are processed then.
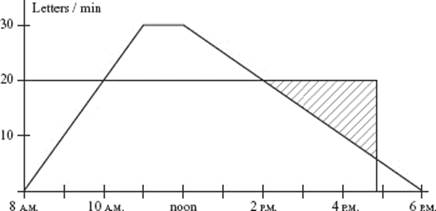
(i) Letters began to pile up when they arrived at a rate greater than that at which they were being processed, that is, at t = 10 A.M.
(ii) The pile was largest when the letters stopped piling up, at t = 2 P.M.
(iii) The number of letters in the pile is represented by the area of the small trapezoid above the horizontal line: ![]()
(iv) The pile began to diminish after 2 P.M., when letters were processed at a rate faster than they arrived, and vanished when the area of the shaded triangle represented 1500 letters. At 5 P.M. this area is ![]() letters, so the pile vanished shortly after 5 P.M.
letters, so the pile vanished shortly after 5 P.M.
9. Draw a vertical element of area as shown below.
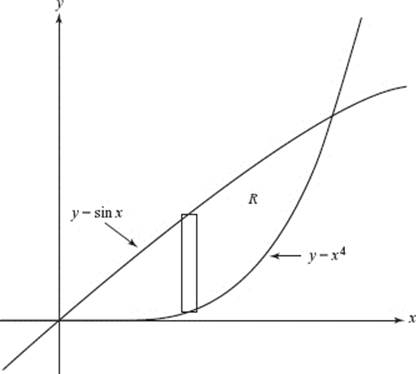
(a) Let a represent the x-value of the positive point of intersection of y = x4 and y = sin x. Solving a4 = sin a with the calculator, we find a = 0.9496.
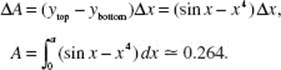
(b) Elements of volume are triangular prisms with height h = 3 and base b = (sinx − x4), as shown below.
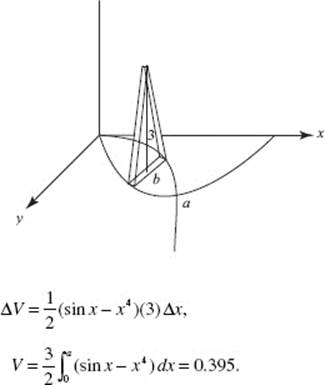
(c) When R is rotated around the x-axis, the element generates washers. If r1, and r2 are the radii of the larger and smaller disks, respectively, then
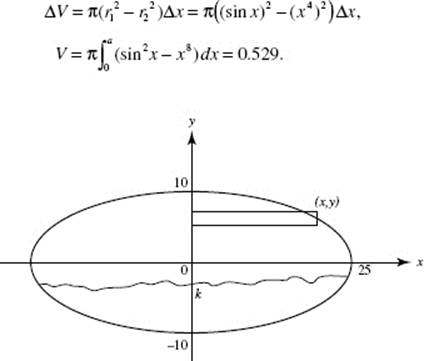
10. The figure above shows an elliptical cross section of the tank. Its equation is
![]()
(a) The volume of the tank, using disks, is ![]() where the ellipse’s symmetry about the x-axis has been exploited. The equation of the ellipse is equivalent to x2 = 6.25(100 − y2), so
where the ellipse’s symmetry about the x-axis has been exploited. The equation of the ellipse is equivalent to x2 = 6.25(100 − y2), so
![]()
Use the calculator to evaluate this integral, storing the answer as V to have it available for part (b).
The capacity of the tank is 7.48V, or 196,000 gal of water, rounded to the nearest 1000 gal.
(b) Let k be the y-coordinate of the water level when the tank is one-fourth full. Then
![]()
and the depth of the water is k + 10.
11. (a) Let h represent the depth of the water, as shown.
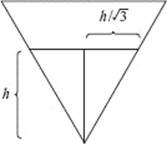
Then h is the altitude of an equilateral triangle, and the base ![]()
The volume of water is
![]()
Now ![]() and it is given that
and it is given that ![]() Thus, when h = 4,
Thus, when h = 4,
![]()
(b) Let x represent the length of one of the sides, as shown.
The bases of the trapezoid are 24 − 2x and 24 − 2x + ![]() and the height is
and the height is ![]()
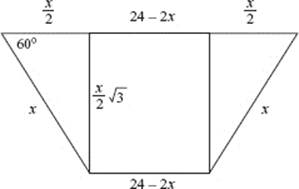
The volume of the trough (in in.3) is given by
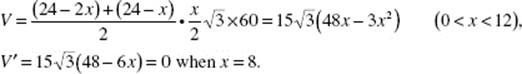
Since ![]() the maximum volume is attained by folding the metal 8 inches from tne edges.
the maximum volume is attained by folding the metal 8 inches from tne edges.
12. (a) Both π/4 and the expression in brackets yield 0.7853981634, which is accurate to ten decimal places.
(b) 
(c) ![]() this agrees with the value of
this agrees with the value of ![]() to four decimal places.
to four decimal places.
(d) The series
![]()
converges very slowly. Example 56 evaluated the sum of 60 terms of the series for π (which equals 4 tan−1 1). To four decimal places, we get π = 3.1249, which yields 0.7812 for π/4—not accurate even to two decimal places.
13. (a) The given series is alternating. Since ![]()
Since ln x is an increasing function,
![]()
The series therefore converges.
(b) Since the series converges by the Alternating Series Test, the error in using the first n terms for the sum of the whole series is less than the absolute value of the (n + 1)st term. Thus the error is less than ![]() Solve for n using
Solve for n using ![]()
The given series converges very slowly!
(c) The series ![]() is conditionally convergent. The given alternating series converges since the nth term approaches 0 and
is conditionally convergent. The given alternating series converges since the nth term approaches 0 and ![]() However, the nonnegative series diverges by the Integral Test, since
However, the nonnegative series diverges by the Integral Test, since
![]()
14. (a) Solve by separation of variables:
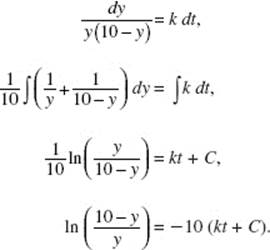
Let c = e−10c; then
![]()
Now use initial condition y = 2 at t = 0:
![]()
and the other condition, y = 5 at t = 2, gives
![]()
(b) Since c = 4 and ![]()
Solving for y yields ![]()
(c) ![]() means 1 + 4 · 2−t = 1.25, so t = 4.
means 1 + 4 · 2−t = 1.25, so t = 4.
(d) ![]() so the value of y approaches 10.
so the value of y approaches 10.
15. (a) Since ![]() Since y = 18 − 2 · 22 = 10, P is at (2,10).
Since y = 18 − 2 · 22 = 10, P is at (2,10).
(b) Since ![]() Since
Since ![]() Therefore
Therefore
![]()
(c) Let D = the object’s distance from the origin. Then
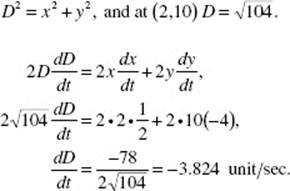
(d) The object hits the x-axis when y = 18 − 2x2 = 0, or x = 3. Since ![]()
(e) The length of the arc of y = 18 − 2x2 for 0 ≤ x ≤ 3 is given by
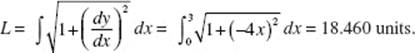
16. (a) See graph.
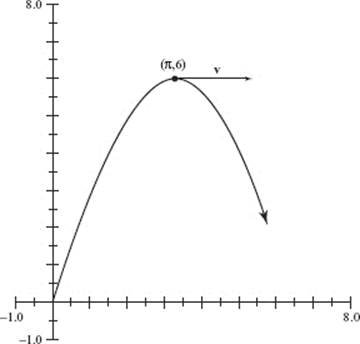
(b) You want to maximize ![]()
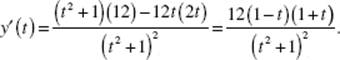
See signs analysis.
![]()
The maximum y occurs when t = 1, because y changes from increasing to decreasing there.
(c) Since x(1) = 4arctan 1 = π and ![]() the coordinates of the highest point are (π,6).
the coordinates of the highest point are (π,6).
Since  This vector is shown on the graph.
(d) ![]() Thus the particle approaches the point (2π,0).
Thus the particle approaches the point (2π,0).
17. (a) To find the smallest rectangle with sides parallel to the x- and y-axes, you need a rectangle formed by vertical and horizontal tangents as shown in the figure. The vertical tangents are at the x-intercepts, x = ±3. The horizontal tangents are at the points where y (not r) is a maximum. You need, therefore, to maximize
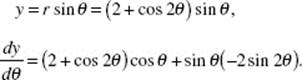
Use the calculator to find that ![]() when θ = 0.7854. Therefore, y = 1.414, so the desired rectangle has dimensions 6 × 2.828.
when θ = 0.7854. Therefore, y = 1.414, so the desired rectangle has dimensions 6 × 2.828.
(b) Since the polar formula for the area is ![]() the area of R (enclosed by r) is
the area of R (enclosed by r) is ![]() which is 14.137.
which is 14.137.
Part B
18. The graph shown below satisfies all five conditions. So do many others!
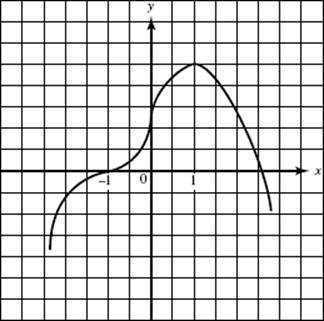
19. (a) f′ is defined for all x in the interval. Since f is therefore differentiable, it must also be continuous.
(b) Because f′ (2) = 0 and f′ changes from negative to positive there, f has a relative minimum at x = 2. To the left of x = 9, f′ is negative, so f is decreasing as it approaches that endpoint and reaches another relative minimum there.
(c) Because f′ is negative to the right of x = −3, f decreases from its left end-point, indicating a relative max there. Also, f′ (2) = 0 and f′ changes from positive to negative there, so f has a relative minimum at x = 7.
(d) Note that f (7) − f (−3) = ![]() Since there is more area above the x-axis than below the x-axis on [−3,7], the integral is positive and f (7) − f (−3) > 0. This implies that f (7) > f (−3), and that the absolute maximum occurs at x = 7.
Since there is more area above the x-axis than below the x-axis on [−3,7], the integral is positive and f (7) − f (−3) > 0. This implies that f (7) > f (−3), and that the absolute maximum occurs at x = 7.
(e) At x = 2 and also at x = 6, f′ changes from increasing to decreasing, indicating that f changes from concave upward to concave downward at each. At x = 4, f′ changes from decreasing to increasing, indicating that f changes from concave downward to concave upward there. Hence the graph of f has points of inflection at x = 2, 4, and 6.
20. Draw a sketch of the region bounded above by y1 = 8 − 2x2 and below by y2 = x2 − 4, and inscribe a rectangle in this region as described in the question. If (x, y1) and (x, y2) are the vertices of the rectangle in quadrants I and IV, respectively, then the area
A = 2x (y1 − y2) = 2x(12 − 3x2), or A(x) = 24x − 6x3.
Then A′ (x) = 24 − 18x2 = 6(4 − 3x2), which equals 0 when ![]() Check to verify that A ″ (x) < 0 at this point. This assures that this value of x yields maximum area, which is given by
Check to verify that A ″ (x) < 0 at this point. This assures that this value of x yields maximum area, which is given by ![]()
21. The graph of f ′(x) is shown here.
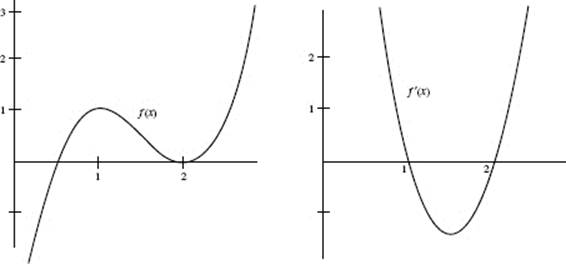
22. The rate of change in volume when the surface area is 54 ft3 is ![]() ft3 /sec.
ft3 /sec.
23. See the figure. The equation of the circle is x2 + y2 = a2; the equation of RS is y = a − x. If y2 is an ordinate of the circle and y1 of the line, then,
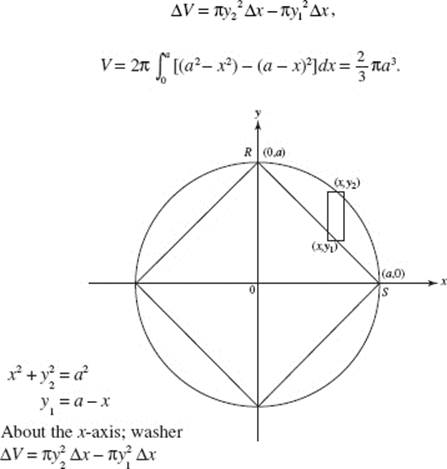
24. (a) The region is sketched in the figure. The pertinent points of intersection are labeled.
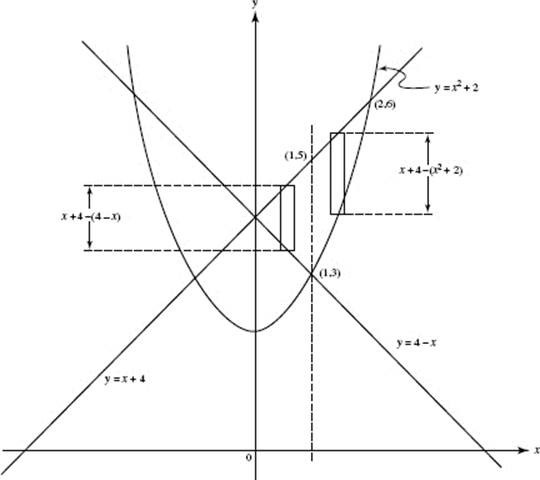
(b) The required area consists of two parts. The area of the triangle is represented by ![]() and is equal to 1, while the area of the region bounded at the left by x = 1, above by y = x + 4, and at the right by the parabola is represented by
and is equal to 1, while the area of the region bounded at the left by x = 1, above by y = x + 4, and at the right by the parabola is represented by ![]() This equals
This equals
![]()
The required area, thus, equals ![]()
25. (a) 1975 to 1976 and 1978 to 1980.
(b) 1975 to 1977 and 1979 to 1981.
(c) 1976 to 1977 and 1980 to 1981.
26. (a) Since ![]() then, separating variables,
then, separating variables, ![]() Integrating gives
Integrating gives
![]()
and, since v = 20 when t = 0, C = ln 20. Then (1) becomes ln ![]() or, solving for v,
or, solving for v,
![]()
(b) Note that v > 0 for all t. Let s be the required distance traveled (as v decreases from 20 to 5); then
![]()
where, when v = 20, t = 0. Also, when v = 5, use (2) to get ![]() or − ln 4 = −2t. So t = ln 2. Evaluating s in (3) gives
or − ln 4 = −2t. So t = ln 2. Evaluating s in (3) gives
![]()
27. Let (x,y) be the point in the first quadrant where the line parallel to the x-axis meets the parabola. The area of the triangle is given by
A = xy = x(27 − x2) = 27x − x3 for 0 ≤ x ≤ ![]()
Then A′ (x) = 27 − 3x2 = 3(3 + x)(3 − x), and A′ (x) = 0 at x = 3.
Since A′ changes from positive to negative at x = 3, the area reaches its maximum there.
The maximum area is A(3) = 3(27 − 32) = 54.
28. 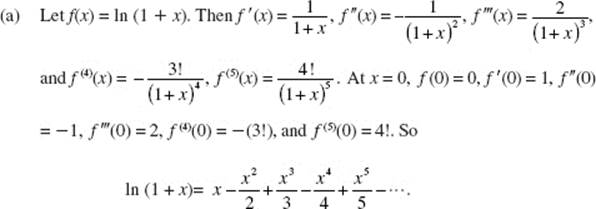
(b) Using the Ratio Test, you know that the series converges when ![]() that is, when |x| < 1, or −1 < x < 1. Thus, the radius of convergence is 1.
that is, when |x| < 1, or −1 < x < 1. Thus, the radius of convergence is 1.
(c) ![]()
(d) Since the series converges by the Alternating Series Test, the error in the answer for (c) is less absolutely than ![]()
29. From the equations for x and y,
dx = (1 − cos θ) dθ and dy = sin θ dθ.
(a) The slope at any point is given by ![]() which here is
which here is ![]() When
When ![]()
(b) When ![]() The equation of the tangent is
The equation of the tangent is ![]()
30. Both curves are circles with centers at, respectively, (2,0) and ![]() the circles intersect at
the circles intersect at ![]() The common area is given by
The common area is given by
![]()
The answer is 2(π − 2).
31. (a) For f (x) = cos x, f′ (x) = −sin x, f ″ (x) = −cos x, f ′″(x) = sin x, f(4) (x) = cos x, f(5) (x) = −sin x, f(6) (x) = −cos x. The Taylor polynomial of order 4 about 0 is
![]()
Note that the next term of the alternating Maclaurin series for cos x is ![]()
(b) ![]()
(c) The error in (b), convergent by the Alternating Series Test, is less absolutely than the first term dropped:
![]()
32. (a) Since ![]() y = 2t + 1 and x = 4t3 + 6t + 3t.
y = 2t + 1 and x = 4t3 + 6t + 3t.
(b) Since ![]() then, when t = 1, |a| = 36.
then, when t = 1, |a| = 36.
33. See the figure. The required area A is twice the sum of the following areas: that of the limaçon from 0 to ![]() and that of the circle from
and that of the circle from ![]() Thus
Thus
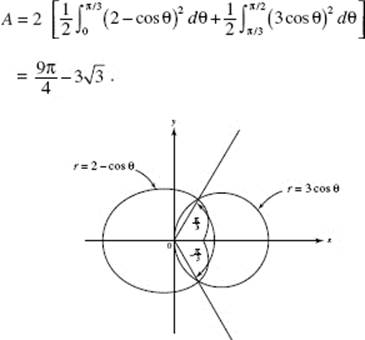
Answers Explained
Multiple-Choice
Part A
1. (C) Use the Rational Function Theorem.
2. (C) Note that ![]() where f (x) = ln x.
where f (x) = ln x.
3. (B) Since y ′ = −2xe−x2, therefore y ″ = −2(x · e −x2 · (−2x) + e −x2). Replace x by 0.
4. (B) ![]()
5. (B) h ′(3) = g ′(f (3)) · f ′(3) = g ′(4) · ![]()
6. (E) Since f ′(x) exists for all x, it must equal 0 for any x0 for which f is a relative maximum, and it must also change sign from positive to negative as x increases through x0. For the given derivative, no x satisfies both of these conditions.
7. (E) By the Quotient Rule (formula (6)),
![]()
8. (A) Here, f ′(x) is e −x (1 − x); f has maximum value when x = 1.
9. (A) Note that (1) on a horizontal line the slope segments are all parallel, so the slopes there are all the same and ![]() must depend only on y; (2) along the x-axis (where y = 0) the slopes are infinite; and (3) as y increases, the slope decreases.
must depend only on y; (2) along the x-axis (where y = 0) the slopes are infinite; and (3) as y increases, the slope decreases.
10. (E) Acceleration is the derivative (the slope) of velocity v; v is largest on 8 < t < 9.
11. (C) Velocity v is the derivative of position; because v > 0 until t = 6 and v < 0 thereafter, the position increases until t = 6 and then decreases; since the area bounded by the curve above the axis is larger than the area below the axis, the object is farthest from its starting point at t = 6.
12. (D) From t = 5 to t = 8, the displacement (the integral of velocity) can be found by evaluating definite integrals based on the areas of two triangles:
![]() Thus, if K is the object’s position at t = 5, then K − 3 = 10 at t = 8.
Thus, if K is the object’s position at t = 5, then K − 3 = 10 at t = 8.
13. (A) The integral is of the form ![]() evaluate
evaluate ![]()
14. (E) ![]()
15. (D) ![]()
16. (A) f (x) = e −x is decreasing and concave upward.
17. (B) Implicit differentiation yields 2yy ′ = 1; so ![]() At a vertical tangent,
At a vertical tangent, ![]() is undefined; y must therefore equal 0 and the numerator be non-zero. The original equation with y = 0 is 0 = x − x3, which has three solutions.
is undefined; y must therefore equal 0 and the numerator be non-zero. The original equation with y = 0 is 0 = x − x3, which has three solutions.
18. (B) Let t = x − 1; then t = −1 when x = 0, t = 5 when x = 6, and dt = dx.
19. (B) The required area, A, is given by the integral
![]()
20. (B) The average value is ![]() The definite integral represents the sum of the areas of a trapezoid and a rectangle:
The definite integral represents the sum of the areas of a trapezoid and a rectangle: ![]() (8 + 3)(6) = 4(7) = 61.
(8 + 3)(6) = 4(7) = 61.
21. (A) Solve the differential equation ![]() by separation of variables:
by separation of variables: ![]() yields y = ce2x. The initial condition yields 1 = ce2 · 2; so c = e −4 and y = e2x−4.
yields y = ce2x. The initial condition yields 1 = ce2 · 2; so c = e −4 and y = e2x−4.
22. (C) Changes in values of f ″ show that f ″′ is constant; hence f ″ is linear, f ′ is quadratic, and f must be cubic.
23. (B) By implicit differentiation, ![]() so the equation of the tangent line at (3,0) is y = −9(x−3).
so the equation of the tangent line at (3,0) is y = −9(x−3).
24. (A) ![]()
25. (D) The graph shown has the x-axis as a horizontal asymptote.
26. (B) Since ![]() to render f (x) continuous at x = 1 f (1) must be defined to be 1.
to render f (x) continuous at x = 1 f (1) must be defined to be 1.
27. (B) f ′(x) = 15x4 − 30x2; f ″(x) = 60x3 − 60x = 60x(x + 1)(x − 1); this equals 0 when x = −1, 0, or 1. Here are the signs within the intervals:
![]()
The graph of f changes concavity at x = −1, 0, and 1.
28. (C) Note that ![]() so f has a critical value at x = −4. As x passes through −4, the sign of f ′ changes from − to +, so f has a local minimum at x = −4.
so f has a critical value at x = −4. As x passes through −4, the sign of f ′ changes from − to +, so f has a local minimum at x = −4.
Part B
29. (B) We are given that (1) f ′(a) > 0; (2)f ″(a) < 0; and (3) G ′(a) < 0. Since G ′(x) = 2 f (x) · f ′(x), therefore G ′(a) = 2f (a) · f (a). Conditions (1) and (3) imply that (4)f (a) < 0. Since G ″(x) = 2[f (x) · f ″ (x) + (f ′(x))2], therefore G″(a) = 2[f (a)f ″ (a) + (f′ (a))2]. Then the sign of G ″(a) is 2[(−) · (−) + (+)] or positive, where the minus signs in the parentheses follow from conditions (4) and (2).
30. (E) Since ![]() it equals 0 for
it equals 0 for ![]() When x = 3, c = 9; this yields a minimum since f ″(3) > 0.
When x = 3, c = 9; this yields a minimum since f ″(3) > 0.
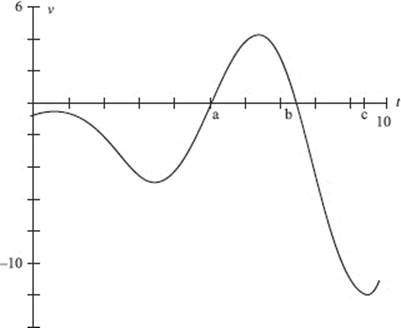
31. (E) Use your calculator to graph velocity against time. Speed is the absolute value of velocity. The greatest deviation from v = 0 is at t = c. With a calculator, c = 9.538.
32. (D) Because f ′ changes from increasing to decreasing, f ″ changes from positive to negative and thus the graph of f changes concavity.
33. (D) ![]() We evaluate this definite integral by finding the area of a trapezoid (negative) and a triangle:
We evaluate this definite integral by finding the area of a trapezoid (negative) and a triangle: ![]() so the tangent line passes through the point (3,−2). The slope of the line is H ′(3) = f (3) = 2, so an equation of the line is y − (−2) = 2(x − 3).
so the tangent line passes through the point (3,−2). The slope of the line is H ′(3) = f (3) = 2, so an equation of the line is y − (−2) = 2(x − 3).
34. (D) The distance is approximately 14(6) + 8(2) + 3(4).
35. (D) ![]() R(x)dx = 166.396.
R(x)dx = 166.396.
36. (A) Selecting an answer for this question from your calculator graph is unwise. In some windows the graph may appear continuous; in others there may seem to be cusps, or a vertical asymptote. Put the calculator aside. Find
![]()
These limits indicate the presence of a jump discontinuity in the function at x = 1.
37. (D) ![]()
![]()
38. (E) ![]()

39. (E) In the figure above, S is the region bounded by y = sec x, the y axis, and y = 4. Send region S about the x-axis. Use washers; then ΔV = π(R2 − r2) Δx. Symmetry allows you to double the volume generated by the first quadrant of S, so V is
![]()
A calculator yields 108.177.
40. (A) The curve falls when f ′(x) < 0 and is concave up when f ″(x) > 0.
41. (B) ![]() To find g ′(0), find x such that f (x) = 0. By inspection,
To find g ′(0), find x such that f (x) = 0. By inspection, ![]()
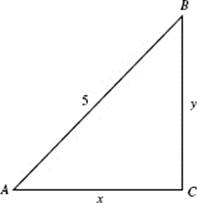
42. (D) It is given that ![]() you want
you want ![]() where
where ![]()
![]()
Since y2 = 25 −x2, it follows that ![]() and, when x = 3, y = 4
and, when x = 3, y = 4
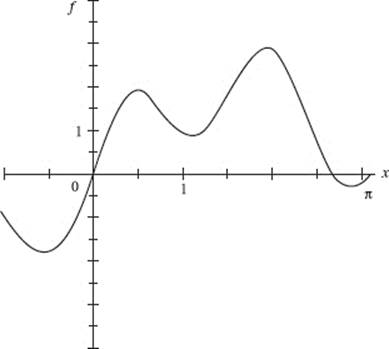
The function f (x) = 2 sin x + sin 4x is graphed above.
43. (E) Since f (0) = f (π) and f is both continuous and differentiable, Rolle’s Theorem predicts at least one c in the interval such that f ′(c) = 0.
There are four points in [0,π] of the calculator graph above where the tangent is horizontal.
44. (B) Since ![]() a positive constant,
a positive constant, ![]() where c is a positive constant. Then
where c is a positive constant. Then ![]() which is also positive.
which is also positive.
45. (C) If Q(t) is the amount of contaminant in the tank at time t and Q0 is the initial amount, then
![]() = kQ and Q(t) = Q0 ekt.
= kQ and Q(t) = Q0 ekt.
Since Q(1) = 0.8Q0, 0.8Q0 = Q0ek · 1, 0.8 = ek, and
Q(t) = Q0(0.8)t.
We seek t when Q(t) = 0.02Q0. Thus,
0.02Q0 = Q0(0.8)t
and
t ![]() 17.53 min.
17.53 min.
Free-Response
Part A
AB/BC 1. (a) This is the graph of f ′(x).
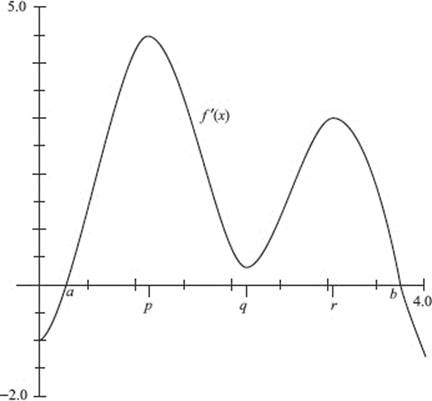
(b) f is increasing when f ′(x) > 0. The graph shows this to be true in the interval a < x < b. Use the calculator to find a and b (where ex − 2 cos 3x = 0); then a = 0.283 < x < 3.760 = b.
(c) See signs analysis.
![]()
Since f decreases to the right of endpoint x = 0, f has a local maximum at x = 0. There is another local maximum at x = 3.760, because f changes from increasing to decreasing there.
(d) See signs analysis.
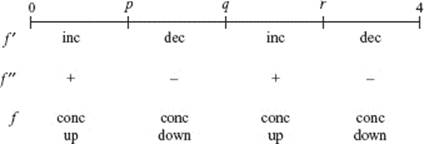
Since the graph of f changes concavity at p, q, and r, there are three points of inflection.
AB2. (a) Since April 1 is 3 months from January 1 and June 30 is 3 months later, we form the sum for the interval [3,6]:
![]()
We estimate the company sold 1051 software units during the second quarter.
(b) S(t) = 1.2(2)t/3
(c) ![]() The model’s estimate of 1039 sales is slightly lower, but the two are in close agreement.
The model’s estimate of 1039 sales is slightly lower, but the two are in close agreement.
(d) ![]() the model predicts an average sales rate of 649.2 units per month from January 1, 2012, through December 31, 2012.
the model predicts an average sales rate of 649.2 units per month from January 1, 2012, through December 31, 2012.
Part B
AB 3. (a) At (2,5), ![]() so the tangent line is y − 5 = 4(x − 2).
so the tangent line is y − 5 = 4(x − 2).
Solving for y yields f (x) ≈ 5 + 4(x − 2).
(b) f (2.1) ≈ 5 + 4(2.1 − 2) = 5.4.
(c) The differential equation ![]() is separable:
is separable:
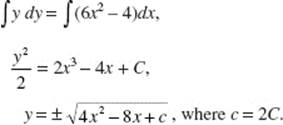
Since f passes through (2,5), it must be true that ![]()
Thus c = 9, and the positive root is used.
The solution is ![]()
(d) ![]()
AB 4. (a) Draw a vertical element of area, as shown.
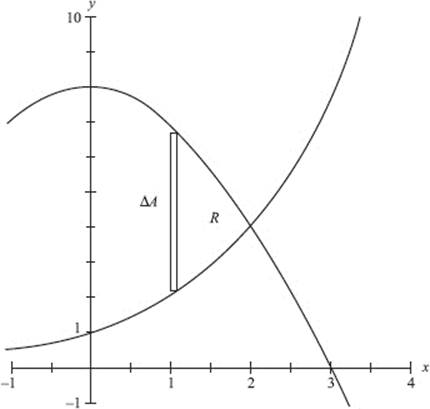
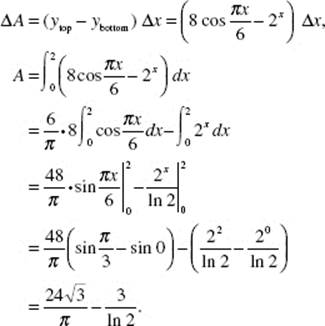
(b) (i) Use washers; then
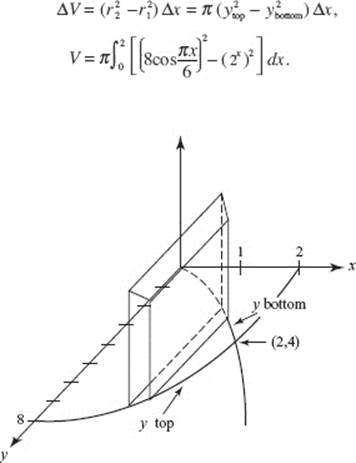
(ii) See the figure above.
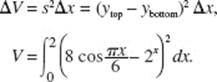
AB/BC 5. 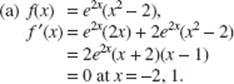
f is decreasing where f ′(x) < 0, which occurs for −2 < x < 1.
(b) f is decreasing on the interval −2 < x < 1, so there is a minimum at (1, −e2). Note that, as x approaches ±∞, f (x) = e2x(x2 − 2) is always positive. Hence (1,−e2) is the global minimum.
(c) As x approaches +∞, f (x) = e2x(x2 − 2) also approaches +∞. There is no global maximum.
AB/BC 6. (a) S = 4πr2, so ![]() Substitute given values; then
Substitute given values; then
![]()
Since ![]() therefore
therefore ![]() Substituting known values
Substituting known values
gives ![]()
(b) Regions of consistent density are concentric spherical shells. The volume of each shell is approximated by its surface area (4πx2) times its thickness (Δx). The weight of each shell is its density times its volume (g/cm3 · cm3). If, when the snowball is 12 cm in diameter, ΔG is the weight of a spherical shell x cm from the center, then ![]() and the integral to find the weight of the snowball is
and the integral to find the weight of the snowball is
![]()
Answers Explained
Multiple-Choice
Part A
1. (E) ![]()
2. (A) Divide both numerator and denominator by 
3. (E) Since eln u = u, y = 1.
4. (D) f (0) = 3, and, ![]()
5. (B) ![]()
6. (D) Here y ′ = 3 sin2 (1 − 2x) cos (1 − 2x) · (−2).
7. (B) ![]()
8. (B) Let s be the distance from the origin: then
Since ![]()
9. (B) For ![]() this limit represents f ′(25).
this limit represents f ′(25).
10. (B) ![]() This definite integral represents the area of a quadrant of the circle x2 + y2 = 1, hence
This definite integral represents the area of a quadrant of the circle x2 + y2 = 1, hence ![]()
11. (C) ![]()
12. (A) The integral is rewritten as
13. (B) ![]()
14. (D) Note:
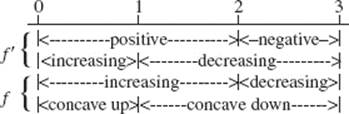
15. (B) The winning times are positive, decreasing, and concave upward.
16. (E) G(x) = H(x) + ![]() represents the area of a trapezoid.
represents the area of a trapezoid.
17. (C) f ′(x) = 0 for x = 1 and f ″(1) > 0.
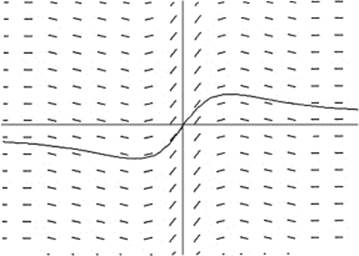
18. (B) Solution curves appear to represent odd functions with a horizontal asymptote. In the figure above, the curve in (B) of the question has been superimposed on the slope field.
19. (B) Note that
![]()
20. (C) v is not differentiable at t = 3 or t = 5.
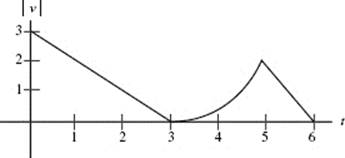
21. (B) Speed is the magnitude of velocity; its graph is shown in the answer explanation for question 20.
22. (B) The average rate of change of velocity is ![]()
23. (E) The curve has vertical asymptotes at x = 2 and x = −2 and a horizontal asymptote at y = −2.
24. (E) The function is not defined at x = −2; ![]() Defining f (−2) = 4 will make f continuous at x = −2, but f will still be discontinuous at x = 1.
Defining f (−2) = 4 will make f continuous at x = −2, but f will still be discontinuous at x = 1.
25. (B) 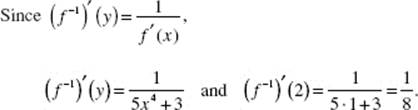
26. (A) 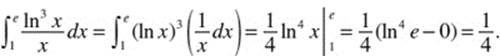
27. (E) ln (4 + x2) = ln (4 + (−x)2); y ′ ![]()
28. (A) f (x) = ![]() (x sin πx) = πx cos πx + sin πx.
(x sin πx) = πx cos πx + sin πx.
Part B
29. (B) See the figure below. A = ![]()
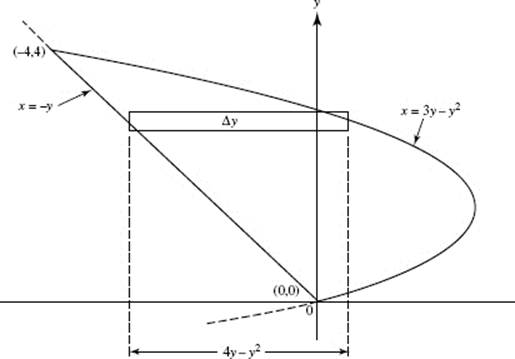
30. (C) See the figure below. About the x-axis: Washer. ΔV = π(y2 − 12) Δx,
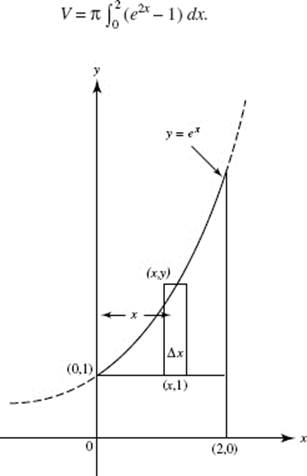
31. (E) We solve the differential equation ![]() by separation:
by separation:
If s = 1 when t = 0, we have C = 1; hence, ![]() when t = 1.
when t = 1.
32. (D) 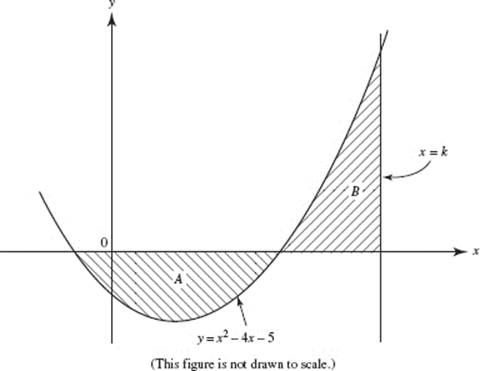
The roots of f (x) = x2 − 4x − 5 = (x − 5)(x + 1) are x = −1 and 5. Since areas A and B are equal, therefore ![]() Thus,
Thus,
Solving on a calculator gives k (or x) equal to 8.
33. (D) If N is the number of bacteria at time t, then N = 200ekt. It is given that 3 = e10k. When t = 24, N = 200e24k. Therefore N = 200(e10k)2.4 = 200(3)2.4 ![]() 2793 bacteria.
2793 bacteria.
34. (C) Since ![]() For x = 2t − 1, t = 3 yields x = 5 and t = 5 yields x = 9.
For x = 2t − 1, t = 3 yields x = 5 and t = 5 yields x = 9.
35. (C) Using implicit differentiation on the equation
x3 + xy − y2 = 10
yields
The tangent is vertical when ![]() is undefined; that is, when 2y − x = 0.
is undefined; that is, when 2y − x = 0.
Replacing y by ![]() in (1) gives
in (1) gives
![]()
or
4x3 + x2 = 40.
Let y1 = 4x3 + x2 − 40. Inspection of the equation y1 = f (x) = 0 reveals that there is a root near x = 2. Solving on a calculator yields x = 2.074.
36. (D) G ′(x) = f (3x − 1) · 3.
37. (B) Since f changes from positive to negative at t = 3, G ′ does also where 3x − 1 = 3.
38. (D) Using your calculator, evaluate y ′(2).
39. (E) 2(3) + 2(0) + 2(4) + 2(1).
See the figure above.
40. (E) 
At x = 3, the answer is 2[2(−2) + 52] = 42.
41. (A) The object is at rest when v(t) = ln(2 − t2) = 0; that occurs when 2−t2 = 1, so t = 1. The acceleration is ![]()
42. (D) 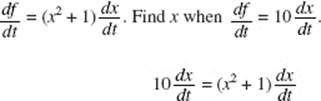
implies that x = 3.
43. (C) ![]() represents the rate of change of the surface area; if y is inversely proportional to x, then,
represents the rate of change of the surface area; if y is inversely proportional to x, then, ![]()
44. (E) The velocity functions are
v1 = −2t sin (t2 + 1)
and
![]()
Graph both functions in [0, 3] × [−5, 5]. The graphs intersect four times during the first 3 sec, as shown in the figure above.
45. (B) 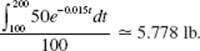
Free-Response
Part A
AB/BC1. 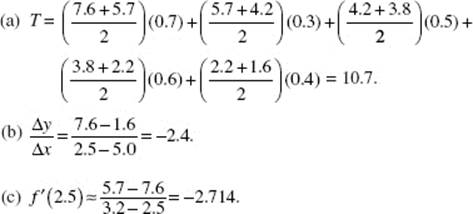
(d) To work with g(x) = f −1(x), interchange x and y:
|
x |
7.6 |
5.7 |
4.2 |
3.8 |
2.2 |
1.6 |
|
g(x) |
2.5 |
3.2 |
3.5 |
4.0 |
4.5 |
5.0 |
![]()
AB 2. Let M = the temperature of the milk at time t. Then
![]()
The differential equation is separable:
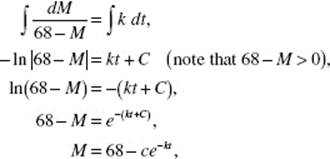
where c = e −C.
Find c, using the fact that M = 40° when t = 0:
40 = 68−ce0 means c = 28.
Find k, using the fact that M = 43° when t = 3:
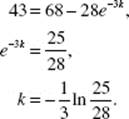
Hence ![]()
Now find t when M = 60°:
Since the phone rang at t = 3, you have 30 min to solve the problem.
Part B
AB 3. (a) 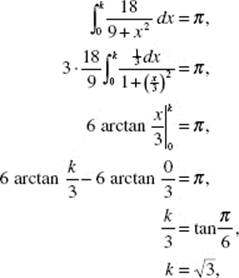
See the figure.
(b) The average value of a function on an interval is the area under the graph of the function divided by the interval width, here ![]()
(c) From part (a) you know that the area of the region is given by ![]() Since
Since ![]() as k increases the area of the region approaches 3π.
as k increases the area of the region approaches 3π.
AB/BC 4. (a) The rectangular slices have base y, height 5y, and thickness along the x-axis:
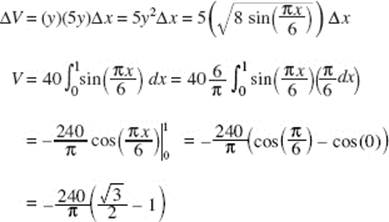
(b) The disks have radius x and thickness along the y-axis:
![]()
Now we solve for x in terms of y:
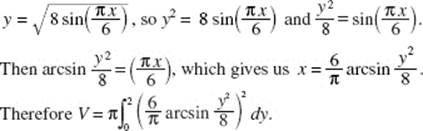
(NOTE: Although the shells method is not a required AP topic, another correct integral for this volume is ![]()
AB/BC 5. (a) The volume of the cord is V = πr2h. Differentiate with respect to time, then substitute known values. (Be sure to use consistent units; here, all measurements have been converted to inches.)
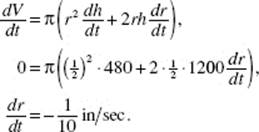
(b) Let ![]() represent the angle of elevation and h the height, as shown.
represent the angle of elevation and h the height, as shown.
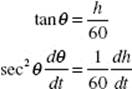
When h = 80, your distance to the jumper is 100 ft, as shown.
Then
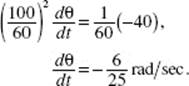
AB/BC 6. (a) ![]() the negative of the area of the shaded rectangle in the figure. Hence F(−2) = − (3)(2) = −6.
the negative of the area of the shaded rectangle in the figure. Hence F(−2) = − (3)(2) = −6.
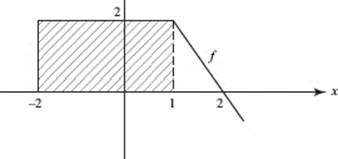
![]() is represented by the shaded triangles in the figure.
is represented by the shaded triangles in the figure.
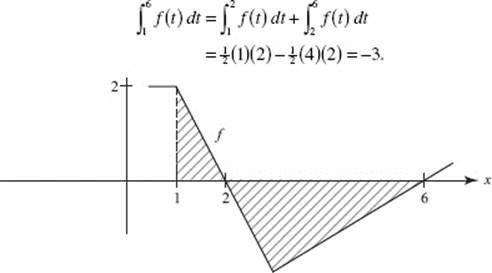
(b) ![]() so F(x) = 0 at x = 1.
so F(x) = 0 at x = 1. ![]() because the regions above and below the x-axis have the same area. Hence F(x) = 0 at x = 3.
because the regions above and below the x-axis have the same area. Hence F(x) = 0 at x = 3.
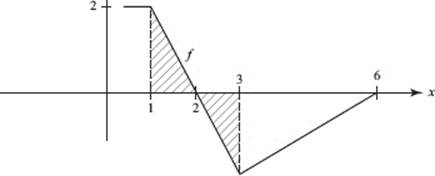
(c) F is increasing where F ′ = f is positive: −2 ≤ x ≤ 2.
(d) The maximum value of F occurs at x = 2, where F ′ = f changes from positive to negative. ![]()
The minimum value of F must occur at one of the endpoints. Since F(−2) = − 6 and F(6) = −3, the minimum is at x = −2.
(e) F has points of inflection where F ″ changes sign, as occurs where F ′ = f goes from decreasing to increasing, at x = 3.
Answers Explained
Multiple-Choice
Part A
1. (E) Here, ![]()
2. (C) The given limit equals ![]() where f (x) = sin x.
where f (x) = sin x.
3. (C) Since f (x) = x ln x,
f ′(x) = 1 + ln x, ![]()
4. (A) Differentiate implicitly to get ![]() Substitute (−1, 1) to find
Substitute (−1, 1) to find ![]() the slope at this point, and write the equation of the tangent: y − 1 = −1(x + 1).
the slope at this point, and write the equation of the tangent: y − 1 = −1(x + 1).
5. (C) f ′(x) = 4x3 − 12x2 + 8x = 4x(x − 1)(x − 2). To determine the signs of f ′(x), inspect the sign at any point in each of the intervals x < 0, 0 < x < 1, 1 < x < 2, and x > 2. The function increases whenever f ′(x) > 0.
6. (C) The integral is equivalent to ![]() where u = 4 + 2sinx.
where u = 4 + 2sinx.
7. (D) Here ![]() which is zero for x = e. Since the sign of y ′ changes from positive to negative as x increases through e, this critical value yields a relative maximum. Note that
which is zero for x = e. Since the sign of y ′ changes from positive to negative as x increases through e, this critical value yields a relative maximum. Note that ![]()
8. (E) Since ![]() is always positive, there are no reversals in motion along the line.
is always positive, there are no reversals in motion along the line.
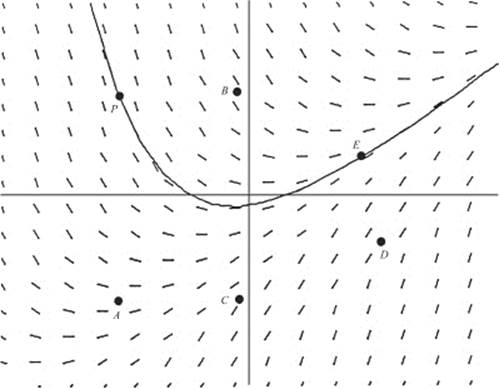
9. (E) The slope field suggests the curve shown above as a particular solution.
10. (E) Since ![]() is discontinuous at x = 1; the domain of F is therefore x > 1. On [2, 5] f (x) < 0, so
is discontinuous at x = 1; the domain of F is therefore x > 1. On [2, 5] f (x) < 0, so ![]() which is positive for x > 1.
which is positive for x > 1.
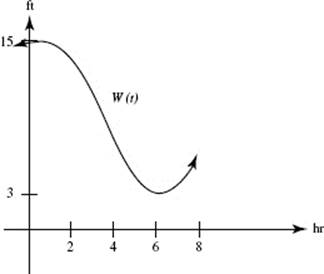
11. (B) In the graph above, W(t), the water level at time t, is a cosine function with amplitude 6 ft and period 12hr:
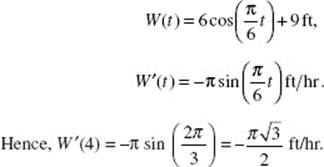
12. (B) Solve the differential equation ![]() Use x = −1,
Use x = −1,
y = 2 to determine ![]()
13. (D) ![]()
14. (A) ![]()
15. (C) G ′(2) = 4, so G (x) ![]() 4(x − 2) + 5.
4(x − 2) + 5.
16. (E) ![]() See the figure below.
See the figure below.
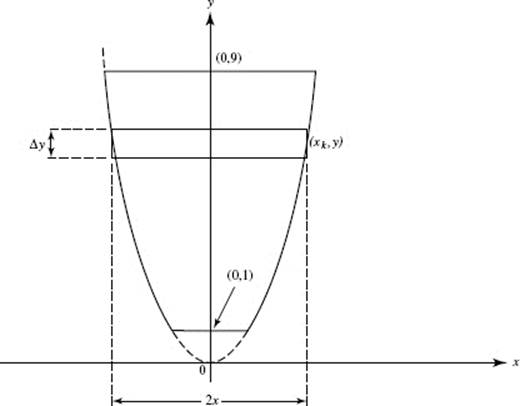
17. (E) Note that ![]()
18. (B) Note that (0, 0) is on the graph, as are (1, 2) and (−1, −2). So only (B) and (E) are possible. Since ![]() only (B) is correct.
only (B) is correct.
19. (D) See the figure.
20. (E) ![]()
21. (D) In (D), f (x) is not defined at x = 0. Verify that each of the other functions satisfies both conditions of the Mean Value Theorem.
22. (E) The signs within the intervals bounded by the critical points are given below.
![]()
Since f changes from increasing to decreasing at x = −3, f has a local maximum at −3. Also, f has a local minimum at x = 0, because it is decreasing to the left of zero and increasing to the right.
23. (B) Since ln ![]() then
then
![]()
24. (D) ![]()
25. (B) As seen from the figure, ![]() where y = 2r,
where y = 2r,
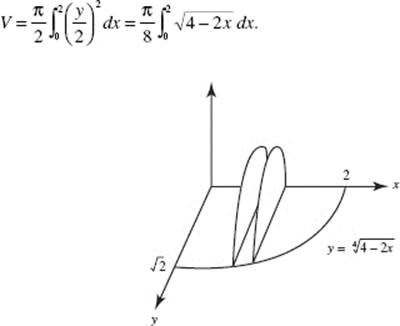
26. (C) From the figure below, 
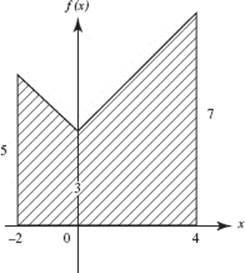
27. (A) Since the degrees of numerator and denominator are the same, the limit as x→∞ is the ratio of the coefficients of the terms of highest degree: ![]()
28. (A) We see from the figure that ΔA = (y2 − y1) Δx;
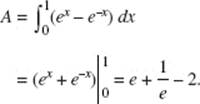
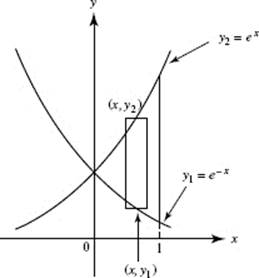
Part B
29. (A) Let u = x2 + 2. Then
![]()
and
![]()
30. (E) ![]() will increase above the half-full level (that is, the height of the water will rise more rapidly) as the area of the cross section diminishes.
will increase above the half-full level (that is, the height of the water will rise more rapidly) as the area of the cross section diminishes.
31. (B) Since ![]()
32. (C) 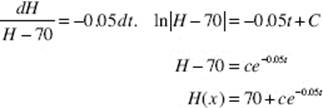
The initial condition H(0) = 120 shows c = 50. Evaluate H(10).
33. (B) Let P be the amount after t years. It is given that ![]() The solution of this differential equation is P = 4000e0.08t + C, where P (0) = 4000 yields C = 0. The answer is 4000e(0.08) ·10.
The solution of this differential equation is P = 4000e0.08t + C, where P (0) = 4000 yields C = 0. The answer is 4000e(0.08) ·10.
34. (C) The inverse of y = 1 + ex is x = 1 + ey or y = ln (x − 1); (x − 1) must be positive.
35. (E) Speed is the magnitude of velocity: |v(8)| = 4.
36. (E) For 3 < t < 6 the object travels to the right ![]() At t = 7 it has returned 1 unit to the left; by t = 8, 4 units to the left.
At t = 7 it has returned 1 unit to the left; by t = 8, 4 units to the left.
37. (C) Use disks: ΔV = πr2Δy = πx2Δy, where x = ln y. Use your calculator to evaluate ![]()
38. (B) If ![]() then u2 = x − 2, x = u2 + 2, dx = 2u du. When x = 3, u = 1; when x = 6, u = 2.
then u2 = x − 2, x = u2 + 2, dx = 2u du. When x = 3, u = 1; when x = 6, u = 2.
39. (A) The tangent line passes through points (8,1) and (0,3). Its slope, ![]() is f ′(8).
is f ′(8).
40. (A) Graph f ″ in [0,6] × [−5,10]. The sign of f ″ changes only at x = a, as seen in the figure.
41. (C) In the graph below, the first rectangle shows 2 tickets sold per minute for 15 min, or 30 tickets. Similarly, the total is 2(15) + 6(15) + 10(15) + 4(15).
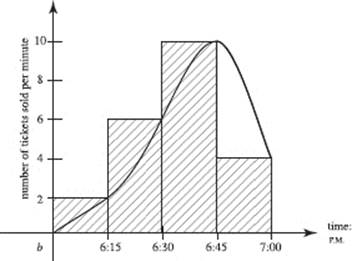
42. (B) Graph both functions in [−8,8] × [−5,5]. At point of intersection Q, both are decreasing. Tracing reveals x ![]() −4 at Q. If you zoom in on the curves at x = T, you will note that they do not actually intersect there.
−4 at Q. If you zoom in on the curves at x = T, you will note that they do not actually intersect there.
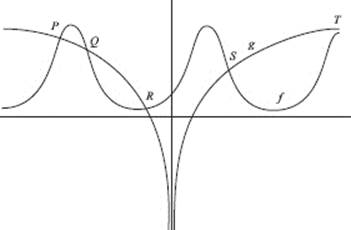
43. (D) Counterexamples are, respectively, for (A), f (x) = |x|, c = 0; for (B), f (x) = x3, c = 0; for (C), f (x) = x4, c = 0; for (E), f (x) = x2 on (−1, 1).
44. (E) f ′(x) > 0; the curve shows that f ′ is defined for all a < x < b, so f is differentiable and therefore continuous.
45. (D) Consider the blast area as a set of concentric rings; one is shown in the figure. The area of this ring, which represents the region x meters from the center of the blast, may be approximated by the area of the rectangle shown. Since the number of particles in the ring is the area times the density, ΔP = 2πx · Δx · N(x). To find the total number of fragments within 20 m of the point of the explosion, integrate: ![]()
Free-Response
Part A
AB1. (a) Since x2y − 3y2 = 48,
(b) At (5,3), ![]() so the equation of the tangent line is
so the equation of the tangent line is
![]()
(c) ![]()
(d) Horizontal tangent lines have ![]() This could happen only if
This could happen only if
2xy = 0, which means that x = 0 or y = 0.
If x = 0, 0y − 3y2 = 48, which has no real solutions.
If y = 0, x2 · 0 − 3 · 02 = 48, which is impossible. Therefore, there are no horizontal tangents.
AB/BC2. (a) 
(b) The average value of a function is the integral across the given interval divided by the interval width. Here  Estimate the value of the integral using trapezoid rule T with values from the table and Δt = 4:
Hence
Avg(W) ![]() 35.167 ft.
35.167 ft.
(c) For ![]() use your calculator to evaluate F ′(16) ≈ −0.749. After 16 hr, the river depth is dropping at the rate of 0.749 ft/hr.
use your calculator to evaluate F ′(16) ≈ −0.749. After 16 hr, the river depth is dropping at the rate of 0.749 ft/hr.
Part B
AB/BC 3. (a) 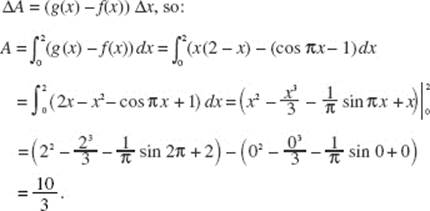
(b) Let h = the hypotenuse of an isosceles right triangle, as shown in the figure. Then each leg of the triangle is ![]() and its area is
and its area is ![]()
An element of volume is
![]()
and thus ![]()
AB/BC 4. (a) ![]() so v(0) = 0 and v(10) = 48.
so v(0) = 0 and v(10) = 48.
The average acceleration is ![]()
Acceleration ![]()
![]()
(b) Since Q’s acceleration, for all t in 0 ≤ t ≤ 5, is the slope of its velocity graph, ![]()
(c) Find the distance each auto has traveled. For P, the distance is
For auto Q, the distance is the total area of the triangle and trapezoid under the velocity graph shown below, namely,
Auto P won the race.
AB5. (a) Using the differential equation, evaluate the derivative at each point, then sketch a short segment having that slope. For example, at (−1, −1), ![]() = 2(−1)((−1)2 + 1) − 4; draw a steeply decreasing segment at (−1, −1). Repeat this process at each of the other points. The result follows.
= 2(−1)((−1)2 + 1) − 4; draw a steeply decreasing segment at (−1, −1). Repeat this process at each of the other points. The result follows.
(b) The differential equation ![]() is separable.
is separable.
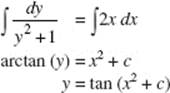
It is given that f passes through (0,1), so 1 = tan (02 + c) and ![]()
The solution is f(x) = tan ![]()
The particular solution must be differentiable on an interval containing the initial point (0,1). The tangent function has vertical asymptotes at ![]() hence:
hence:
![]() (Since x2 ≥ 0, we ignore the left inequality.)
(Since x2 ≥ 0, we ignore the left inequality.)

AB 6. (a) ![]() f (t)dt = F(2) = 4.
f (t)dt = F(2) = 4.
(b) One estimate might be ![]() f (t)dt F(7) − F(2) = 2 − 4 = −2.
f (t)dt F(7) − F(2) = 2 − 4 = −2.
(c) f (x) = F′ (x); F′ (x) = 0 at = 4.
(d) f ′(x) = F ″(x). F ″ is negative when F is concave downward, which is true for the entire interval 0 < x < 8.
(e) 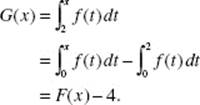
Then the graph of G is the graph of F translated downward 4 units.
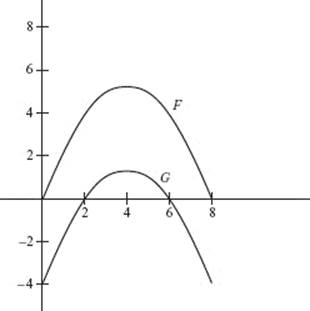
Answers Explained
The explanations for questions not given below will be found in the answer section for AB Practice Examination 1. Identical questions in Section I of Practice Examinations AB1 and BC1 have the same number. For example, explanations of the answers for Question 1, not given below, will be found in Section I of Calculus AB Practice Examination 1, Answer 1.
Multiple-Choice
Part A
3. (E) Here,
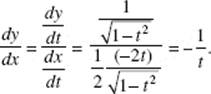
6. (D) ![]()
12. (B) Note that, when x = 2 sin θ, x2 = 4 sin2 θ, dx = 2 cos dθ, and ![]() 2 cos θ. Also,
2 cos θ. Also,
13. (C) The given integral is equivalent to ![]()
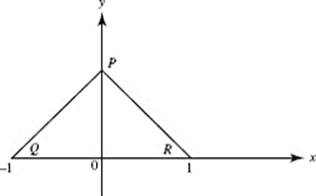
The figure shows the graph of f (x) = 1 − |x| on [−1,1].
The area of triangle PQR is equal to ![]()
14. (B) Let y = x1/x; then take logarithms. ln ![]() As x → ∞ the fraction is of the form ∞/∞.
As x → ∞ the fraction is of the form ∞/∞. ![]() So y → e0 or 1.
So y → e0 or 1.
17. (E) Separating variables yields ![]() so ln y = −ln cos x + C. With y = 3 when x = 0, C = ln 3. The general solution is therefore (cos x) y = 3. When
so ln y = −ln cos x + C. With y = 3 when x = 0, C = ln 3. The general solution is therefore (cos x) y = 3. When ![]()
![]() and y = 6.
and y = 6.
20. (A) Represent the coordinates parametrically as (r cos θ, r sin θ). Then
Note that ![]() sin 2θ, and evaluate
sin 2θ, and evaluate ![]() (Alternatively, write x = cos 2θ cos θ and y = cos 2θ sin θ to find
(Alternatively, write x = cos 2θ cos θ and y = cos 2θ sin θ to find ![]() )
)
21. (D) Note that v is negative from t = 0 to t = 1, but positive from t = 1 to t = 2. Thus the distance traveled is given by
![]()
22. (E) Separating variables yields y dy = (1 − 2x) dx. Integrating gives
![]()
24. (A) Use parts; then u = x, dv = cos x dx; du = dx,v = sin x. Thus,
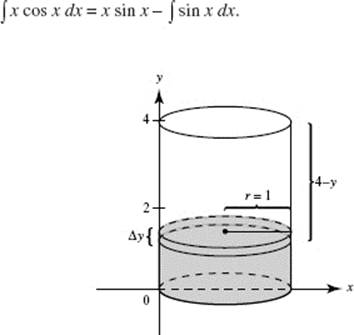
25. (C) Using the above figure, consider a thin slice of the oil, and the work Δw done in raising it to the top of the tank:
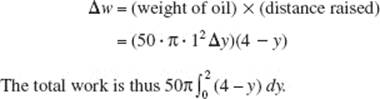
26. (A) By Taylor’s Theorem, the coefficient is ![]() For
For ![]() and
and ![]() making the coefficient
making the coefficient ![]()
27. (D) Here,
![]()
28. (D) Evaluate
![]()
Part B
29. (E) The vertical component of velocity is
![]() = 4 cos t + 12 cos 12t.
= 4 cos t + 12 cos 12t.
Evaluate at t = 1.
30. (B) At t = 0, we know H = 120, so 120 = 70 + ke −0.4(0), and thus k = 50. The average temperature for the first 10 minutes is ![]()
36. (B)
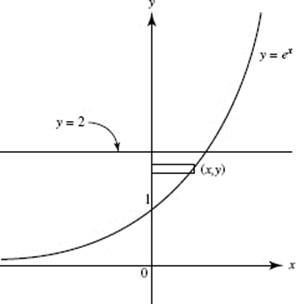
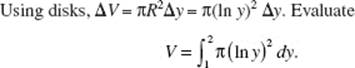
The required volume is 0.592.
38. (C) The Maclaurin expansion is
![]()
The Lagrange remainder R, after n terms, for some c in the interval |x| ![]() 2, is
2, is
![]()
Since R is greatest when c = 2, n needs to satisfy the inequality
![]()
Using a calculator to evaluate ![]() successively at various integral values of x gives y(8) > 0.01, y(9) > 0.002, y(10) < 3.8 × 10 −4 < 0.0004. Thus we achieve the desired accuracy with a Taylor polynomial at 0 of degree at least 10.
successively at various integral values of x gives y(8) > 0.01, y(9) > 0.002, y(10) < 3.8 × 10 −4 < 0.0004. Thus we achieve the desired accuracy with a Taylor polynomial at 0 of degree at least 10.
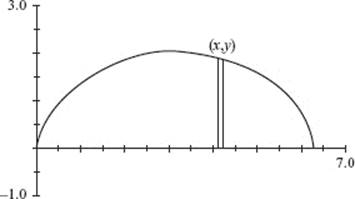
39. (E) On your calculator, graph one arch of the cycloid for t in [0, 2π] and (x,y) in [0, 7] × [−1, 3]. Use disks; then the desired volume is
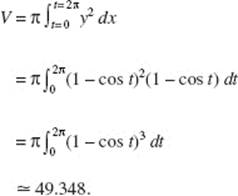
40. (C) In the first quadrant, both x and y must be positive; x(t) = et is positive for all t, but y(t) = 1 − t2 is positive only for −1 < t < 1. The arc length is
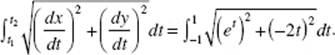
41. (D) Chapter 10.
44. (E) Each is essentially a p-series, ![]() Such a series converges only if p > 1.
Such a series converges only if p > 1.
Free-Response
Part A
1. See solution for AB-1, Free-Response in AB Practice Exam One.
2. See solution for AB2, Free-Response in AB Practice Exam One.
Part B
3. (a) Because ![]() which never equals zero, the object is never at rest.
which never equals zero, the object is never at rest.
(b) ![]() so the object’s speed is
so the object’s speed is
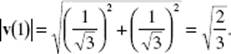
Position is the antiderivative of velocity 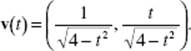
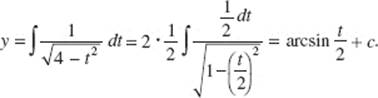
Since P(0) = (0,0), arcsin ![]() and thus c = 0.
and thus c = 0.
![]()
Since P(0) = (0,0), ![]() and thus c = 2.
and thus c = 2.
Then
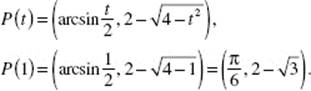
(c) Solving ![]() for t yields t = 2 sinx. Therefore
for t yields t = 2 sinx. Therefore
![]()
Since 0 ≤ t ≤ 1 means ![]() then cos x > 0, so y = 2 − 2cos x.
then cos x > 0, so y = 2 − 2cos x.
4. (a) To write the Maclaurin series for f (x) = ln(e+x), use Taylor’s theorem at x = 0.
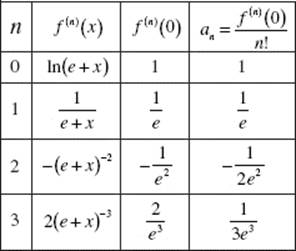
![]()
(b) By the Ratio Test, the series converges when
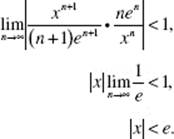
Thus, the radius of convergence is e.
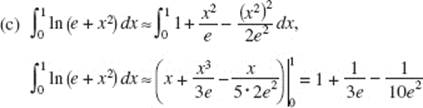
5. (a) To find the maximum rate of growth, first find the derivative of
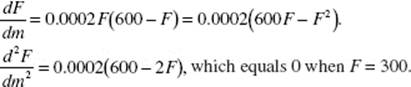
A signs analysis shows that ![]() changes from positive to negative there, confirming that
changes from positive to negative there, confirming that ![]() is at its maximum when there are 300 trout.
is at its maximum when there are 300 trout.
(b) The differential equation ![]() is separable.
is separable.
![]()
To integrate the left side of this equation, use the method of partial fractions.
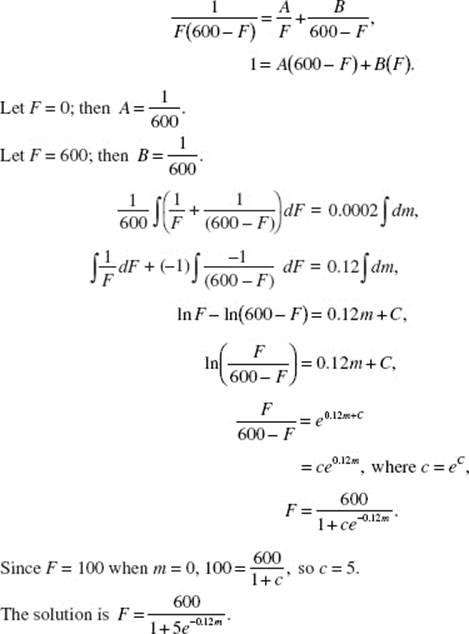
(c) In (a) the population was found to be growing the fastest when F = 300. Then:
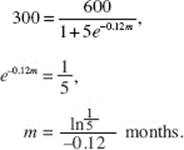
6. See solution for AB/BC 6, Free-Response in AB Practice Exam One.
Answers Explained
The explanations for questions not given below will be found in the answer section for AB Practice Exam 2. Identical questions in Section I of Practice Examinations AB2 and BC2 have the same number. For example, explanations of the answers for Questions 4 and 5, not given below, will be found in Section I of Calculus AB Practice Exam 2, Answers 4 and 5.
Multiple-Choice
Part A
1. (B) Since ![]() to render f (x) continuous at x = 1, define f (1) to be 1.
to render f (x) continuous at x = 1, define f (1) to be 1.
2. (C) Note that
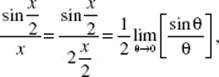
where you let ![]()
3. (C) Obtain the first few terms of the Maclaurin series generated by ![]()
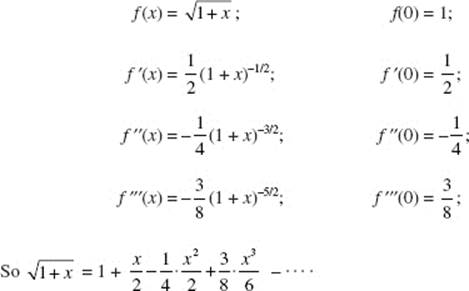
6. (C) Here,
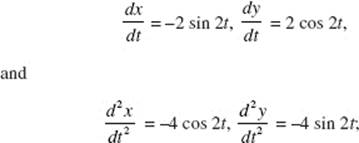
and the magnitude of the acceleration, |a|, is given by
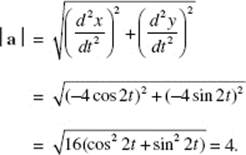
7. (B) ![]()
By the Ratio Test the series converges when
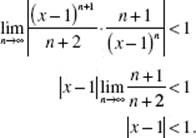
Checking the endpoints, we find:
![]() is the alternating harmonic series, which converges.
is the alternating harmonic series, which converges.
![]() is the harmonic series, which diverges.
is the harmonic series, which diverges.
Hence the interval of convergence is 0 ≤ x < 2.
10. (C) ![]()
11. (D) We integrate by parts using u = ln x, dv = dx; then ![]() v = x, and
v = x, and
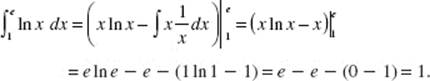
13. (C) Use the method of partial fractions, letting
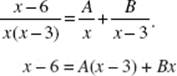
Letting x = 0, we find A = 2, and letting x = 3 yields B = −1.
Now ![]()
19. (E) At (2,1), ![]() Use Δx = 0.1; then Euler’s method moves to (2.1, 1 + 3(0.1)).
Use Δx = 0.1; then Euler’s method moves to (2.1, 1 + 3(0.1)).
At (2.1, 1.3), ![]() so the next point is (2.2, 1.3 + 3.4(0.1)).
so the next point is (2.2, 1.3 + 3.4(0.1)).
22. (D) Separate variables to get ![]() and integrate to get ln y = ln x + C.
and integrate to get ln y = ln x + C.
Since y = 3 when x = 1, C = ln 3. Then y = e(ln x + ln 3) = eln x · eln 3 = 3x.
23. (D) The generating circle has equation x2 + y2 = 4. Using disks, the volume, V, is given by
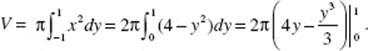
24. (C) ![]() The integrals in (A), (B), and (D) all diverge to infinity.
The integrals in (A), (B), and (D) all diverge to infinity.
26. (D) Using separation of variables:
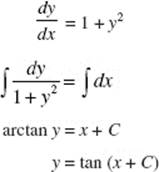
Given initial point (0,0), we have 0 = tan(0 + C); hence C = 0 and the particular solution is y = tan(x).
Because this function has vertical asymptotes at ![]() and the particular solution must be differentiable in an interval containing the initial point x = 0, the domain is
and the particular solution must be differentiable in an interval containing the initial point x = 0, the domain is ![]()
28. (D) 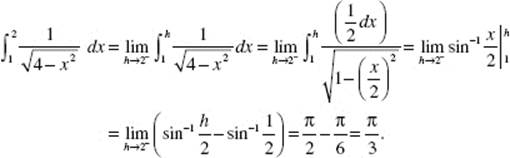
Part B
30. (C) Since the equation of the spiral is r = ln![]() , use the polar mode. The formula for area in polar coordinates is
, use the polar mode. The formula for area in polar coordinates is
![]()
Therefore, calculate
![]()
The result is 3.743.
31. (D) When y = 2t = 4, we have t = 2, so the line passes through point F(2) = (5,4).
Also 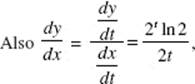 so at t = 2 the slope of the tangent line is
![]()
An equation for the tangent line is y − 4 = ln 2(x − 5).
32. (A) I. ![]() converges by the Ratio Test:
converges by the Ratio Test: ![]()
II. ![]() diverges by the nth Term Test:
diverges by the nth Term Test: ![]()
III. ![]() diverges by the Comparison Test:
diverges by the Comparison Test: ![]() diverges.
diverges.
38. (E) If Q0 is the initial amount of the substance and Q is the amount at time t, then
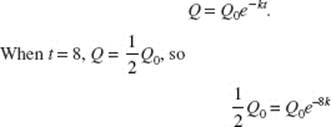
and ![]() Thus k = 0.08664. Using a calculator, find t when
Thus k = 0.08664. Using a calculator, find t when ![]()
![]() so t ≈ 12.68. Don’t round off k too quickly.
so t ≈ 12.68. Don’t round off k too quickly.
40. (A) See figure below.
![]()
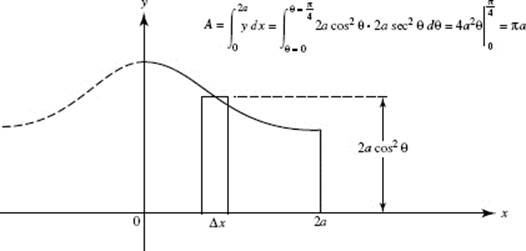
41. (D) See figure below.
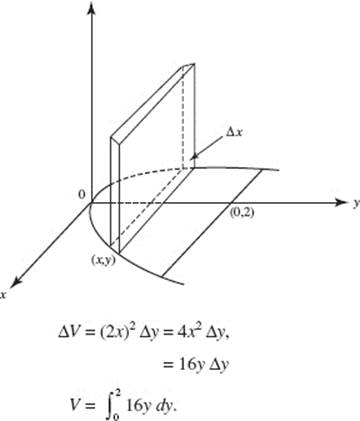
42. (E) ![]()
43. (C) The endpoints of the arc are ![]() and (e,1). The arc length is given by
and (e,1). The arc length is given by
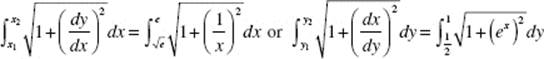
44. (B) Find k such that cos x will differ from  by less than 0.001 at x = k.
Solve
![]()
which yields x or k = 0.394.
Free-Response
Part A
1. See solution for AB-1, Free-Response in AB Practice Exam Two.
2. (a) Position is the antiderivative of ![]()
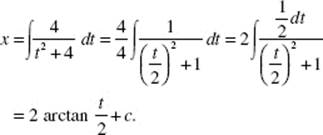
To find c, substitute the initial condition that x = 1 when t = 0:
![]()
At t = 2, x = 2 arctan ![]() and the position of the object is
and the position of the object is 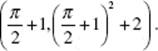
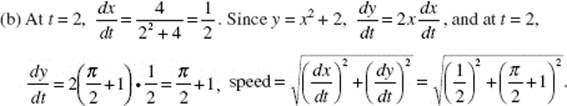
(c) The distance traveled is the length of the arc of y = x2 + 2 in the interval ![]()
![]()
Part B
3. (a)
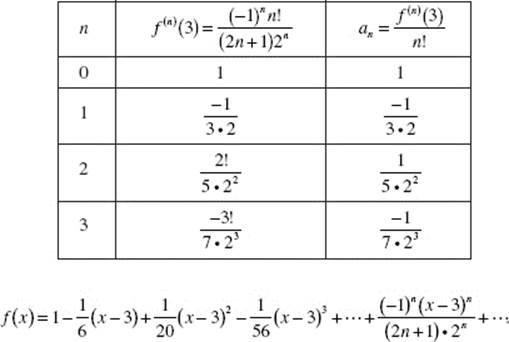
(b) By the Ratio Test, the series converges when
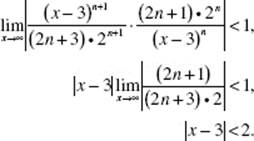
Thus, the radius of convergence is 2.
(c) ![]() is an alternating series. Since
is an alternating series. Since ![]() and
and ![]() it converges by the Alternating Series Test. Therefore the error is less than the magnitude of the first omitted term:
it converges by the Alternating Series Test. Therefore the error is less than the magnitude of the first omitted term:
![]()
4. See solution for AB/BC 4, Free-Response in AB Practice Exam Two.
5. See solution for AB-5, Free-Response in AB Practice Exam Two.
6. See solution for AB-6, Free-Response in AB Practice Exam Two.
Answers Explained
The explanations for questions not given below will be found in the answer section for AB Practice Exam 3. Identical questions in Section I of Practice Examinations AB3 and BC3 have the same number. For example, explanations of the answers for Questions 1 and 2, not given below, will be found in Section I of Calculus AB Practice Exam 3, Answers 1 and 2.
Multiple-Choice
Part A
3. (B) The series ![]() is geometric with
is geometric with ![]() it converges
it converges
to 
5. (D) ![]() is the sum of an infinite geometric series with first term 1 and common ratio −2x. The series is 1 − 2x + 4x2 − 8x3 + 16x4 − ….
is the sum of an infinite geometric series with first term 1 and common ratio −2x. The series is 1 − 2x + 4x2 − 8x3 + 16x4 − ….
6. (A) Assume that
![]()
Then
2x2 − x + 4 = A(x − 1)(x − 2) + Bx(x − 2) + Cx(x − 1).
Since you are looking for B, let x = 1:
2(1) − 1 + 4 = 0 + B(−1) + 0; B = −5.
8. (B) Since ex ![]() 1 + x,e −x2
1 + x,e −x2 ![]() 1 − x2. So
1 − x2. So
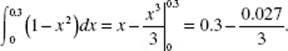
12. (A) ![]()
17. (E) 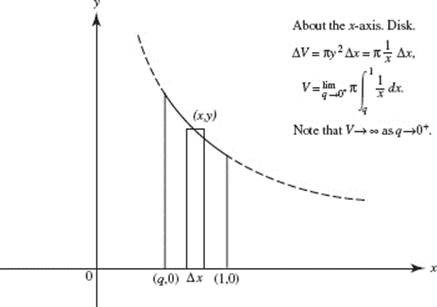
18. (D) See the figure below, which shows that the length of a semicircle of radius 2 is needed here. The answer can, of course, be found by using the formula for arc length:
20. (E) ![]() using long division,
using long division, ![]()
22. (C) Using parts we let u = x2, dv = exdx; then du = 2x dx, v = ex, and
![]()
We use parts again with u = x, dv = exdx; then du = dx, v = ex, and
![]()
Now ![]()
23. (E) ![]() will increase above the half-full level (that is, the height of the water will rise more rapidly) as the area of the cross section diminishes.
will increase above the half-full level (that is, the height of the water will rise more rapidly) as the area of the cross section diminishes.
27. (A) The required area is lined in the figure below.
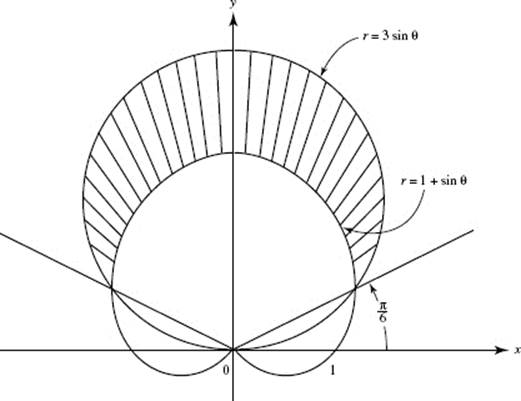
28. (D) Note that f (x) = x + 6 if x ≠ 6, that f (6) = 12, and that ![]() So f is defined and continuous at x = 6.
So f is defined and continuous at x = 6.
Part B
29. (E) The velocity functions are
![]()
When these functions are graphed on a calculator, it is clear that they intersect four times during the first 3 sec, as shown below.
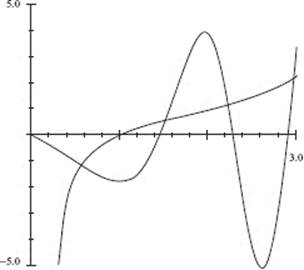
30. (C) Changes in values of f ″ show that f ″′ may be constant. Hence f ″ may be linear, so f′ could be quadratic and thus f cubic.
31. (C) Expressed parametrically, x = sin3θ cosθ, y = sin3θ sin θ. ![]() is undefined where
is undefined where ![]() = −sin3θ sin θ + 3 cos 3θ cos θ = 0.
= −sin3θ sin θ + 3 cos 3θ cos θ = 0.
Use your calculator to solve for θ.
34. (D) See the figure below.
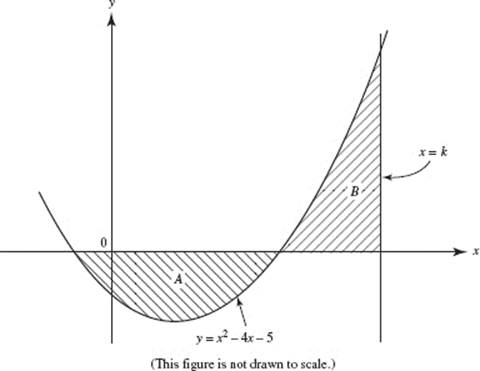
The roots of f (x) = x2 − 4x − 5 = (x − 5)(x + 1) are x = −1 and 5. Since areas A and B are equal, therefore, ![]() Thus,
Thus,
A calculator yields k = 8.
37. (C) It is given that ![]() An antiderivative is
An antiderivative is ![]()
Since ![]() the constants are c1 = c2 = 1. The object’s speed is
the constants are c1 = c2 = 1. The object’s speed is ![]()
Use a calculator to find that the object’s maximum speed is 2.217.
39. (D) Use the Ratio Test:
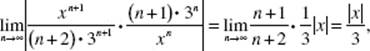
which is less than 1 if −3 < x < 3. When x = −3, the convergent alternating harmonic series is obtained.
40. (A) Since ![]() and since v(0) = 1, C = 1. Then
and since v(0) = 1, C = 1. Then ![]() yields s = t3 + t + C ′, and you can let s(0) = 0. Then you want s(3).
yields s = t3 + t + C ′, and you can let s(0) = 0. Then you want s(3).
41. (A) Arc length is given by ![]() Here the integrand
Here the integrand ![]() implies that
implies that ![]() hence, y = 3 ln x + C. Since the curve contains (1,2), 2 = 3 ln 1 + C, which yields C = 2.
hence, y = 3 ln x + C. Since the curve contains (1,2), 2 = 3 ln 1 + C, which yields C = 2.
42. (E) 
At x = 3; the answer is 2[2(−2) + 52] = 42.
43. (D) Counterexamples are, respectively, for (A), f (x) = |x|, c = 0; for (B), f (x) = x3, c = 0; for (C), f (x) = x4, c = 0; for (E), f (x) = x2 on (−1, 1).
Free-Response
Part A
1. 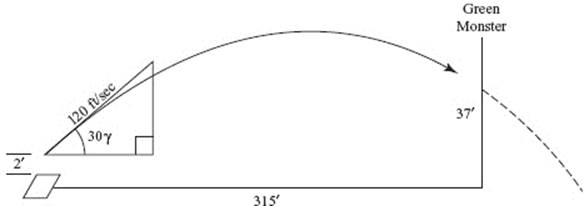
(a) The following table shows x- and y-components of acceleration, velocity, and position:
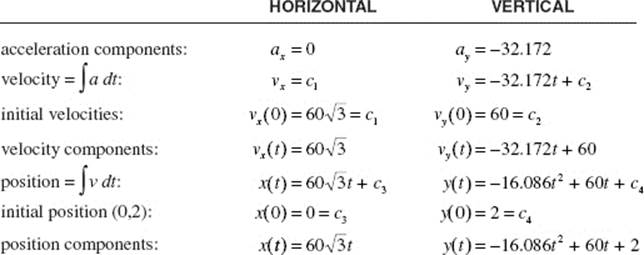
The last line in the table is the answer to part (a).
(b) To determine how far above the ground the ball is when it hits the wall, find out when x = 315, and evaluate y at that time.
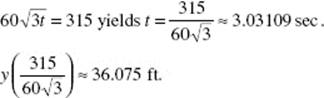
(c) The ball’s speed at the moment of impact in part (b) is |v(t)| evaluated at ![]()
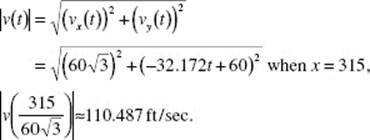
2. See solution for AB-2, Free-Response in AB Practice Exam Three.
Part B
3. See solution for AB/BC 3, Free-Response in AB Practice Exam Three.
4. See solution for AB-4, pages Free-Response in AB Practice Exam Three.
5. (a) The table below is constructed from the information given in Question 5 in BC Practice Exam Three.
|
n |
f (n) (5) |
|
|
0 |
2 |
2 |
|
1 |
−2 |
−2 |
|
2 |
−1 |
|
|
3 |
6 |
1 |
![]()
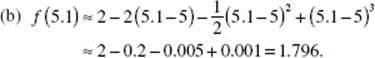
(c) Use Taylor’s theorem around x = 0.
|
n |
g(n)(x) |
g(n)(0) |
|
|
0 |
f (2x + 5) |
f (5) = 2 |
2 |
|
1 |
2f′ (2x + 5) |
2f′ (5) = 2(−2) = −4 |
−4 |
|
2 |
4f ″ (2x + 5) |
4f ″ (5) = 4(−1) = −4 |
−2 |
|
3 |
8f′″(2x + 5) |
8f′″(5) = 8(6) = 48 |
8 |
g(x) ≈ 2 − 4x − 2x2 + 8x3.
6. (a) At (−1,8), ![]() so the tangent line is
so the tangent line is
y − 8 = 5(x − (−1)). Therefore f (x) ≈ 8 + 5(x + 1).
(b) f (3) ≈ 8 + 5(0 + 1) = 13.
(c) At (−1,8), ![]() For Δx = 0.5, Δy = 0.5(5) = 2.5, so move to
For Δx = 0.5, Δy = 0.5(5) = 2.5, so move to
(−1 + 0.5, 8 + 2.5) = (−0.5,10.5).
At (−0.5,10.5), 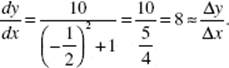 For Δx = 0.5, Δy = 0.5(8) = 4, so move to (−0.5 + 0.5, 10.5 + 4).
Thus f (0) ≈ 14.5.
Answers Explained
1. (D) Velocity ![]() and changes sign both when t = 1 and when t = 3.
and changes sign both when t = 1 and when t = 3.
2. (A) Since v > 0 for 0 ![]() t
t ![]() 2, the distance is equal to
2, the distance is equal to ![]()
3. (E) The answer is 8. Since the particle reverses direction when t = 2, and v > 0 for t > 2 but v < 0 for t < 2, therefore, the total distance is
![]()
4. (E) ![]() so there is no change in position.
so there is no change in position.
5. (B) Since v = sin t is positive on 0 < t ![]() 2, the distance covered is
2, the distance covered is
![]() sin t dt = 1 − cos 2.
sin t dt = 1 − cos 2.
6. (D) ![]() .
.
7. (D) The velocity v of the car is linear since its acceleration is constant:
![]()
8. (D) ![]() Since R(0) = 〈0,1〉,
Since R(0) = 〈0,1〉,
c1 = 0 and c2 = 1.
9. (A) a = v′(t) = 〈1,1〉 for all t.
10. (B) ![]()
11. (B) Since R = 〈x, y〉, its slope is ![]() since
since ![]() its slope is
its slope is ![]()
If R is perpendicular to v, then ![]() so
so
![]() and x2 + y2 = k (k > 0).
and x2 + y2 = k (k > 0).
Since (4, 3) is on the curve, the equation must be
x2 + y2 = 25.
12. (D) ![]() since
since ![]() and e° + c2 = 0; hence c1 = 2 and c2 = −1.
and e° + c2 = 0; hence c1 = 2 and c2 = −1.
13. (B) The object’s position is given by ![]() Since the object was at the origin at
Since the object was at the origin at ![]() and 4 · 1 + c2 = 0, making the position
and 4 · 1 + c2 = 0, making the position ![]() When t = 0, x(0) = −2, y(0) = −4.
When t = 0, x(0) = −2, y(0) = −4.
14. (D) ![]()
15. (B) We want the accumulated number of people to be 100:
This occurs at h = 2 hours after 8 A.M.
16. (C) ![]()
17. (A) ![]()
18. (A) The number of new people who hear the rumor during the second week is
![]()
Be careful with the units! The answer is the total change, of course, in F(t) from t = 7 to t = 14 days, where F ′(t) = t2 + 10t.
19. (B) Total gallons = ![]()
20. (A) Be careful! The number of cars is to be measured over a distance of x (not 20) mi. The answer to the question is a function, not a number. Note that choice (C) gives the total number of cars on the entire 20-mi stretch.
21. (C) Since the strip of the city shown in the figure is at a distance r mi from the highway, it is ![]() mi long and its area is
mi long and its area is ![]() The strip’s population is approximately 2(12 − 2r)
The strip’s population is approximately 2(12 − 2r) ![]() Δr. The total population of the entire city is twice the integral
Δr. The total population of the entire city is twice the integral ![]() as it includes both halves of the city.
as it includes both halves of the city.
22. (C)
The population equals ∑ (area · density). We partition the interval [0,10] along a radius from the center of town into 5 equal subintervals each of width Δr = 2 mi. We will divide Winnipeg into 5 rings. Each has area equal to (circumference × width), so the area is 2πrk Δr or 4πrk. The population in the ring is
(4πrk)· (density at rk) = 4πrk · f (rk).
A Riemann sum, using left-hand values, is 4π · 0 · 50 + 4π · 2 · 45 + 4π · 4 · 40 + 4π · 6 · 30 + 4π · 8 · 15 = 4π(90 + 160 + 180 + 120) ![]() 6912 hundred people—or about 691,200 people.
6912 hundred people—or about 691,200 people.
23. (E) The total amount dumped after 7 weeks is
![]()
24. (B) The total change in temperature of the roast 20 min after it is put in the refrigerator is
![]()
Since its temperature was 160°F when placed in the refrigerator, then 20 min later it is (160 − 89.7)°F or about 70°F. Note that the temperature of the refrigerator (45°F) is not used in answering the question because it is already “built into” the cooling rate.
25. (A) Let T be the number of weeks required to release 9 tons. We can use parts to integrate ![]() then substitute the limits. We must then set the resulting expression equal to 9 and solve for T. A faster, less painful alternative is to use a graphing calculator to solve the equation
then substitute the limits. We must then set the resulting expression equal to 9 and solve for T. A faster, less painful alternative is to use a graphing calculator to solve the equation
![]()
The answer is about 10.2 weeks.
26. (D) Note that the curve is above the x-axis on [0, 1], but below on [1, 3], and that the areas for x < 0 and x > 3 are unbounded.
Using the calculator, we get
![]()
27. (E) The FTC yields total change:
![]()
28. (C) The total change (increase) in population during the second hour is given by ![]() The answer is 1046.
The answer is 1046.
29. (C) Call the time in hours t and the function for visitors/hour R(t). Then the area under the curve represents the number of visitors V. We will estimate the time k when ![]() using a Riemann sum.
using a Riemann sum.
|
The table shows one |
||||
|
Hour |
Visitors/hour (midpoint est.) |
Total visitors since noon |
||
|
Noon–1 P.M. |
5 |
5 |
||
|
1−2 P.M. |
25 |
30 |
||
|
2−3 P.M. |
70 |
100 |
||
|
3−4 P.M. |
120 |
220 |
||
We estimate that there had been about 100 visitors by 3 P.M. and 220 by 4 P.M., so the 200th visitor arrived between 3 and 4 P.M.
30. (B)
31. (C) We partition [0, 2] into n equal subintervals each of time Δt hr. Since the 18-wheeler gets (4 + 0.01v) mi/gal of diesel, it uses ![]()
Since it covers v · Δt mi during Δt hr, it uses ![]()
Since ![]() we see that the diesel fuel used in the first 2 hr is
we see that the diesel fuel used in the first 2 hr is
Answers Explained
1. (C) v(t) = 2t2 − t + C; v(1) = 3; so C = 2.
2. (B) If a(t) = 20t3 − 6t, then
v(t) = 5t4 − 3t2 + C1,
s(t) = t5 − t3 + C1 t + C2,
Since
s(−1) = −1 + 1 − C1 + C2 = 2
and
s(1) = 1 − 1 + C1 + C2 = 4,
therefore
2C2 = 6, C2, = 3,
C1 = 1.
So
v(t) = 5t4 − 3t2 + 1.
3. (D) From Answer 2, s(t) = t5 − t3 + t + 3, so s(0) = C2 = 3.
4. (B) Since a(t) = −32, v(t) = −32t + 40, and the height of the stone s(t) = −16t2 + 40t + C. When the stone hits the ground, 4 sec later, s(t) = 0, so
![]()
5. (C) From Answer 4
s(t) = −16t2 + 40t + 96.
Then
s ′(t) = −32t + 40,
which is zero if t = 5/4, and that yields maximum height, since s ″(t) = −32.
6. (E) The velocity v(t) of the car is linear, since its acceleration is constant and
7. (B) Since v = 100 − 20t, s = 100t − 10t2 + C with s(0) = 0. So s(1) = 100 − 10 = 90 ft.
8. (A)
9. (A) The odometer measures the total trip distance from time t = a to t = b (whether the car moves forward or backward or reverses its direction one or more times from t = a to t = b). This total distance is given exactly by ![]()
10. (E) (A), (B), (C), and (D) are all true. (E) is false: see Answer 9.
11. (A) Integrating yields ![]() + C or y2 = x2 + 2C or y2 = x2 + C ′, where we have replaced the arbitrary constant 2C by C ′.
+ C or y2 = x2 + 2C or y2 = x2 + C ′, where we have replaced the arbitrary constant 2C by C ′.
12. (C) For initial point (−2,1), x2 − y2 = 3. Rewriting the d.e. y dy = x dx as ![]() reveals that the derivative does not exist when y = 0, which occurs at
reveals that the derivative does not exist when y = 0, which occurs at ![]() Since the particular solution must be differentiable in an interval containing x = −2, the domain is
Since the particular solution must be differentiable in an interval containing x = −2, the domain is ![]()
13. (E) We separate variables. ![]() The initial point yields ln
The initial point yields ln ![]() hence c = −2. With y > 0, the particular solution is ln
hence c = −2. With y > 0, the particular solution is ln ![]()
14. (C) We separate variables. ![]() The particular solution is −e−y = x − 2.
The particular solution is −e−y = x − 2.
15. (B) The general solution is ![]() when x = 4 yields C = 0.
when x = 4 yields C = 0.
16. (E) Since ![]() it follows that
it follows that
ln y = ln x + C or ln y = ln x + ln k;
so y = kx.
17. (E) ![]() hence the general solution is y = kex, k ≠ 0.
hence the general solution is y = kex, k ≠ 0.
18. (A) We rewrite and separate variables, getting ![]() The general solution is
The general solution is
![]()
19. (C) We are given that ![]() The general solution is ln |y| = 3 ln |x| + C.
The general solution is ln |y| = 3 ln |x| + C.
Thus, |y| = c |x3 |; y = ±c x3. Since y = 1 when x = 1, we get c = 1.
20. (E) The d.e. ![]() reveals that the derivative does not exist when x = 0. Since the particular solution must be differentiable in an interval containing initial value x = 1, the domain is x > 0.
reveals that the derivative does not exist when x = 0. Since the particular solution must be differentiable in an interval containing initial value x = 1, the domain is x > 0.
21. (E) The general solution is y = k ln |x| + C, and the particular solution is y = 2 ln |x| + 2.
22. (D) We carefully(!) draw a curve for a solution to the d.e. represented by the slope field. It will be the graph of a member of the family y = sin x + C. At the right we have superimposed the graph of the particular solution y = sin x − 0.5.
23. (B)
It’s easy to see that the answer must be choice (A), (B), or (C), because the slope field depends only on x: all the slope segments for a given x are parallel. Also, the solution curves in the slope field are all concave up, as they are only for choices (A) and (B). Finally, the solution curves all have a minimum at x = 2, which is true only for differential equation (B).
24. (E) The solution curve is y = tan x, which we can obtain from the differential equation y ′ = 1 + y2 with the condition y(0) = 0 as follows:
![]()
Since y(0) = 0, C = 0. Verify that (A) through (D) are incorrect.
NOTE: In matching slope fields and differential equations in Questions 25–29, keep in mind that if the slope segments along a vertical line are all parallel, signifying equal slopes for a fixed x, then the differential equation can be written as y ′ = f (x). Replace “vertical” by “horizontal” and “x” by “ y” in the preceding sentence to obtain a differential equation of the form y ′ = g(y).
25. (B) The slope field for y ′ = y must by II; it is the only one whose slopes are equal along a horizontal line.
26. (D) Of the four remaining slope fields, IV is the only one whose slopes are not equal along either a vertical or a horizontal line (the segments are not parallel). Its d.e. therefore cannot be either of type y ′ = f (x) or y ′ = g(y). The d.e. must be implicitly defined—that is, of the form y ′ = F(x,y). So the answer here is IV.
27. (C) The remaining slope fields, I, III, and V, all have d.e.’s of the type y ′ = f (x). The curves “lurking” in III are trigonometric curves—not so in I and V.
28. (A) Given y ′ = 2x, we immediately obtain the general solution, a family of parabolas, y = x2 + C. (Trace the parabola in I through (0, 0), for example.)
29. (E) V is the only slope field still unassigned! Furthermore, the slopes “match” e−x2: the slopes are equal “about” the y-axis; slopes are very small when x is close to −2 and 2; and e−x2 is a maximum at x = 0.
30. (A) From Answer 25, we know that the d.e. for slope field II is y ′ = y. The general solution is y = cex. For a solution curve to pass through point (0, −1), we have −1 = ce0; and c = −1.
31. (C) Euler’s method for y ′ = x, starting at (1, 5), with Δx = 0.1, yields
|
x |
y |
(SLOPE) *· Δx |
= Δ y |
|
|
1 |
5 |
1 · (0.1) |
= 0.1 |
*The slope is x. |
|
1.1 |
5.1 |
(1.1) · (0.1) |
= 0.11 |
|
|
1.2 |
5.21 |
32. (B) We want to compare the true value of y(1.2) to the estimated value of 5.21 obtained using Euler’s method in Solution 31. Solving the d.e. ![]() yields
yields ![]() and initial condition y(1) = 5 means that
and initial condition y(1) = 5 means that ![]() or C = 4.5. Hence
or C = 4.5. Hence ![]() + 4.5 = 5.22. The error is 5.22−5.21 = 0.01.
+ 4.5 = 5.22. The error is 5.22−5.21 = 0.01.
33. (A) Slopes depend only on the value of y, and the slope field suggests that y ′ = 0 whenever y = 0 or y = −2.
34. (D) The slope field suggests that the solution function increases (or decreases) without bound as x increases, but approaches y = 1 as a horizontal asymptote as x decreases.
35. (D) We separate variables to get ![]() We integrate:
We integrate:
![]() With t = 0 and s = 1, C = 0. When
With t = 0 and s = 1, C = 0. When ![]() we get
we get ![]()
36. (B) Since ![]() and ln R = ct + C. When t = 0, R = R0; so ln R0 = C or ln R = ct + ln R0. Thus
and ln R = ct + C. When t = 0, R = R0; so ln R0 = C or ln R = ct + ln R0. Thus
ln R − ln R0 = ct; ln ![]()
37. (D) The question gives rise to the differential equation ![]() where P = 2P0 when t = 50. We seek
where P = 2P0 when t = 50. We seek ![]() for t = 75. We get ln
for t = 75. We get ln ![]() with ln 2 = 50k; then
with ln 2 = 50k; then
![]()
38. (A) We let S equal the amount present at time t; using S = 40 when t = 0 yields ln ![]() Since, when t = 2, S = 10, we get
Since, when t = 2, S = 10, we get
![]()
39. (A) We replace g(x) by y and then solve the equation ![]() We use the constraints given to find the particular solution
We use the constraints given to find the particular solution ![]()
40. (C) The general solution of ![]() is ln y = x + C or y = cex. For a solution to pass through (2, 3), we have 3 = ce2 and c = 3/e2
is ln y = x + C or y = cex. For a solution to pass through (2, 3), we have 3 = ce2 and c = 3/e2 ![]() 0.406.
0.406.
41. (C) At a point of intersection, y ′ = x + y and x + y = 0. So y ′ = 0, which implies that y has a critical point at the intersection. Since y ″ = 1 + y ′ = 1 + (x + y) = 1 + 0 = 1, y ″ > 0 and the function has a local minimum at the point of intersection. [See Figure N9–5, showing the slope field for y ′= x + y and the curve y = ex − x − 1 that has a local minimum at (0, 0).]
42. (A) Although there is no elementary function (one made up of polynomial, trigonometric, or exponential functions or their inverses) that is an anti-derivative of F ′(x) = e−x2, we know from the FTC, since F(0) = 0, that
![]()
To approximate ![]() use your graphing calculator
use your graphing calculator
For upper limits of integration x = 50 and x = 60, answers are identical to 10 decimal places. Rounding to three decimal places yields 0.886.
43. (C) Logistic growth is modeled by equations of the form ![]() where L is the upper limit. The graph shows L = 1000, so the differential equation must be
where L is the upper limit. The graph shows L = 1000, so the differential equation must be ![]() Only equation C is of this form (k = 0.003).
Only equation C is of this form (k = 0.003).
44. (D) We start with x = 3 and y = 100. At x = 3, ![]() moving us to x = 3 + 2 = 5 and y = 100 + 5 = 105. From there
moving us to x = 3 + 2 = 5 and y = 100 + 5 = 105. From there ![]() so when x = 5 + 2 = 7 we estimate y = 105 + (−1) = 104.
so when x = 5 + 2 = 7 we estimate y = 105 + (−1) = 104.
45. (C) We separate the variables in the given d.e., then solve:
Since y(0) = 180, ln 112 = c. Then
When t = 10, y = 68 + 112e−1.1 ![]() 105°F.
105°F.
46. (E) The solution of the d.e. in Question 45, where y is the temperature of the coffee at time t, is
47. (D) If Q is the concentration at time t, then ![]() We separate variables and integrate:
We separate variables and integrate:
![]()
We let Q(0) = Q0. Then
![]()
We now find t when Q = 0.1Q0:
48. (E) Please read the sections on Applications for Restricted Growth and Applications for Logistic Growth in this chapter for the characteristics of the logistic model.
49. (D) (A), (B), (C), and (E) are all of the form y ′ = ky(a − y).
50. (B) The rate of growth, ![]() is greatest when its derivative is 0 and the curve of
is greatest when its derivative is 0 and the curve of ![]() is concave down. Since
is concave down. Since
which is equal to 0 if ![]() or 500, animals. The curve of y ′ is concave down for all P, since
or 500, animals. The curve of y ′ is concave down for all P, since
![]()
so P = 500 is the maximum population.
51. (A) The description of temperature change here is an example of Case II: the rate of change is proportional to the amount or magnitude of the quantity present (i.e., the temperature of the corpse) minus a fixed constant (the temperature of the mortuary).
52. (C) Since (A) is the correct answer to Question 51, we solve the d.e. in (A) given the initial condition T(0) = 32:
BC ONLY
Answers Explained
1. (B) ![]() converges to −1.
converges to −1.
2. (C) Note that ![]()
3. (D) The sine function varies continuously between −1 and 1 inclusive.
4. (E) Note that ![]() is a sequence of the type sn = rn with |r| < 1; also that
is a sequence of the type sn = rn with |r| < 1; also that ![]() by repeated application of L’Hôpital’s rule.
by repeated application of L’Hôpital’s rule.
5. (C) ![]()
6. (E) The harmonic series ![]() is a counterexample for (A), (B), and (C).
is a counterexample for (A), (B), and (C). ![]() shows that (D) does not follow.
shows that (D) does not follow.
7. (B)
8. (A) ![]()
BC ONLY
9. (B) Find counterexamples for statements (A), (C), and (D).
10. (D) ![]() the general term of a divergent series.
the general term of a divergent series.
11. (D) (A), (B), (C), and (E) all converge; (D) is the divergent geometric series with r = −1.1.
12. (D) ![]()
13. (A) If ![]() then f (0) is not defined.
then f (0) is not defined.
14. (C) ![]() unless x = 3.
unless x = 3.
15. (B) The integrated series is ![]() See Question 27.
See Question 27.
16. (E) ![]()
17. (A)
18. (E) The series satisfies the Alternating Series Test, so the error is less than the first term dropped, namely, ![]() (see (5)), in the chart for Common Maclaurin Series in Chapter 10 of this eBook. So n ≥ 500.
(see (5)), in the chart for Common Maclaurin Series in Chapter 10 of this eBook. So n ≥ 500.
19. (D) Note that the Taylor series for tan−1 x satisfies the Alternating Series Test and that ![]() then the first omitted term,
then the first omitted term, ![]() is negative. Hence P7 (x) exceeds tan−1 x.
is negative. Hence P7 (x) exceeds tan−1 x.
20. (E) Now the first omitted term, ![]() is positive for x < 0. Hence P9 (x) is less than tan−1 x.
is positive for x < 0. Hence P9 (x) is less than tan−1 x.
21. (A) If ![]() converges, so does
converges, so does ![]() where m is any positive integer; but their sums are probably different.
where m is any positive integer; but their sums are probably different.
BC ONLY
22. (E) Each series given is essentially a p-series. Only in (E) is p > 1.
23. (C) Use the Integral Test.
24. (C) The limit of the ratio for the series ![]() is 1, so this test fails; note for (E) that
is 1, so this test fails; note for (E) that
![]()
25. (B) ![]() does not equal 0.
does not equal 0.
26. (E) Note the following counterexamples:
(A) ![]()
(B) ![]()
(C) ![]()
(D) ![]()
27. (C) Since ![]() the series converges if |x| < 1. We must test the end-points: when x = 1, we get the divergent harmonic series; x = −1 yields the convergent alternating harmonic series.
the series converges if |x| < 1. We must test the end-points: when x = 1, we get the divergent harmonic series; x = −1 yields the convergent alternating harmonic series.
28. (A) ![]() for all x ≠ −1; since the given series converges to 0 if x = −1, it therefore converges for all x.
for all x ≠ −1; since the given series converges to 0 if x = −1, it therefore converges for all x.
29. (B) The differentiated series is ![]()
30. (B) See Example 52.
31. (D) Note that every derivative of ex is e at x = 1. The Taylor series is in powers of (x − 1) with coefficients of the form ![]()
32. (D) For f (x) = cos x around ![]()
33. (C) Note that ln q is defined only if q > 0, and that the derivatives must exist at x = a in the formula for the Taylor series.
34. (A) Use
![]()
![]() Or use the series for ex and let x = −0.1.
Or use the series for ex and let x = −0.1.
BC ONLY
35. (C)
Or generate the Maclaurin series for esin x.
36. (E) (A), (B), (C), and (D) are all true statements.
37. (A)
38. (C)
Since the series converges when ![]() that is, when
that is, when ![]() the radius of convergence is
the radius of convergence is ![]()
39. (E) The Maclaurin series sin x = ![]() converges by the Alternating Series Test, so the error |R4 | is less than the first omitted term. For x = 1, we have
converges by the Alternating Series Test, so the error |R4 | is less than the first omitted term. For x = 1, we have ![]()
40. (D)
Answers Explained
Part A
1. (D) If f (x) = ![]() for x ≠ 0 and f (0) = 0 then,
for x ≠ 0 and f (0) = 0 then,
![]()
thus this function is continuous at 0. In (A), ![]() does not exist; in (B), f has a jump discontinuity; in (C), f has a removable discontinuity; and in (E), f has an infinite discontinuity.
does not exist; in (B), f has a jump discontinuity; in (C), f has a removable discontinuity; and in (E), f has an infinite discontinuity.
2. (C) To find the y-intercept, let x = 0; y = − 1.
3. (A) ![]()
4. (D) The line x + 3y + 3 = 0 has slope ![]() a line perpendicular to it has slope 3.
a line perpendicular to it has slope 3.
The slope of the tangent to y = x2 − 2x + 3 at any point is the derivative 2x − 2. Set 2x − 2 equal to 3.
5. (A) is f′ (1), where ![]() Or simplify the given fraction to
Or simplify the given fraction to ![]()
6. (E) Because p ″(2) < 0 and p ″(5) > 0, p changes concavity somewhere in the interval [2,5], but we cannot be sure p ″ changes sign at x = 4.
7. (C)
Save time by finding the area under y = |x − 4| from a sketch!
8. (A) Since the degrees of numerator and denominator are the same, the limit as x→∞ is the ratio of the coefficients of the terms of highest degree: ![]()
9. (D) On the interval [1, 4], f′ (x) = 0 only for x = 3. Since f (3) is a relative minimum, check the endpoints to find that f (4) = 6 is the absolute maximum of the function.
10. (C) To find lim f as x → 5 (if it exists), multiply f by ![]()
![]()
and if x ≠ 5 this equals ![]() So lim f (x) as x → 5 is
So lim f (x) as x → 5 is ![]() For f to be continuous at x = 5, f (5) or c must also equal
For f to be continuous at x = 5, f (5) or c must also equal ![]()
11. (D) Evaluate ![]()
12. (A) ![]() From the equation given, y = esin x.
From the equation given, y = esin x.
13. (D) If f (x) = x cos x, then f ′(x) = −x sin x + cos x, and
![]()
14. (C) If y = ex ln x, then ![]() which equals e when x = 1. Since also y = 0 when x = 1, the equation of the tangent is y = e(x − 1).
which equals e when x = 1. Since also y = 0 when x = 1, the equation of the tangent is y = e(x − 1).
15. (B) v = 4(t − 2)3 and changes sign exactly once, when t = 2.
16. (C) Evaluate ![]()
17. (C)
18. (C) Since v = 3t2 + 3, it is always positive, while a = 6t and is positive for t > 0 but negative for t < 0. The speed therefore increases for t > 0 but decreases for t < 0.
19. (A) Note from the figure that the area, A, of a typical rectangle is
![]()
For y = 2, ![]() Note that
Note that ![]() is always negative.
is always negative.
20. (B) If S represents the square of the distance from (3, 0) to a point (x, y) on the curve, then S = (3 − x)2 + y2 = (3 − x)2 + (x2 − 1). Setting ![]() yields the minimum distance at
yields the minimum distance at ![]()
21. (D) ![]()
22. (D) See the figure. Since the area, A, of the ring equals π (y22 − y12),
A = π [(6x − x2)2 − x4] = π [36x2 − 12x3 + x4 − x4 ]
and ![]() = π (72x − 36x2) = 36πx (2 − x).
= π (72x − 36x2) = 36πx (2 − x).
It can be verified that x = 2 produces the maximum area.
23. (A) This is of type
24. (A) About the y-axis; see the figure. Washer.
![]()
25. (E) Separating variables, we get y dy = (1 − 2x) dx. Integrating gives
![]()
or
y2 = 2x − 2x2 + k
or
2x2 + y2 − 2x = k.
26. (E) 2(5) + ![]()
27. (E) ![]()
28. (D) Use L’Hôpital’s Rule or rewrite the expression as ![]()
29. (D) For f (x) = tan x, this is ![]()
30. (E) The parameter k determines the amplitude of the sine curve. For f = k sin x and g = ex to have a common point of tangency, say at x = q, the curves must both go through (q, y) and their slopes must be equal at q. Thus, we must have
k sin q = eq and k cos q = eq,
and therefore
sin q = cos q.
The figure shows ![]()
31. (D) We differentiate implicitly to find the slope ![]()
At (3, 1), ![]() The linearization is
The linearization is ![]()
32. (C)
33. (A) About the x-axis. Disk.
34. (C) Let f (x) = ax; then ![]() ln a = ln a.
ln a = ln a.
35. (E) ![]() is a function of x alone; curves appear to be asymptotic to the y-axis and to increase more slowly as |x| increases.
is a function of x alone; curves appear to be asymptotic to the y-axis and to increase more slowly as |x| increases.
36. (D) The given limit is equivalent to
where ![]() The answer is
The answer is ![]()
37. (B)
38. (C) In the figure, the curve for y = ex has been superimposed on the slope field.
39. (C) The general solution is y = 3 ln|x2 − 4| + C. The differential equation ![]() reveals that the derivative does not exist for x = ±2. The particular solution must be differentiable in an interval containing the initial value x = −1, so the domain is −2 < x < 2.
reveals that the derivative does not exist for x = ±2. The particular solution must be differentiable in an interval containing the initial value x = −1, so the domain is −2 < x < 2.
40. (A) The solution curve shown is y = ln x, so the differential equation is ![]()
41. (D) ![]() = sec θ; dx = sec2 θ; 0 ≤ x ≤ 1; so 0 ≤ θ ≤
= sec θ; dx = sec2 θ; 0 ≤ x ≤ 1; so 0 ≤ θ ≤ ![]()
42. (C) The equations may be rewritten as ![]() = sin u and y = 1 − 2 sin2 u,
= sin u and y = 1 − 2 sin2 u,
giving ![]()
43. (D) Use the formula for area in polar coordinates,
![]()
then the required area is given by
![]()
(See polar graph 63 in the Appendix.)
44. (C) ![]()
45. (A) The first three derivatives of ![]() The first four terms of the Maclaurin series (about x = 0) are 1, + 2x,
The first four terms of the Maclaurin series (about x = 0) are 1, + 2x, ![]()
Note also that ![]() represents the sum of an infinite geometric series with first term 1 and common ratio 2x. Hence,
represents the sum of an infinite geometric series with first term 1 and common ratio 2x. Hence,
![]()
46. (D) We use parts, first letting u = x2, dv = e−x dx; then du = 2x dx, v = −e−x and
![]()
Now we use parts again, letting u = x, dv = e−x dx; then du = dx, v = −e−x and
![]()
Alternatively, we could use the Tic-Tac-Toe Method:
Then ![]()
47. (E) Use formula (20) in the Appendix to rewrite the integral as
![]()
48. (E) The area, A, is represented by ![]()
49. (D)
50. (C) Check to verify that each of the other improper integrals converges.
51. (D) Note that the integral is improper.
See Example 26.
52. (C) Let ![]() Then ln y = −x ln x and
Then ln y = −x ln x and
![]()
Now apply L’Hôpital’s Rule:
![]()
So, if ![]() ln y = 0, then
ln y = 0, then ![]()
53. (D) The speed, |v|, equals and since x = 3y − y2,
![]()
Then |v| is evaluated, using y = 1, and equals ![]()
54. (A) This is an indeterminate form of type ![]() use L’Hôpital’s Rule:
use L’Hôpital’s Rule:
![]()
55. (E) We find A and B such that ![]()
After multiplying by the common denominator, we have
3x + 2 = A(x − 4) + B(x + 3).
Substituting x = −3 yields A = 1, and x = 4 yields B = 2; hence,
![]()
56. (B) Since ![]()
Then
Note that ![]() so the integral is proper.
so the integral is proper.
57. (D) We represent the spiral as P(θ) = (θ cos θ, θ sin θ). So
Part B
58. (D) Since h is increasing, h ′ ≥ 0. The graph of h is concave downward for x < 2 and upward for x > 2, so h ″ changes sign at x = 2, where it appears that h′ = 0 also.
59. (C) I is false since, for example, f ′(−2) = f ′(1) = 0 but neither g(−2) nor g(1) equals zero.
II is true. Note that f = 0 where g has relative extrema, and f is positive, negative, then positive on intervals where g increases, decreases, then increases.
III is also true. Check the concavity of g: when the curve is concave down, h < 0; when up, h > 0.
60. (A) If ![]()
61. (D) ![]() represents the area of the same region as
represents the area of the same region as ![]() translated one unit to the left.
translated one unit to the left.
62. (D) According to the Mean Value Theorem, there exists a number c in the interval [1,1.5] such that ![]() Use your calculator to solve the equation
Use your calculator to solve the equation ![]() for c (in radians).
for c (in radians).
63. (E) Here are the relevant sign lines:
We see that f ′ and f ″ are both positive only if x > 1.
64. (E) Note from the sign lines in Question 63 that f changes from decreasing to increasing at x = 1, so f has a local minimum there.
Also, the graph of f changes from concave up to concave down at x = 0, then back to concave up at ![]() hence f has two points of inflection.
hence f has two points of inflection.
65. (C) The derivatives of ln (x + 1) are
The nth derivative at ![]()
66. (C) The absolute-value function f (x) = |x| is continuous at x = 0, but f ′(0) does not exist.
67. (C) Let F ′(x) = f (x); then F ′(x + k) = f (x + k);
Or let u = x + k. Then dx = du, when x = 0, u = k; when x = 3, u = 3 + k.
68. (E) See the figure. The equation of the generating circle is (x − 3)2 + y2 = 1, which yields ![]()
69. (D) Note that f (g(u)) = tan−1 (e2u); then the derivative is ![]()
70. (D) Let ![]() Then cos (xy) [xy′ + y] = y ′. Solve for y ′.
Then cos (xy) [xy′ + y] = y ′. Solve for y ′.
71. (E)
72. (C) About the x-axis; see the figure. Washer.
73. (C) By the Mean Value Theorem, there is a number c in [1, 2] such that
![]()
74. (D) The enclosed region, S, is bounded by y = sec x, the y-axis, and y = 4. It is to be rotated about the y-axis.
Use disks; then ΔV = πR2 H = π(arc sec y)2 Δy. Using the calculator, we find that
![]()
75. (C) If Q is the amount at time t. then Q = 40e−kt. Since Q = 20 when t = 2, k = −0.3466. Now find Q when t = 3, from Q = 40e−(0.3466) 3, getting Q = 14 to the nearest gram.
76. (A) The velocity v(t) is an antiderivative of a(t), where ![]() So
So ![]() arctan t + C. Since v (1) = 0, C = − π.
arctan t + C. Since v (1) = 0, C = − π.
77. (D) Graph y = tan x and y = 2 − x in [−1, 3] × [−1, 3]. Note that
![]()
The limits are y = 0 and y = b, where b is the ordinate of the intersection of the curve and the line. Using the calculator, solve
arctan y = 2 − y
and store the answer in memory as B. Evaluate the desired area:
![]()
78. (E) Center the ellipse at the origin and let (x, y) be the coordinates of the vertex of the inscribed rectangle in the first quadrant, as shown in the figure.
To maximize the rectangle’s area A = 4xy, solve the equation of the ellipse, getting
![]()
So ![]() Graph
Graph ![]() in the window [0,5] × [0,150],
in the window [0,5] × [0,150],
The calculator shows that the maximum area (the y-coordinate) equals 100.
79. (B) ![]()
80. (B) When f ′ is positive, f increases. By the Fundamental Theorem of Calculus, f′ (x) = 1 − 2 (cos x)3. Graph f ′ in [0, 2π] × [−2, 4]. It is clear that f ′ > 0 on the interval a < x < b. Using the calculator to solve 1 − 2(cos x)3 = 0 yields a = 0.654 and b = 5.629.
81. (C) ![]()
82. (B) The volume is composed of elements of the form ΔV = (2x)2 Δy. If h is the depth, in feet, then, after t hr,
83. (B) Separating variables yields
P(0) = 300 gives c = 700. P(5) = 500 yields 500 = 1000 − 700e−5k, so k ![]() + 0.0673. Now P(10) = 1000 − 700e−0.673
+ 0.0673. Now P(10) = 1000 − 700e−0.673 ![]() 643.
643.
84. (C) ![]() dx = 4 arctan 1 = π. H′ (1) = f (1) = 2.
dx = 4 arctan 1 = π. H′ (1) = f (1) = 2.
The equation of the tangent line is y − π = 2(x − 1).
85. (C) Using midpoint diameters to determine cylinders, estimate the volume to be
V ![]() π · 82 · 25 + π · 62 · 25 + π · 42 · 25 + π · 32 · 25.
π · 82 · 25 + π · 62 · 25 + π · 42 · 25 + π · 32 · 25.
86. (A)
87. (C) H′ (3) = f′ (g(3)) · g′ (3) = f′ (2) · g′ (3).
88. (E) M′ (3) = f (3) · g′ (3) + g(3) · f′ (3) = 4 · 3 + 2 · 2.
89. (E)
90. (C) ![]()
91. (D) Here are the pertinent curves, with d denoting the depth of the water:
92. (B) Use areas; then ![]() Thus, f (7) − f (1) = 7.
Thus, f (7) − f (1) = 7.
93. (B) The region x units from the stage can be approximated by the semicircular ring shown; its area is then the product of its circumference and its width.
The number of people standing in the region is the product of the area and the density:
![]()
To find the total number of people, evaluate
![]()
94. (B) ![]() is positive, but decreasing; hence
is positive, but decreasing; hence ![]()
95. (C) ![]()
96. (E) On 2 ≤ t ≤ 5, the object moved ![]() ft to the right; then on 5 ≤ t ≤ 8, it moved only
ft to the right; then on 5 ≤ t ≤ 8, it moved only ![]() ft to the left.
ft to the left.
97. (B) ![]()
98. (D) Evaluate ![]()
99. (A) ![]()
Use, also, the facts that the speed is given by and that the point moves counterclockwise; then ![]() = 4, yielding
= 4, yielding ![]() and
and ![]() at the given point. The velocity vector, v, at (3, 4) must therefore be
at the given point. The velocity vector, v, at (3, 4) must therefore be ![]()
100. (A)
101. (B) The formula for length of arc is
Since y = 2x, we find
![]()
102. (D) a(t) = (0, et); the acceleration is always upward.
103. (A) At (0, 1), ![]() so Euler’s method yields (0.1, 1 + 0.1(4)) = (0.1, 1.4).
so Euler’s method yields (0.1, 1 + 0.1(4)) = (0.1, 1.4). ![]() has particular solution y = e4x; the error is e4(0.1) − 1.4.
has particular solution y = e4x; the error is e4(0.1) − 1.4.
104. (D) ![]() Note that the series converges by the Alternating Series Test. Since the first term dropped in the estimate is
Note that the series converges by the Alternating Series Test. Since the first term dropped in the estimate is ![]() the estimate is too high, but within 0.1 of the true sum.
the estimate is too high, but within 0.1 of the true sum.
105. (C) ![]() which equals a constant times the harmonic series.
which equals a constant times the harmonic series.
106. (D) We seek x such that
Then |x| < e and the radius of convergence is e.
107. (B) The error is less than the maximum value of ![]()
This maximum occurs at c = x = ![]()
108. (D)
Note that the curve is traced exactly once by the parametric equations from t = 0 to t = 1.
Answers Explained
Part A
1. (a)
(b) It appears that the rate of change of f, while negative, is increasing. This implies that the graph of f is concave upward.
(c) L = 7.6(0.7) + 5.7(0.3) + 4.2(0.5) + 3.1(0.6) + 2.2(0.4) = 11.87.
(d) Using disks ΔV = πr2 Δx. One possible answer uses the left endpoints of the subintervals as values of r:
V ≈ π(7.6)2 (0.7) + π(5.7)2 (0.3) + π(4.2)2 (0.5) + π(3.1)2 (0.6) + π(2.2)2 (0.4)
2. (a) 12y0 + 0.3 = 24 yields y0 ![]() 1.975.
1.975.
(b) Replace x by 0.3 in the equation of the curve:
The calculator’s solution to three decimal places is y0 = 1.990.
(c) Since the true value of y0 at x = 0.3 exceeds the approximation, conclude that the given curve is concave up near x = 0. (Therefore, it is above the line tangent at x = 0.)
3. Graph f ′(x) = 2x sin x − e(−x2) + 1 in [−7, 7] × [−10, 10].
(a) Since f ′ is even and f contains (0, 0), f is odd and its graph is symmetric about the origin.
(b) Since f is decreasing when f ′ < 0, f decreases on the intervals (a, c) and (j, 1). Use the calculator to solve f′ (x) = 0. Conclude that f decreases on −6.202 < x < −3.294 and (symmetrically) on 3.294 < x < 6.202.
(c) f has a relative maximum at x = q if f ′(q) = 0 and if f changes from increasing (f ′ > 0) to decreasing (f ′ < 0) at q. There are two relative maxima here:
at x = a = −6.202 and at x = j = 3.294.
(d) f has a point of inflection when the graph of f changes its concavity; that is, when f′ changes from increasing to decreasing, as it does at points d and h, or when f′ changes from decreasing to increasing, as it does at points b, g, and k. So there are five points of inflection altogether.
4. In the graph below, C is the piece of the curve lying in the first quadrant. S is the region bounded by the curve C and the coordinate axes.
(a) Graph ![]() in [0,3] × [0,5]. Since you want dy/dx, the slope of the tangent, where y = 1, use the calculator to solve
in [0,3] × [0,5]. Since you want dy/dx, the slope of the tangent, where y = 1, use the calculator to solve
![]()
(storing the answer at B). Then evaluate the slope of the tangent to C at y = 1:
f ′(B) ≈ −21.182.
(b) Since ΔA = yΔx, A = ![]()
(c) When S is rotated about the x-axis, its volume can be obtained using disks:
5. See the figure, where R is the point (a, b), and seek a such that
![]()
6. Graph y = sin 2x in [−1, 3.2] × [−1, 1]. Note that y = f ″.
(a) The graph of f is concave downward where f ″ is negative, namely, on (b, d). Use the calculator to solve sin 2x = 0, obtaining b = 1.651 and d = 2.651. The answer to (a) is therefore 1.651 < x < 2.651.
(b) f ′ has a relative minimum at x = d, because f ″ equals 0 at d, is less than 0 on (b, d), and is greater than 0 on (d, g). Thus f ′ has a relative minimum (from part a) at x = 2.651.
(c) The graph of f ′ has a point of inflection wherever its second derivative f ″′ changes from positive to negative or vice versa. This is equivalent to f ″ changing from increasing to decreasing (as at a and g) or vice versa (as at c). Therefore, the graph of f ′ has three points of inflection on [− 1, 3.2].
7. Graph f (x) = cos x and g(x) = x2 − 1 in [−2, 2] × [−2,2], Here, y1 = f and y2 = g.
(a) Solve cos x = x2 − 1 to find the two points of intersection: (1.177,0.384) and (−1.177,0.384).
(b) Since ΔA = (y1 − y2) Δx = [f (x) − g(x)] Δx, the area A bounded by the two curves is
8. (a) Use the Trapezoid Rule, with h = 60 min:
(b) Draw a horizontal line at y = 20 (as shown on the graph below), representing the rate at which letters are processed then.
(i) Letters began to pile up when they arrived at a rate greater than that at which they were being processed, that is, at t = 10 A.M.
(ii) The pile was largest when the letters stopped piling up, at t = 2 P.M.
(iii) The number of letters in the pile is represented by the area of the small trapezoid above the horizontal line: ![]()
(iv) The pile began to diminish after 2 P.M., when letters were processed at a rate faster than they arrived, and vanished when the area of the shaded triangle represented 1500 letters. At 5 P.M. this area is ![]() letters, so the pile vanished shortly after 5 P.M.
letters, so the pile vanished shortly after 5 P.M.
9. Draw a vertical element of area as shown below.
(a) Let a represent the x-value of the positive point of intersection of y = x4 and y = sin x. Solving a4 = sin a with the calculator, we find a = 0.9496.
(b) Elements of volume are triangular prisms with height h = 3 and base b = (sinx − x4), as shown below.
(c) When R is rotated around the x-axis, the element generates washers. If r1, and r2 are the radii of the larger and smaller disks, respectively, then
10. The figure above shows an elliptical cross section of the tank. Its equation is
![]()
(a) The volume of the tank, using disks, is ![]() where the ellipse’s symmetry about the x-axis has been exploited. The equation of the ellipse is equivalent to x2 = 6.25(100 − y2), so
where the ellipse’s symmetry about the x-axis has been exploited. The equation of the ellipse is equivalent to x2 = 6.25(100 − y2), so
![]()
Use the calculator to evaluate this integral, storing the answer as V to have it available for part (b).
The capacity of the tank is 7.48V, or 196,000 gal of water, rounded to the nearest 1000 gal.
(b) Let k be the y-coordinate of the water level when the tank is one-fourth full. Then
![]()
and the depth of the water is k + 10.
11. (a) Let h represent the depth of the water, as shown.
Then h is the altitude of an equilateral triangle, and the base ![]()
The volume of water is
![]()
Now ![]() and it is given that
and it is given that ![]() Thus, when h = 4,
Thus, when h = 4,
![]()
(b) Let x represent the length of one of the sides, as shown.
The bases of the trapezoid are 24 − 2x and 24 − 2x + ![]() and the height is
and the height is ![]()
The volume of the trough (in in.3) is given by
Since ![]() the maximum volume is attained by folding the metal 8 inches from tne edges.
the maximum volume is attained by folding the metal 8 inches from tne edges.
12. (a) Both π/4 and the expression in brackets yield 0.7853981634, which is accurate to ten decimal places.
(b)
(c) ![]() this agrees with the value of
this agrees with the value of ![]() to four decimal places.
to four decimal places.
(d) The series
![]()
converges very slowly. Example 56 evaluated the sum of 60 terms of the series for π (which equals 4 tan−1 1). To four decimal places, we get π = 3.1249, which yields 0.7812 for π/4—not accurate even to two decimal places.
13. (a) The given series is alternating. Since ![]()
Since ln x is an increasing function,
![]()
The series therefore converges.
(b) Since the series converges by the Alternating Series Test, the error in using the first n terms for the sum of the whole series is less than the absolute value of the (n + 1)st term. Thus the error is less than ![]() Solve for n using
Solve for n using ![]()
The given series converges very slowly!
(c) The series ![]() is conditionally convergent. The given alternating series converges since the nth term approaches 0 and
is conditionally convergent. The given alternating series converges since the nth term approaches 0 and ![]() However, the nonnegative series diverges by the Integral Test, since
However, the nonnegative series diverges by the Integral Test, since
![]()
14. (a) Solve by separation of variables:
Let c = e−10c; then
![]()
Now use initial condition y = 2 at t = 0:
![]()
and the other condition, y = 5 at t = 2, gives
![]()
(b) Since c = 4 and ![]()
Solving for y yields ![]()
(c) ![]() means 1 + 4 · 2−t = 1.25, so t = 4.
means 1 + 4 · 2−t = 1.25, so t = 4.
(d) ![]() so the value of y approaches 10.
so the value of y approaches 10.
15. (a) Since ![]() Since y = 18 − 2 · 22 = 10, P is at (2,10).
Since y = 18 − 2 · 22 = 10, P is at (2,10).
(b) Since ![]() Since
Since ![]() Therefore
Therefore
![]()
(c) Let D = the object’s distance from the origin. Then
(d) The object hits the x-axis when y = 18 − 2x2 = 0, or x = 3. Since ![]()
(e) The length of the arc of y = 18 − 2x2 for 0 ≤ x ≤ 3 is given by
16. (a) See graph.
(b) You want to maximize ![]()
See signs analysis.
![]()
The maximum y occurs when t = 1, because y changes from increasing to decreasing there.
(c) Since x(1) = 4arctan 1 = π and ![]() the coordinates of the highest point are (π,6).
the coordinates of the highest point are (π,6).
Since This vector is shown on the graph.
(d) ![]() Thus the particle approaches the point (2π,0).
Thus the particle approaches the point (2π,0).
17. (a) To find the smallest rectangle with sides parallel to the x- and y-axes, you need a rectangle formed by vertical and horizontal tangents as shown in the figure. The vertical tangents are at the x-intercepts, x = ±3. The horizontal tangents are at the points where y (not r) is a maximum. You need, therefore, to maximize
Use the calculator to find that ![]() when θ = 0.7854. Therefore, y = 1.414, so the desired rectangle has dimensions 6 × 2.828.
when θ = 0.7854. Therefore, y = 1.414, so the desired rectangle has dimensions 6 × 2.828.
(b) Since the polar formula for the area is ![]() the area of R (enclosed by r) is
the area of R (enclosed by r) is ![]() which is 14.137.
which is 14.137.
Part B
18. The graph shown below satisfies all five conditions. So do many others!
19. (a) f′ is defined for all x in the interval. Since f is therefore differentiable, it must also be continuous.
(b) Because f′ (2) = 0 and f′ changes from negative to positive there, f has a relative minimum at x = 2. To the left of x = 9, f′ is negative, so f is decreasing as it approaches that endpoint and reaches another relative minimum there.
(c) Because f′ is negative to the right of x = −3, f decreases from its left end-point, indicating a relative max there. Also, f′ (2) = 0 and f′ changes from positive to negative there, so f has a relative minimum at x = 7.
(d) Note that f (7) − f (−3) = ![]() Since there is more area above the x-axis than below the x-axis on [−3,7], the integral is positive and f (7) − f (−3) > 0. This implies that f (7) > f (−3), and that the absolute maximum occurs at x = 7.
Since there is more area above the x-axis than below the x-axis on [−3,7], the integral is positive and f (7) − f (−3) > 0. This implies that f (7) > f (−3), and that the absolute maximum occurs at x = 7.
(e) At x = 2 and also at x = 6, f′ changes from increasing to decreasing, indicating that f changes from concave upward to concave downward at each. At x = 4, f′ changes from decreasing to increasing, indicating that f changes from concave downward to concave upward there. Hence the graph of f has points of inflection at x = 2, 4, and 6.
20. Draw a sketch of the region bounded above by y1 = 8 − 2x2 and below by y2 = x2 − 4, and inscribe a rectangle in this region as described in the question. If (x, y1) and (x, y2) are the vertices of the rectangle in quadrants I and IV, respectively, then the area
A = 2x (y1 − y2) = 2x(12 − 3x2), or A(x) = 24x − 6x3.
Then A′ (x) = 24 − 18x2 = 6(4 − 3x2), which equals 0 when ![]() Check to verify that A ″ (x) < 0 at this point. This assures that this value of x yields maximum area, which is given by
Check to verify that A ″ (x) < 0 at this point. This assures that this value of x yields maximum area, which is given by ![]()
21. The graph of f ′(x) is shown here.
22. The rate of change in volume when the surface area is 54 ft3 is ![]() ft3 /sec.
ft3 /sec.
23. See the figure. The equation of the circle is x2 + y2 = a2; the equation of RS is y = a − x. If y2 is an ordinate of the circle and y1 of the line, then,
24. (a) The region is sketched in the figure. The pertinent points of intersection are labeled.
(b) The required area consists of two parts. The area of the triangle is represented by ![]() and is equal to 1, while the area of the region bounded at the left by x = 1, above by y = x + 4, and at the right by the parabola is represented by
and is equal to 1, while the area of the region bounded at the left by x = 1, above by y = x + 4, and at the right by the parabola is represented by ![]() This equals
This equals
![]()
The required area, thus, equals ![]()
25. (a) 1975 to 1976 and 1978 to 1980.
(b) 1975 to 1977 and 1979 to 1981.
(c) 1976 to 1977 and 1980 to 1981.
26. (a) Since ![]() then, separating variables,
then, separating variables, ![]() Integrating gives
Integrating gives
![]()
and, since v = 20 when t = 0, C = ln 20. Then (1) becomes ln ![]() or, solving for v,
or, solving for v,
![]()
(b) Note that v > 0 for all t. Let s be the required distance traveled (as v decreases from 20 to 5); then
![]()
where, when v = 20, t = 0. Also, when v = 5, use (2) to get ![]() or − ln 4 = −2t. So t = ln 2. Evaluating s in (3) gives
or − ln 4 = −2t. So t = ln 2. Evaluating s in (3) gives
![]()
27. Let (x,y) be the point in the first quadrant where the line parallel to the x-axis meets the parabola. The area of the triangle is given by
A = xy = x(27 − x2) = 27x − x3 for 0 ≤ x ≤ ![]()
Then A′ (x) = 27 − 3x2 = 3(3 + x)(3 − x), and A′ (x) = 0 at x = 3.
Since A′ changes from positive to negative at x = 3, the area reaches its maximum there.
The maximum area is A(3) = 3(27 − 32) = 54.
28.
(b) Using the Ratio Test, you know that the series converges when ![]() that is, when |x| < 1, or −1 < x < 1. Thus, the radius of convergence is 1.
that is, when |x| < 1, or −1 < x < 1. Thus, the radius of convergence is 1.
(c) ![]()
(d) Since the series converges by the Alternating Series Test, the error in the answer for (c) is less absolutely than ![]()
29. From the equations for x and y,
dx = (1 − cos θ) dθ and dy = sin θ dθ.
(a) The slope at any point is given by ![]() which here is
which here is ![]() When
When ![]()
(b) When ![]() The equation of the tangent is
The equation of the tangent is ![]()
30. Both curves are circles with centers at, respectively, (2,0) and ![]() the circles intersect at
the circles intersect at ![]() The common area is given by
The common area is given by
![]()
The answer is 2(π − 2).
31. (a) For f (x) = cos x, f′ (x) = −sin x, f ″ (x) = −cos x, f ′″(x) = sin x, f(4) (x) = cos x, f(5) (x) = −sin x, f(6) (x) = −cos x. The Taylor polynomial of order 4 about 0 is
![]()
Note that the next term of the alternating Maclaurin series for cos x is ![]()
(b) ![]()
(c) The error in (b), convergent by the Alternating Series Test, is less absolutely than the first term dropped:
![]()
32. (a) Since ![]() y = 2t + 1 and x = 4t3 + 6t + 3t.
y = 2t + 1 and x = 4t3 + 6t + 3t.
(b) Since ![]() then, when t = 1, |a| = 36.
then, when t = 1, |a| = 36.
33. See the figure. The required area A is twice the sum of the following areas: that of the limaçon from 0 to ![]() and that of the circle from
and that of the circle from ![]() Thus
Thus
Answers Explained
Multiple-Choice
Part A
1. (C) Use the Rational Function Theorem.
2. (C) Note that ![]() where f (x) = ln x.
where f (x) = ln x.
3. (B) Since y ′ = −2xe−x2, therefore y ″ = −2(x · e −x2 · (−2x) + e −x2). Replace x by 0.
4. (B) ![]()
5. (B) h ′(3) = g ′(f (3)) · f ′(3) = g ′(4) · ![]()
6. (E) Since f ′(x) exists for all x, it must equal 0 for any x0 for which f is a relative maximum, and it must also change sign from positive to negative as x increases through x0. For the given derivative, no x satisfies both of these conditions.
7. (E) By the Quotient Rule (formula (6)),
![]()
8. (A) Here, f ′(x) is e −x (1 − x); f has maximum value when x = 1.
9. (A) Note that (1) on a horizontal line the slope segments are all parallel, so the slopes there are all the same and ![]() must depend only on y; (2) along the x-axis (where y = 0) the slopes are infinite; and (3) as y increases, the slope decreases.
must depend only on y; (2) along the x-axis (where y = 0) the slopes are infinite; and (3) as y increases, the slope decreases.
10. (E) Acceleration is the derivative (the slope) of velocity v; v is largest on 8 < t < 9.
11. (C) Velocity v is the derivative of position; because v > 0 until t = 6 and v < 0 thereafter, the position increases until t = 6 and then decreases; since the area bounded by the curve above the axis is larger than the area below the axis, the object is farthest from its starting point at t = 6.
12. (D) From t = 5 to t = 8, the displacement (the integral of velocity) can be found by evaluating definite integrals based on the areas of two triangles:
![]() Thus, if K is the object’s position at t = 5, then K − 3 = 10 at t = 8.
Thus, if K is the object’s position at t = 5, then K − 3 = 10 at t = 8.
13. (A) The integral is of the form ![]() evaluate
evaluate ![]()
14. (E) ![]()
15. (D) ![]()
16. (A) f (x) = e −x is decreasing and concave upward.
17. (B) Implicit differentiation yields 2yy ′ = 1; so ![]() At a vertical tangent,
At a vertical tangent, ![]() is undefined; y must therefore equal 0 and the numerator be non-zero. The original equation with y = 0 is 0 = x − x3, which has three solutions.
is undefined; y must therefore equal 0 and the numerator be non-zero. The original equation with y = 0 is 0 = x − x3, which has three solutions.
18. (B) Let t = x − 1; then t = −1 when x = 0, t = 5 when x = 6, and dt = dx.
19. (B) The required area, A, is given by the integral
![]()
20. (B) The average value is ![]() The definite integral represents the sum of the areas of a trapezoid and a rectangle:
The definite integral represents the sum of the areas of a trapezoid and a rectangle: ![]() (8 + 3)(6) = 4(7) = 61.
(8 + 3)(6) = 4(7) = 61.
21. (A) Solve the differential equation ![]() by separation of variables:
by separation of variables: ![]() yields y = ce2x. The initial condition yields 1 = ce2 · 2; so c = e −4 and y = e2x−4.
yields y = ce2x. The initial condition yields 1 = ce2 · 2; so c = e −4 and y = e2x−4.
22. (C) Changes in values of f ″ show that f ″′ is constant; hence f ″ is linear, f ′ is quadratic, and f must be cubic.
23. (B) By implicit differentiation, ![]() so the equation of the tangent line at (3,0) is y = −9(x−3).
so the equation of the tangent line at (3,0) is y = −9(x−3).
24. (A) ![]()
25. (D) The graph shown has the x-axis as a horizontal asymptote.
26. (B) Since ![]() to render f (x) continuous at x = 1 f (1) must be defined to be 1.
to render f (x) continuous at x = 1 f (1) must be defined to be 1.
27. (B) f ′(x) = 15x4 − 30x2; f ″(x) = 60x3 − 60x = 60x(x + 1)(x − 1); this equals 0 when x = −1, 0, or 1. Here are the signs within the intervals:
![]()
The graph of f changes concavity at x = −1, 0, and 1.
28. (C) Note that ![]() so f has a critical value at x = −4. As x passes through −4, the sign of f ′ changes from − to +, so f has a local minimum at x = −4.
so f has a critical value at x = −4. As x passes through −4, the sign of f ′ changes from − to +, so f has a local minimum at x = −4.
Part B
29. (B) We are given that (1) f ′(a) > 0; (2)f ″(a) < 0; and (3) G ′(a) < 0. Since G ′(x) = 2 f (x) · f ′(x), therefore G ′(a) = 2f (a) · f (a). Conditions (1) and (3) imply that (4)f (a) < 0. Since G ″(x) = 2[f (x) · f ″ (x) + (f ′(x))2], therefore G″(a) = 2[f (a)f ″ (a) + (f′ (a))2]. Then the sign of G ″(a) is 2[(−) · (−) + (+)] or positive, where the minus signs in the parentheses follow from conditions (4) and (2).
30. (E) Since ![]() it equals 0 for
it equals 0 for ![]() When x = 3, c = 9; this yields a minimum since f ″(3) > 0.
When x = 3, c = 9; this yields a minimum since f ″(3) > 0.
31. (E) Use your calculator to graph velocity against time. Speed is the absolute value of velocity. The greatest deviation from v = 0 is at t = c. With a calculator, c = 9.538.
32. (D) Because f ′ changes from increasing to decreasing, f ″ changes from positive to negative and thus the graph of f changes concavity.
33. (D) ![]() We evaluate this definite integral by finding the area of a trapezoid (negative) and a triangle:
We evaluate this definite integral by finding the area of a trapezoid (negative) and a triangle: ![]() so the tangent line passes through the point (3,−2). The slope of the line is H ′(3) = f (3) = 2, so an equation of the line is y − (−2) = 2(x − 3).
so the tangent line passes through the point (3,−2). The slope of the line is H ′(3) = f (3) = 2, so an equation of the line is y − (−2) = 2(x − 3).
34. (D) The distance is approximately 14(6) + 8(2) + 3(4).
35. (D) ![]() R(x)dx = 166.396.
R(x)dx = 166.396.
36. (A) Selecting an answer for this question from your calculator graph is unwise. In some windows the graph may appear continuous; in others there may seem to be cusps, or a vertical asymptote. Put the calculator aside. Find
![]()
These limits indicate the presence of a jump discontinuity in the function at x = 1.
37. (D) ![]()
![]()
38. (E) ![]()
39. (E) In the figure above, S is the region bounded by y = sec x, the y axis, and y = 4. Send region S about the x-axis. Use washers; then ΔV = π(R2 − r2) Δx. Symmetry allows you to double the volume generated by the first quadrant of S, so V is
![]()
A calculator yields 108.177.
40. (A) The curve falls when f ′(x) < 0 and is concave up when f ″(x) > 0.
41. (B) ![]() To find g ′(0), find x such that f (x) = 0. By inspection,
To find g ′(0), find x such that f (x) = 0. By inspection, ![]()
42. (D) It is given that ![]() you want
you want ![]() where
where ![]()
![]()
Since y2 = 25 −x2, it follows that ![]() and, when x = 3, y = 4
and, when x = 3, y = 4
The function f (x) = 2 sin x + sin 4x is graphed above.
43. (E) Since f (0) = f (π) and f is both continuous and differentiable, Rolle’s Theorem predicts at least one c in the interval such that f ′(c) = 0.
There are four points in [0,π] of the calculator graph above where the tangent is horizontal.
44. (B) Since ![]() a positive constant,
a positive constant, ![]() where c is a positive constant. Then
where c is a positive constant. Then ![]() which is also positive.
which is also positive.
45. (C) If Q(t) is the amount of contaminant in the tank at time t and Q0 is the initial amount, then
![]() = kQ and Q(t) = Q0 ekt.
= kQ and Q(t) = Q0 ekt.
Since Q(1) = 0.8Q0, 0.8Q0 = Q0ek · 1, 0.8 = ek, and
Q(t) = Q0(0.8)t.
We seek t when Q(t) = 0.02Q0. Thus,
0.02Q0 = Q0(0.8)t
and
t ![]() 17.53 min.
17.53 min.
Free-Response
Part A
AB/BC 1. (a) This is the graph of f ′(x).
(b) f is increasing when f ′(x) > 0. The graph shows this to be true in the interval a < x < b. Use the calculator to find a and b (where ex − 2 cos 3x = 0); then a = 0.283 < x < 3.760 = b.
(c) See signs analysis.
![]()
Since f decreases to the right of endpoint x = 0, f has a local maximum at x = 0. There is another local maximum at x = 3.760, because f changes from increasing to decreasing there.
(d) See signs analysis.
Since the graph of f changes concavity at p, q, and r, there are three points of inflection.
AB2. (a) Since April 1 is 3 months from January 1 and June 30 is 3 months later, we form the sum for the interval [3,6]:
![]()
We estimate the company sold 1051 software units during the second quarter.
(b) S(t) = 1.2(2)t/3
(c) ![]() The model’s estimate of 1039 sales is slightly lower, but the two are in close agreement.
The model’s estimate of 1039 sales is slightly lower, but the two are in close agreement.
(d) ![]() the model predicts an average sales rate of 649.2 units per month from January 1, 2012, through December 31, 2012.
the model predicts an average sales rate of 649.2 units per month from January 1, 2012, through December 31, 2012.
Part B
AB 3. (a) At (2,5), ![]() so the tangent line is y − 5 = 4(x − 2).
so the tangent line is y − 5 = 4(x − 2).
Solving for y yields f (x) ≈ 5 + 4(x − 2).
(b) f (2.1) ≈ 5 + 4(2.1 − 2) = 5.4.
(c) The differential equation ![]() is separable:
is separable:
Since f passes through (2,5), it must be true that ![]()
Thus c = 9, and the positive root is used.
The solution is ![]()
(d) ![]()
AB 4. (a) Draw a vertical element of area, as shown.
(b) (i) Use washers; then
(ii) See the figure above.
AB/BC 5.
f is decreasing where f ′(x) < 0, which occurs for −2 < x < 1.
(b) f is decreasing on the interval −2 < x < 1, so there is a minimum at (1, −e2). Note that, as x approaches ±∞, f (x) = e2x(x2 − 2) is always positive. Hence (1,−e2) is the global minimum.
(c) As x approaches +∞, f (x) = e2x(x2 − 2) also approaches +∞. There is no global maximum.
AB/BC 6. (a) S = 4πr2, so ![]() Substitute given values; then
Substitute given values; then
![]()
Since ![]() therefore
therefore ![]() Substituting known values
Substituting known values
gives ![]()
(b) Regions of consistent density are concentric spherical shells. The volume of each shell is approximated by its surface area (4πx2) times its thickness (Δx). The weight of each shell is its density times its volume (g/cm3 · cm3). If, when the snowball is 12 cm in diameter, ΔG is the weight of a spherical shell x cm from the center, then ![]() and the integral to find the weight of the snowball is
and the integral to find the weight of the snowball is
![]()
Answers Explained
Multiple-Choice
Part A
1. (E) ![]()
2. (A) Divide both numerator and denominator by
3. (E) Since eln u = u, y = 1.
4. (D) f (0) = 3, and, ![]()
5. (B) ![]()
6. (D) Here y ′ = 3 sin2 (1 − 2x) cos (1 − 2x) · (−2).
7. (B) ![]()
8. (B) Let s be the distance from the origin: then
Since ![]()
9. (B) For ![]() this limit represents f ′(25).
this limit represents f ′(25).
10. (B) ![]() This definite integral represents the area of a quadrant of the circle x2 + y2 = 1, hence
This definite integral represents the area of a quadrant of the circle x2 + y2 = 1, hence ![]()
11. (C) ![]()
12. (A) The integral is rewritten as
13. (B) ![]()
14. (D) Note:
15. (B) The winning times are positive, decreasing, and concave upward.
16. (E) G(x) = H(x) + ![]() represents the area of a trapezoid.
represents the area of a trapezoid.
17. (C) f ′(x) = 0 for x = 1 and f ″(1) > 0.
18. (B) Solution curves appear to represent odd functions with a horizontal asymptote. In the figure above, the curve in (B) of the question has been superimposed on the slope field.
19. (B) Note that
![]()
20. (C) v is not differentiable at t = 3 or t = 5.
21. (B) Speed is the magnitude of velocity; its graph is shown in the answer explanation for question 20.
22. (B) The average rate of change of velocity is ![]()
23. (E) The curve has vertical asymptotes at x = 2 and x = −2 and a horizontal asymptote at y = −2.
24. (E) The function is not defined at x = −2; ![]() Defining f (−2) = 4 will make f continuous at x = −2, but f will still be discontinuous at x = 1.
Defining f (−2) = 4 will make f continuous at x = −2, but f will still be discontinuous at x = 1.
25. (B)
26. (A)
27. (E) ln (4 + x2) = ln (4 + (−x)2); y ′ ![]()
28. (A) f (x) = ![]() (x sin πx) = πx cos πx + sin πx.
(x sin πx) = πx cos πx + sin πx.
Part B
29. (B) See the figure below. A = ![]()
30. (C) See the figure below. About the x-axis: Washer. ΔV = π(y2 − 12) Δx,
31. (E) We solve the differential equation ![]() by separation:
by separation:
If s = 1 when t = 0, we have C = 1; hence, ![]() when t = 1.
when t = 1.
32. (D)
The roots of f (x) = x2 − 4x − 5 = (x − 5)(x + 1) are x = −1 and 5. Since areas A and B are equal, therefore ![]() Thus,
Thus,
Solving on a calculator gives k (or x) equal to 8.
33. (D) If N is the number of bacteria at time t, then N = 200ekt. It is given that 3 = e10k. When t = 24, N = 200e24k. Therefore N = 200(e10k)2.4 = 200(3)2.4 ![]() 2793 bacteria.
2793 bacteria.
34. (C) Since ![]() For x = 2t − 1, t = 3 yields x = 5 and t = 5 yields x = 9.
For x = 2t − 1, t = 3 yields x = 5 and t = 5 yields x = 9.
35. (C) Using implicit differentiation on the equation
x3 + xy − y2 = 10
yields
The tangent is vertical when ![]() is undefined; that is, when 2y − x = 0.
is undefined; that is, when 2y − x = 0.
Replacing y by ![]() in (1) gives
in (1) gives
![]()
or
4x3 + x2 = 40.
Let y1 = 4x3 + x2 − 40. Inspection of the equation y1 = f (x) = 0 reveals that there is a root near x = 2. Solving on a calculator yields x = 2.074.
36. (D) G ′(x) = f (3x − 1) · 3.
37. (B) Since f changes from positive to negative at t = 3, G ′ does also where 3x − 1 = 3.
38. (D) Using your calculator, evaluate y ′(2).
39. (E) 2(3) + 2(0) + 2(4) + 2(1).
See the figure above.
40. (E)
At x = 3, the answer is 2[2(−2) + 52] = 42.
41. (A) The object is at rest when v(t) = ln(2 − t2) = 0; that occurs when 2−t2 = 1, so t = 1. The acceleration is ![]()
42. (D)
implies that x = 3.
43. (C) ![]() represents the rate of change of the surface area; if y is inversely proportional to x, then,
represents the rate of change of the surface area; if y is inversely proportional to x, then, ![]()
44. (E) The velocity functions are
v1 = −2t sin (t2 + 1)
and
![]()
Graph both functions in [0, 3] × [−5, 5]. The graphs intersect four times during the first 3 sec, as shown in the figure above.
45. (B)
Free-Response
Part A
AB/BC1.
(d) To work with g(x) = f −1(x), interchange x and y:
|
x |
7.6 |
5.7 |
4.2 |
3.8 |
2.2 |
1.6 |
|
g(x) |
2.5 |
3.2 |
3.5 |
4.0 |
4.5 |
5.0 |
![]()
AB 2. Let M = the temperature of the milk at time t. Then
![]()
The differential equation is separable:
where c = e −C.
Find c, using the fact that M = 40° when t = 0:
40 = 68−ce0 means c = 28.
Find k, using the fact that M = 43° when t = 3:
Hence ![]()
Now find t when M = 60°:
Since the phone rang at t = 3, you have 30 min to solve the problem.
Part B
AB 3. (a)
See the figure.
(b) The average value of a function on an interval is the area under the graph of the function divided by the interval width, here ![]()
(c) From part (a) you know that the area of the region is given by ![]() Since
Since ![]() as k increases the area of the region approaches 3π.
as k increases the area of the region approaches 3π.
AB/BC 4. (a) The rectangular slices have base y, height 5y, and thickness along the x-axis:
(b) The disks have radius x and thickness along the y-axis:
![]()
Now we solve for x in terms of y:
(NOTE: Although the shells method is not a required AP topic, another correct integral for this volume is ![]()
AB/BC 5. (a) The volume of the cord is V = πr2h. Differentiate with respect to time, then substitute known values. (Be sure to use consistent units; here, all measurements have been converted to inches.)
(b) Let ![]() represent the angle of elevation and h the height, as shown.
represent the angle of elevation and h the height, as shown.
When h = 80, your distance to the jumper is 100 ft, as shown.
Then
AB/BC 6. (a) ![]() the negative of the area of the shaded rectangle in the figure. Hence F(−2) = − (3)(2) = −6.
the negative of the area of the shaded rectangle in the figure. Hence F(−2) = − (3)(2) = −6.
![]() is represented by the shaded triangles in the figure.
is represented by the shaded triangles in the figure.
(b) ![]() so F(x) = 0 at x = 1.
so F(x) = 0 at x = 1. ![]() because the regions above and below the x-axis have the same area. Hence F(x) = 0 at x = 3.
because the regions above and below the x-axis have the same area. Hence F(x) = 0 at x = 3.
(c) F is increasing where F ′ = f is positive: −2 ≤ x ≤ 2.
(d) The maximum value of F occurs at x = 2, where F ′ = f changes from positive to negative. ![]()
The minimum value of F must occur at one of the endpoints. Since F(−2) = − 6 and F(6) = −3, the minimum is at x = −2.
(e) F has points of inflection where F ″ changes sign, as occurs where F ′ = f goes from decreasing to increasing, at x = 3.
Answers Explained
Multiple-Choice
Part A
1. (E) Here, ![]()
2. (C) The given limit equals ![]() where f (x) = sin x.
where f (x) = sin x.
3. (C) Since f (x) = x ln x,
f ′(x) = 1 + ln x, ![]()
4. (A) Differentiate implicitly to get ![]() Substitute (−1, 1) to find
Substitute (−1, 1) to find ![]() the slope at this point, and write the equation of the tangent: y − 1 = −1(x + 1).
the slope at this point, and write the equation of the tangent: y − 1 = −1(x + 1).
5. (C) f ′(x) = 4x3 − 12x2 + 8x = 4x(x − 1)(x − 2). To determine the signs of f ′(x), inspect the sign at any point in each of the intervals x < 0, 0 < x < 1, 1 < x < 2, and x > 2. The function increases whenever f ′(x) > 0.
6. (C) The integral is equivalent to ![]() where u = 4 + 2sinx.
where u = 4 + 2sinx.
7. (D) Here ![]() which is zero for x = e. Since the sign of y ′ changes from positive to negative as x increases through e, this critical value yields a relative maximum. Note that
which is zero for x = e. Since the sign of y ′ changes from positive to negative as x increases through e, this critical value yields a relative maximum. Note that ![]()
8. (E) Since ![]() is always positive, there are no reversals in motion along the line.
is always positive, there are no reversals in motion along the line.
9. (E) The slope field suggests the curve shown above as a particular solution.
10. (E) Since ![]() is discontinuous at x = 1; the domain of F is therefore x > 1. On [2, 5] f (x) < 0, so
is discontinuous at x = 1; the domain of F is therefore x > 1. On [2, 5] f (x) < 0, so ![]() which is positive for x > 1.
which is positive for x > 1.
11. (B) In the graph above, W(t), the water level at time t, is a cosine function with amplitude 6 ft and period 12hr:
12. (B) Solve the differential equation ![]() Use x = −1,
Use x = −1,
y = 2 to determine ![]()
13. (D) ![]()
14. (A) ![]()
15. (C) G ′(2) = 4, so G (x) ![]() 4(x − 2) + 5.
4(x − 2) + 5.
16. (E) ![]() See the figure below.
See the figure below.
17. (E) Note that ![]()
18. (B) Note that (0, 0) is on the graph, as are (1, 2) and (−1, −2). So only (B) and (E) are possible. Since ![]() only (B) is correct.
only (B) is correct.
19. (D) See the figure.
20. (E) ![]()
21. (D) In (D), f (x) is not defined at x = 0. Verify that each of the other functions satisfies both conditions of the Mean Value Theorem.
22. (E) The signs within the intervals bounded by the critical points are given below.
![]()
Since f changes from increasing to decreasing at x = −3, f has a local maximum at −3. Also, f has a local minimum at x = 0, because it is decreasing to the left of zero and increasing to the right.
23. (B) Since ln ![]() then
then
![]()
24. (D) ![]()
25. (B) As seen from the figure, ![]() where y = 2r,
where y = 2r,
26. (C) From the figure below,
27. (A) Since the degrees of numerator and denominator are the same, the limit as x→∞ is the ratio of the coefficients of the terms of highest degree: ![]()
28. (A) We see from the figure that ΔA = (y2 − y1) Δx;
Part B
29. (A) Let u = x2 + 2. Then
![]()
and
![]()
30. (E) ![]() will increase above the half-full level (that is, the height of the water will rise more rapidly) as the area of the cross section diminishes.
will increase above the half-full level (that is, the height of the water will rise more rapidly) as the area of the cross section diminishes.
31. (B) Since ![]()
32. (C)
The initial condition H(0) = 120 shows c = 50. Evaluate H(10).
33. (B) Let P be the amount after t years. It is given that ![]() The solution of this differential equation is P = 4000e0.08t + C, where P (0) = 4000 yields C = 0. The answer is 4000e(0.08) ·10.
The solution of this differential equation is P = 4000e0.08t + C, where P (0) = 4000 yields C = 0. The answer is 4000e(0.08) ·10.
34. (C) The inverse of y = 1 + ex is x = 1 + ey or y = ln (x − 1); (x − 1) must be positive.
35. (E) Speed is the magnitude of velocity: |v(8)| = 4.
36. (E) For 3 < t < 6 the object travels to the right ![]() At t = 7 it has returned 1 unit to the left; by t = 8, 4 units to the left.
At t = 7 it has returned 1 unit to the left; by t = 8, 4 units to the left.
37. (C) Use disks: ΔV = πr2Δy = πx2Δy, where x = ln y. Use your calculator to evaluate ![]()
38. (B) If ![]() then u2 = x − 2, x = u2 + 2, dx = 2u du. When x = 3, u = 1; when x = 6, u = 2.
then u2 = x − 2, x = u2 + 2, dx = 2u du. When x = 3, u = 1; when x = 6, u = 2.
39. (A) The tangent line passes through points (8,1) and (0,3). Its slope, ![]() is f ′(8).
is f ′(8).
40. (A) Graph f ″ in [0,6] × [−5,10]. The sign of f ″ changes only at x = a, as seen in the figure.
41. (C) In the graph below, the first rectangle shows 2 tickets sold per minute for 15 min, or 30 tickets. Similarly, the total is 2(15) + 6(15) + 10(15) + 4(15).
42. (B) Graph both functions in [−8,8] × [−5,5]. At point of intersection Q, both are decreasing. Tracing reveals x ![]() −4 at Q. If you zoom in on the curves at x = T, you will note that they do not actually intersect there.
−4 at Q. If you zoom in on the curves at x = T, you will note that they do not actually intersect there.
43. (D) Counterexamples are, respectively, for (A), f (x) = |x|, c = 0; for (B), f (x) = x3, c = 0; for (C), f (x) = x4, c = 0; for (E), f (x) = x2 on (−1, 1).
44. (E) f ′(x) > 0; the curve shows that f ′ is defined for all a < x < b, so f is differentiable and therefore continuous.
45. (D) Consider the blast area as a set of concentric rings; one is shown in the figure. The area of this ring, which represents the region x meters from the center of the blast, may be approximated by the area of the rectangle shown. Since the number of particles in the ring is the area times the density, ΔP = 2πx · Δx · N(x). To find the total number of fragments within 20 m of the point of the explosion, integrate: ![]()
Free-Response
Part A
AB1. (a) Since x2y − 3y2 = 48,
(b) At (5,3), ![]() so the equation of the tangent line is
so the equation of the tangent line is
![]()
(c) ![]()
(d) Horizontal tangent lines have ![]() This could happen only if
This could happen only if
2xy = 0, which means that x = 0 or y = 0.
If x = 0, 0y − 3y2 = 48, which has no real solutions.
If y = 0, x2 · 0 − 3 · 02 = 48, which is impossible. Therefore, there are no horizontal tangents.
AB/BC2. (a)
(b) The average value of a function is the integral across the given interval divided by the interval width. Here Estimate the value of the integral using trapezoid rule T with values from the table and Δt = 4:
Hence
Avg(W) ![]() 35.167 ft.
35.167 ft.
(c) For ![]() use your calculator to evaluate F ′(16) ≈ −0.749. After 16 hr, the river depth is dropping at the rate of 0.749 ft/hr.
use your calculator to evaluate F ′(16) ≈ −0.749. After 16 hr, the river depth is dropping at the rate of 0.749 ft/hr.
Part B
AB/BC 3. (a)
(b) Let h = the hypotenuse of an isosceles right triangle, as shown in the figure. Then each leg of the triangle is ![]() and its area is
and its area is ![]()
An element of volume is
![]()
and thus ![]()
AB/BC 4. (a) ![]() so v(0) = 0 and v(10) = 48.
so v(0) = 0 and v(10) = 48.
The average acceleration is ![]()
Acceleration ![]()
![]()
(b) Since Q’s acceleration, for all t in 0 ≤ t ≤ 5, is the slope of its velocity graph, ![]()
(c) Find the distance each auto has traveled. For P, the distance is
For auto Q, the distance is the total area of the triangle and trapezoid under the velocity graph shown below, namely,
Auto P won the race.
AB5. (a) Using the differential equation, evaluate the derivative at each point, then sketch a short segment having that slope. For example, at (−1, −1), ![]() = 2(−1)((−1)2 + 1) − 4; draw a steeply decreasing segment at (−1, −1). Repeat this process at each of the other points. The result follows.
= 2(−1)((−1)2 + 1) − 4; draw a steeply decreasing segment at (−1, −1). Repeat this process at each of the other points. The result follows.
(b) The differential equation ![]() is separable.
is separable.
It is given that f passes through (0,1), so 1 = tan (02 + c) and ![]()
The solution is f(x) = tan ![]()
The particular solution must be differentiable on an interval containing the initial point (0,1). The tangent function has vertical asymptotes at ![]() hence:
hence:
![]() (Since x2 ≥ 0, we ignore the left inequality.)
(Since x2 ≥ 0, we ignore the left inequality.)
AB 6. (a) ![]() f (t)dt = F(2) = 4.
f (t)dt = F(2) = 4.
(b) One estimate might be ![]() f (t)dt F(7) − F(2) = 2 − 4 = −2.
f (t)dt F(7) − F(2) = 2 − 4 = −2.
(c) f (x) = F′ (x); F′ (x) = 0 at = 4.
(d) f ′(x) = F ″(x). F ″ is negative when F is concave downward, which is true for the entire interval 0 < x < 8.
(e)
Then the graph of G is the graph of F translated downward 4 units.
Answers Explained
The explanations for questions not given below will be found in the answer section for AB Practice Examination 1. Identical questions in Section I of Practice Examinations AB1 and BC1 have the same number. For example, explanations of the answers for Question 1, not given below, will be found in Section I of Calculus AB Practice Examination 1, Answer 1.
Multiple-Choice
Part A
3. (E) Here,
6. (D) ![]()
12. (B) Note that, when x = 2 sin θ, x2 = 4 sin2 θ, dx = 2 cos dθ, and ![]() 2 cos θ. Also,
2 cos θ. Also,
13. (C) The given integral is equivalent to ![]()
The figure shows the graph of f (x) = 1 − |x| on [−1,1].
The area of triangle PQR is equal to ![]()
14. (B) Let y = x1/x; then take logarithms. ln ![]() As x → ∞ the fraction is of the form ∞/∞.
As x → ∞ the fraction is of the form ∞/∞. ![]() So y → e0 or 1.
So y → e0 or 1.
17. (E) Separating variables yields ![]() so ln y = −ln cos x + C. With y = 3 when x = 0, C = ln 3. The general solution is therefore (cos x) y = 3. When
so ln y = −ln cos x + C. With y = 3 when x = 0, C = ln 3. The general solution is therefore (cos x) y = 3. When ![]()
![]() and y = 6.
and y = 6.
20. (A) Represent the coordinates parametrically as (r cos θ, r sin θ). Then
Note that ![]() sin 2θ, and evaluate
sin 2θ, and evaluate ![]() (Alternatively, write x = cos 2θ cos θ and y = cos 2θ sin θ to find
(Alternatively, write x = cos 2θ cos θ and y = cos 2θ sin θ to find ![]() )
)
21. (D) Note that v is negative from t = 0 to t = 1, but positive from t = 1 to t = 2. Thus the distance traveled is given by
![]()
22. (E) Separating variables yields y dy = (1 − 2x) dx. Integrating gives
![]()
24. (A) Use parts; then u = x, dv = cos x dx; du = dx,v = sin x. Thus,
25. (C) Using the above figure, consider a thin slice of the oil, and the work Δw done in raising it to the top of the tank:
26. (A) By Taylor’s Theorem, the coefficient is ![]() For
For ![]() and
and ![]() making the coefficient
making the coefficient ![]()
27. (D) Here,
![]()
28. (D) Evaluate
![]()
Part B
29. (E) The vertical component of velocity is
![]() = 4 cos t + 12 cos 12t.
= 4 cos t + 12 cos 12t.
Evaluate at t = 1.
30. (B) At t = 0, we know H = 120, so 120 = 70 + ke −0.4(0), and thus k = 50. The average temperature for the first 10 minutes is ![]()
36. (B)
The required volume is 0.592.
38. (C) The Maclaurin expansion is
![]()
The Lagrange remainder R, after n terms, for some c in the interval |x| ![]() 2, is
2, is
![]()
Since R is greatest when c = 2, n needs to satisfy the inequality
![]()
Using a calculator to evaluate ![]() successively at various integral values of x gives y(8) > 0.01, y(9) > 0.002, y(10) < 3.8 × 10 −4 < 0.0004. Thus we achieve the desired accuracy with a Taylor polynomial at 0 of degree at least 10.
successively at various integral values of x gives y(8) > 0.01, y(9) > 0.002, y(10) < 3.8 × 10 −4 < 0.0004. Thus we achieve the desired accuracy with a Taylor polynomial at 0 of degree at least 10.
39. (E) On your calculator, graph one arch of the cycloid for t in [0, 2π] and (x,y) in [0, 7] × [−1, 3]. Use disks; then the desired volume is
40. (C) In the first quadrant, both x and y must be positive; x(t) = et is positive for all t, but y(t) = 1 − t2 is positive only for −1 < t < 1. The arc length is
41. (D) Chapter 10.
44. (E) Each is essentially a p-series, ![]() Such a series converges only if p > 1.
Such a series converges only if p > 1.
Free-Response
Part A
1. See solution for AB-1, Free-Response in AB Practice Exam One.
2. See solution for AB2, Free-Response in AB Practice Exam One.
Part B
3. (a) Because ![]() which never equals zero, the object is never at rest.
which never equals zero, the object is never at rest.
(b) ![]() so the object’s speed is
so the object’s speed is
Position is the antiderivative of velocity
Since P(0) = (0,0), arcsin ![]() and thus c = 0.
and thus c = 0.
![]()
Since P(0) = (0,0), ![]() and thus c = 2.
and thus c = 2.
Then
(c) Solving ![]() for t yields t = 2 sinx. Therefore
for t yields t = 2 sinx. Therefore
![]()
Since 0 ≤ t ≤ 1 means ![]() then cos x > 0, so y = 2 − 2cos x.
then cos x > 0, so y = 2 − 2cos x.
4. (a) To write the Maclaurin series for f (x) = ln(e+x), use Taylor’s theorem at x = 0.
![]()
(b) By the Ratio Test, the series converges when
Thus, the radius of convergence is e.
5. (a) To find the maximum rate of growth, first find the derivative of
A signs analysis shows that ![]() changes from positive to negative there, confirming that
changes from positive to negative there, confirming that ![]() is at its maximum when there are 300 trout.
is at its maximum when there are 300 trout.
(b) The differential equation ![]() is separable.
is separable.
![]()
To integrate the left side of this equation, use the method of partial fractions.
(c) In (a) the population was found to be growing the fastest when F = 300. Then:
6. See solution for AB/BC 6, Free-Response in AB Practice Exam One.
Answers Explained
The explanations for questions not given below will be found in the answer section for AB Practice Exam 2. Identical questions in Section I of Practice Examinations AB2 and BC2 have the same number. For example, explanations of the answers for Questions 4 and 5, not given below, will be found in Section I of Calculus AB Practice Exam 2, Answers 4 and 5.
Multiple-Choice
Part A
1. (B) Since ![]() to render f (x) continuous at x = 1, define f (1) to be 1.
to render f (x) continuous at x = 1, define f (1) to be 1.
2. (C) Note that
where you let ![]()
3. (C) Obtain the first few terms of the Maclaurin series generated by ![]()
6. (C) Here,
and the magnitude of the acceleration, |a|, is given by
7. (B) ![]()
By the Ratio Test the series converges when
Checking the endpoints, we find:
![]() is the alternating harmonic series, which converges.
is the alternating harmonic series, which converges.
![]() is the harmonic series, which diverges.
is the harmonic series, which diverges.
Hence the interval of convergence is 0 ≤ x < 2.
10. (C) ![]()
11. (D) We integrate by parts using u = ln x, dv = dx; then ![]() v = x, and
v = x, and
13. (C) Use the method of partial fractions, letting
Letting x = 0, we find A = 2, and letting x = 3 yields B = −1.
Now ![]()
19. (E) At (2,1), ![]() Use Δx = 0.1; then Euler’s method moves to (2.1, 1 + 3(0.1)).
Use Δx = 0.1; then Euler’s method moves to (2.1, 1 + 3(0.1)).
At (2.1, 1.3), ![]() so the next point is (2.2, 1.3 + 3.4(0.1)).
so the next point is (2.2, 1.3 + 3.4(0.1)).
22. (D) Separate variables to get ![]() and integrate to get ln y = ln x + C.
and integrate to get ln y = ln x + C.
Since y = 3 when x = 1, C = ln 3. Then y = e(ln x + ln 3) = eln x · eln 3 = 3x.
23. (D) The generating circle has equation x2 + y2 = 4. Using disks, the volume, V, is given by
24. (C) ![]() The integrals in (A), (B), and (D) all diverge to infinity.
The integrals in (A), (B), and (D) all diverge to infinity.
26. (D) Using separation of variables:
Given initial point (0,0), we have 0 = tan(0 + C); hence C = 0 and the particular solution is y = tan(x).
Because this function has vertical asymptotes at ![]() and the particular solution must be differentiable in an interval containing the initial point x = 0, the domain is
and the particular solution must be differentiable in an interval containing the initial point x = 0, the domain is ![]()
28. (D)
Part B
30. (C) Since the equation of the spiral is r = ln![]() , use the polar mode. The formula for area in polar coordinates is
, use the polar mode. The formula for area in polar coordinates is
![]()
Therefore, calculate
![]()
The result is 3.743.
31. (D) When y = 2t = 4, we have t = 2, so the line passes through point F(2) = (5,4).
Also so at t = 2 the slope of the tangent line is
![]()
An equation for the tangent line is y − 4 = ln 2(x − 5).
32. (A) I. ![]() converges by the Ratio Test:
converges by the Ratio Test: ![]()
II. ![]() diverges by the nth Term Test:
diverges by the nth Term Test: ![]()
III. ![]() diverges by the Comparison Test:
diverges by the Comparison Test: ![]() diverges.
diverges.
38. (E) If Q0 is the initial amount of the substance and Q is the amount at time t, then
and ![]() Thus k = 0.08664. Using a calculator, find t when
Thus k = 0.08664. Using a calculator, find t when ![]()
![]() so t ≈ 12.68. Don’t round off k too quickly.
so t ≈ 12.68. Don’t round off k too quickly.
40. (A) See figure below.
![]()
41. (D) See figure below.
42. (E) ![]()
43. (C) The endpoints of the arc are ![]() and (e,1). The arc length is given by
and (e,1). The arc length is given by
44. (B) Find k such that cos x will differ from by less than 0.001 at x = k.
Solve
![]()
which yields x or k = 0.394.
Free-Response
Part A
1. See solution for AB-1, Free-Response in AB Practice Exam Two.
2. (a) Position is the antiderivative of ![]()
To find c, substitute the initial condition that x = 1 when t = 0:
![]()
At t = 2, x = 2 arctan ![]() and the position of the object is
and the position of the object is
(c) The distance traveled is the length of the arc of y = x2 + 2 in the interval ![]()
![]()
Part B
3. (a)
(b) By the Ratio Test, the series converges when
Thus, the radius of convergence is 2.
(c) ![]() is an alternating series. Since
is an alternating series. Since ![]() and
and ![]() it converges by the Alternating Series Test. Therefore the error is less than the magnitude of the first omitted term:
it converges by the Alternating Series Test. Therefore the error is less than the magnitude of the first omitted term:
![]()
4. See solution for AB/BC 4, Free-Response in AB Practice Exam Two.
5. See solution for AB-5, Free-Response in AB Practice Exam Two.
6. See solution for AB-6, Free-Response in AB Practice Exam Two.
Answers Explained
The explanations for questions not given below will be found in the answer section for AB Practice Exam 3. Identical questions in Section I of Practice Examinations AB3 and BC3 have the same number. For example, explanations of the answers for Questions 1 and 2, not given below, will be found in Section I of Calculus AB Practice Exam 3, Answers 1 and 2.
Multiple-Choice
Part A
3. (B) The series ![]() is geometric with
is geometric with ![]() it converges
it converges
to
5. (D) ![]() is the sum of an infinite geometric series with first term 1 and common ratio −2x. The series is 1 − 2x + 4x2 − 8x3 + 16x4 − ….
is the sum of an infinite geometric series with first term 1 and common ratio −2x. The series is 1 − 2x + 4x2 − 8x3 + 16x4 − ….
6. (A) Assume that
![]()
Then
2x2 − x + 4 = A(x − 1)(x − 2) + Bx(x − 2) + Cx(x − 1).
Since you are looking for B, let x = 1:
2(1) − 1 + 4 = 0 + B(−1) + 0; B = −5.
8. (B) Since ex ![]() 1 + x,e −x2
1 + x,e −x2 ![]() 1 − x2. So
1 − x2. So
12. (A) ![]()
17. (E)
18. (D) See the figure below, which shows that the length of a semicircle of radius 2 is needed here. The answer can, of course, be found by using the formula for arc length:
20. (E) ![]() using long division,
using long division, ![]()
22. (C) Using parts we let u = x2, dv = exdx; then du = 2x dx, v = ex, and
![]()
We use parts again with u = x, dv = exdx; then du = dx, v = ex, and
![]()
Now ![]()
23. (E) ![]() will increase above the half-full level (that is, the height of the water will rise more rapidly) as the area of the cross section diminishes.
will increase above the half-full level (that is, the height of the water will rise more rapidly) as the area of the cross section diminishes.
27. (A) The required area is lined in the figure below.
28. (D) Note that f (x) = x + 6 if x ≠ 6, that f (6) = 12, and that ![]() So f is defined and continuous at x = 6.
So f is defined and continuous at x = 6.
Part B
29. (E) The velocity functions are
![]()
When these functions are graphed on a calculator, it is clear that they intersect four times during the first 3 sec, as shown below.
30. (C) Changes in values of f ″ show that f ″′ may be constant. Hence f ″ may be linear, so f′ could be quadratic and thus f cubic.
31. (C) Expressed parametrically, x = sin3θ cosθ, y = sin3θ sin θ. ![]() is undefined where
is undefined where ![]() = −sin3θ sin θ + 3 cos 3θ cos θ = 0.
= −sin3θ sin θ + 3 cos 3θ cos θ = 0.
Use your calculator to solve for θ.
34. (D) See the figure below.
The roots of f (x) = x2 − 4x − 5 = (x − 5)(x + 1) are x = −1 and 5. Since areas A and B are equal, therefore, ![]() Thus,
Thus,
A calculator yields k = 8.
37. (C) It is given that ![]() An antiderivative is
An antiderivative is ![]()
Since ![]() the constants are c1 = c2 = 1. The object’s speed is
the constants are c1 = c2 = 1. The object’s speed is ![]()
Use a calculator to find that the object’s maximum speed is 2.217.
39. (D) Use the Ratio Test:
which is less than 1 if −3 < x < 3. When x = −3, the convergent alternating harmonic series is obtained.
40. (A) Since ![]() and since v(0) = 1, C = 1. Then
and since v(0) = 1, C = 1. Then ![]() yields s = t3 + t + C ′, and you can let s(0) = 0. Then you want s(3).
yields s = t3 + t + C ′, and you can let s(0) = 0. Then you want s(3).
41. (A) Arc length is given by ![]() Here the integrand
Here the integrand ![]() implies that
implies that ![]() hence, y = 3 ln x + C. Since the curve contains (1,2), 2 = 3 ln 1 + C, which yields C = 2.
hence, y = 3 ln x + C. Since the curve contains (1,2), 2 = 3 ln 1 + C, which yields C = 2.
42. (E)
At x = 3; the answer is 2[2(−2) + 52] = 42.
43. (D) Counterexamples are, respectively, for (A), f (x) = |x|, c = 0; for (B), f (x) = x3, c = 0; for (C), f (x) = x4, c = 0; for (E), f (x) = x2 on (−1, 1).
Free-Response
Part A
1.
(a) The following table shows x- and y-components of acceleration, velocity, and position:
The last line in the table is the answer to part (a).
(b) To determine how far above the ground the ball is when it hits the wall, find out when x = 315, and evaluate y at that time.
(c) The ball’s speed at the moment of impact in part (b) is |v(t)| evaluated at ![]()
2. See solution for AB-2, Free-Response in AB Practice Exam Three.
Part B
3. See solution for AB/BC 3, Free-Response in AB Practice Exam Three.
4. See solution for AB-4, pages Free-Response in AB Practice Exam Three.
5. (a) The table below is constructed from the information given in Question 5 in BC Practice Exam Three.
|
n |
f (n) (5) |
|
|
0 |
2 |
2 |
|
1 |
−2 |
−2 |
|
2 |
−1 |
|
|
3 |
6 |
1 |
![]()
(c) Use Taylor’s theorem around x = 0.
|
n |
g(n)(x) |
g(n)(0) |
|
|
0 |
f (2x + 5) |
f (5) = 2 |
2 |
|
1 |
2f′ (2x + 5) |
2f′ (5) = 2(−2) = −4 |
−4 |
|
2 |
4f ″ (2x + 5) |
4f ″ (5) = 4(−1) = −4 |
−2 |
|
3 |
8f′″(2x + 5) |
8f′″(5) = 8(6) = 48 |
8 |
g(x) ≈ 2 − 4x − 2x2 + 8x3.
6. (a) At (−1,8), ![]() so the tangent line is
so the tangent line is
y − 8 = 5(x − (−1)). Therefore f (x) ≈ 8 + 5(x + 1).
(b) f (3) ≈ 8 + 5(0 + 1) = 13.
(c) At (−1,8), ![]() For Δx = 0.5, Δy = 0.5(5) = 2.5, so move to
For Δx = 0.5, Δy = 0.5(5) = 2.5, so move to
(−1 + 0.5, 8 + 2.5) = (−0.5,10.5).
At (−0.5,10.5), For Δx = 0.5, Δy = 0.5(8) = 4, so move to (−0.5 + 0.5, 10.5 + 4).
Thus f (0) ≈ 14.5.