Calculus For Dummies, 2nd Edition (2014)
Part I. An Overview of Calculus
Chapter 2. The Two Big Ideas of Calculus: Differentiation and Integration - plus Infinite Series
IN THIS CHAPTER
Delving into the derivative: It’s a rate and a slope
Investigating the integral — addition for experts
Infinite series: Achilles versus the tortoise — place your bets
This book covers the two main topics in calculus — differentiation and integration — as well as a third topic, infinite series. All three topics touch the earth and the heavens because all are built upon the rules of ordinary algebra and geometry and all involve the idea of infinity.
Defining Differentiation
Differentiation is the process of finding the derivative of a curve. And the word “derivative” is just the fancy calculus term for the curve’s slope or steepness. And because the slope of a curve is equivalent to a simple rate (like miles per hour or profit per item), the derivative is a rate as well as a slope.
The derivative is a slope
In algebra, you learned about the slope of a line — it’s equal to the ratio of the rise to the run. In other words, ![]() . See Figure 2-1. Let me guess: A sudden rush of algebra nostalgia is flooding over you.
. See Figure 2-1. Let me guess: A sudden rush of algebra nostalgia is flooding over you.
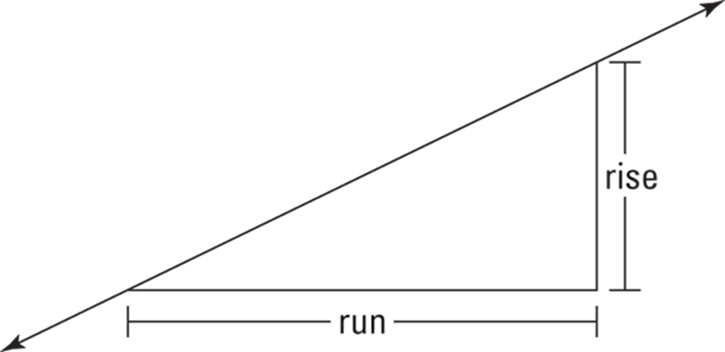
FIGURE 2-1: The slope of a line equals the rise over the run.
In Figure 2-1, the rise is half as long as the run, so the line has a slope of 1/2.
On a curve, the slope is constantly changing, so you need calculus to determine its slope. See Figure 2-2.
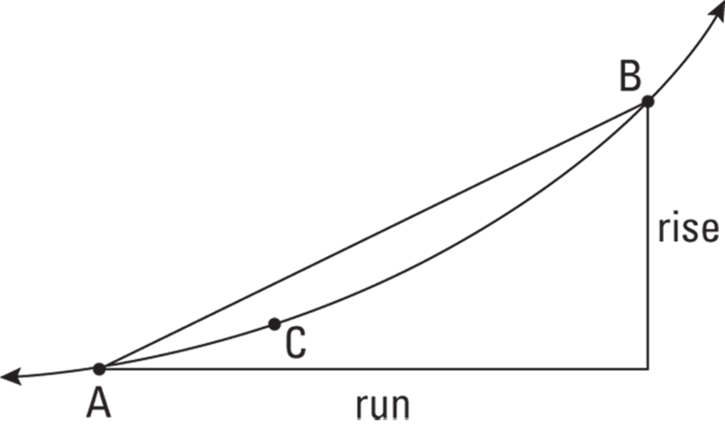
FIGURE 2-2: The slope of a curve isn’t so simple.
Just like the line in Figure 2-1, the straight line between A and B in Figure 2-2 has a slope of 1/2. And the slope of this line is the same at every point between A and B. But you can see that, unlike the line, the steepness of the curve is changing between A and B. At A, the curve is less steep than the line, and at B, the curve is steeper than the line. What do you do if you want the exact slope at, say, point C? Can you guess? Time’s up. Answer: You zoom in. See Figure 2-3.
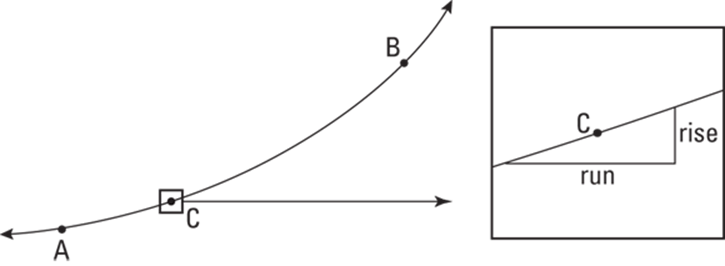
FIGURE 2-3: Zooming in on the curve.
When you zoom in far enough — really far, actually infinitely far — the little piece of the curve becomes straight, and you can figure the slope the old-fashioned way. That’s how differentiation works.
The derivative is a rate
Because the derivative of a curve is the slope — which equals ![]() or rise per run — the derivative is also a rate, a this per that like miles per hour or gallons per minute (the name of the particular rate simply depends on the units used on the x- and y-axes). The two graphs in Figure 2-4 show a relationship between distance and time — they could represent a trip in your car.
or rise per run — the derivative is also a rate, a this per that like miles per hour or gallons per minute (the name of the particular rate simply depends on the units used on the x- and y-axes). The two graphs in Figure 2-4 show a relationship between distance and time — they could represent a trip in your car.
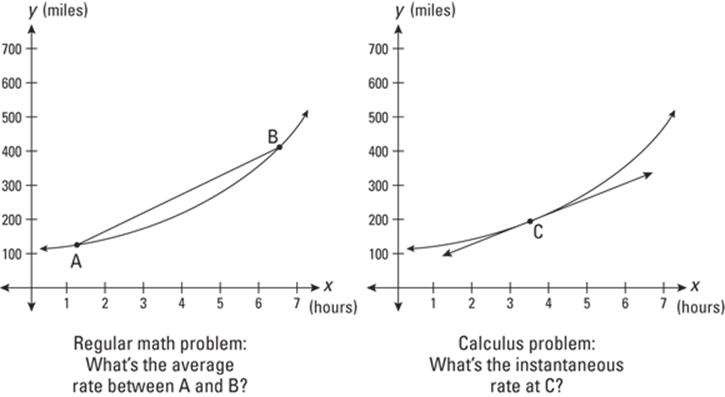
FIGURE 2-4: Average rate and instantaneous rate.
A regular algebra problem is shown on the left in Figure 2-4. If you know the x- and y-coordinates of points A and B, you can use the slope formula ![]() to calculate the slope between A and B, and, in this problem, that slope gives you the average rate in miles per hour for the interval from A to B.
to calculate the slope between A and B, and, in this problem, that slope gives you the average rate in miles per hour for the interval from A to B.
For the problem on the right, on the other hand, you need calculus. (You can’t use the slope formula because you’ve only got one point.) Using the derivative of the curve, you can determine the exact slope or steepness at point C. Just to the left of C on the curve, the slope is slightly lower, and just to the right of C on the curve, the slope is slightly higher. But precisely at C, for a single infinitesimal moment, you get a slope that’s different from the neighboring slopes. The slope for this single infinitesimal point on the curve gives you the instantaneous rate in miles per hour at point C.
Investigating Integration
Integration is the second big idea in calculus, and it’s basically just fancy addition. Integration is the process of cutting up an area into tiny sections, figuring the areas of the small sections, and then adding up the little bits of area to get the whole area. Figure 2-5 shows two area problems — one that you can do with geometry and one where you need calculus.
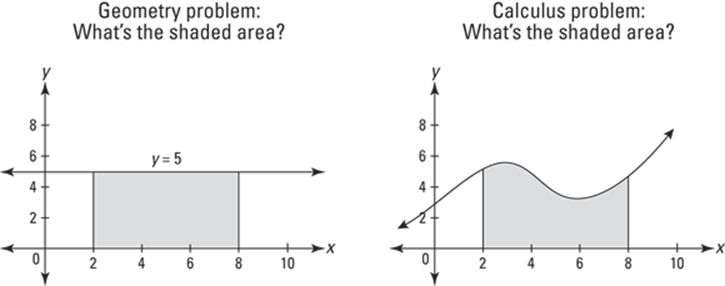
FIGURE 2-5: If you can’t determine the area on the left, hang up your calculator.
The shaded area on the left is a simple rectangle, so its area, of course, equals length times width. But you can’t figure the area on the right with regular geometry because there’s no area formula for this funny shape. So what do you do? Why, zoom in, of course. Figure 2-6 shows the top portion of a narrow strip of the weird shape blown up to several times its size.
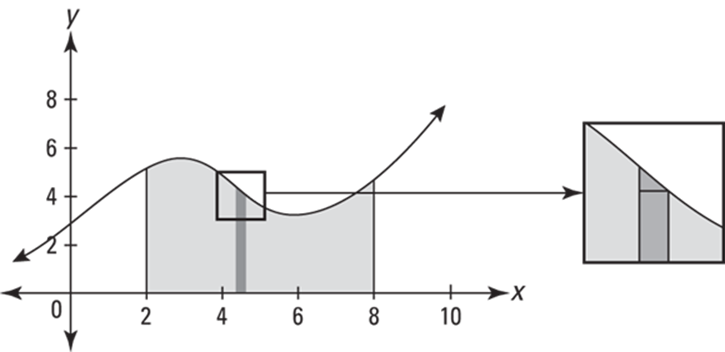
FIGURE 2-6: For the umpteenth time, when you zoom in, the curve becomes straight.
When you zoom in as shown in Figure 2-6, the curve becomes practically straight, and the further you zoom in, the straighter it gets. After zooming in, you get the shape on the right in Figure 2-6, which is practically an ordinary trapezoid (its top is still slightly curved). Well, with the magic of integration, you zoom in infinitely close (sort of — you can’t really get infinitely close, right?). At that point, the shape is exactly an ordinary trapezoid — or, if you want to get really basic, it’s a triangle sitting on top of a rectangle. Because you can compute the areas of rectangles, triangles, and trapezoids with ordinary geometry, you can get the area of this and all the other thin strips and then add up all these areas to get the total area. That’s integration.
Figure 2-7 has two graphs of a city’s electrical energy consumption on a typical summer day. The horizontal axes show the number of hours after midnight, and the vertical axes show the amount of power (in kilowatts) used by the city at different times during the day.
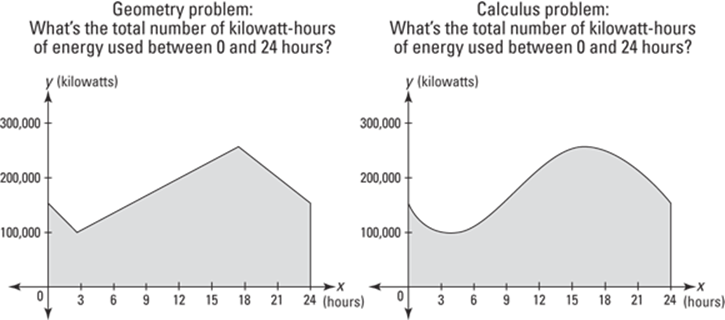
FIGURE 2-7: Total kilowatt-hours of energy used by a city during a single day.
The crooked line on the left and the curve on the right show how the number of kilowatts of power depends on the time of day. In both cases, the shaded area gives the number of kilowatt-hours of energy consumed during a typical 24-hour period. The shaded area in the oversimplified and unrealistic problem on the left can be calculated with regular geometry. But the true relationship between the amount of power used and the time of day is more complicated than a crooked straight line. In a realistic energy-consumption problem, you’d get something like the graph on the right. Because of its weird curve, you need calculus to determine the shaded area. In the real world, the relationship between different variables is rarely as simple as a straight-line graph. That’s what makes calculus so useful.
Sorting Out Infinite Series
Infinite series deal with the adding up of an infinite number of numbers. Don’t try this on your calculator unless you’ve got a lot of extra time on your hands. Here’s a simple example. The following sequence of numbers is generated by a simple doubling process — each term is twice the one before it:
1, 2, 4, 8, 16, 32, 64, 128, …
The infinite series associated with this sequence of numbers is just the sum of the numbers:
1 + 2 + 4 + 8 + 16 + 32 + 64 + 128 + …
Divergent series
The preceding series of doubling numbers is divergent because if you continue the addition indefinitely, the sum will grow bigger and bigger without limit. And if you could add up “all” the numbers in this series — that’s all infinitely many of them — the sum would be infinity. Divergent usually means — there are exceptions — that the series adds up to infinity.
Divergent series are rather uninteresting because they do what you expect. You keep adding more numbers, so the sum keeps growing, and if you continue this forever, the sum grows to infinity. Big surprise.
Convergent series
Convergent series are much more interesting. With a convergent series, you also keep adding more numbers, the sum keeps growing, but even though you add numbers forever and the sum grows forever, the sum of all the infinitely many terms is a finite number. This surprising result brings me to Zeno’s famous paradox of Achilles and the tortoise. (That’s Zeno of Elea, of course, from the 5th century B.c.)
Achilles is racing a tortoise — some gutsy warrior, eh? Our generous hero gives the tortoise a 100-yard head start. Achilles runs at 20 mph; the tortoise “runs” at 2 mph. Zeno used the following argument to “prove” that Achilles will never catch or pass the tortoise. If you’re persuaded by this “proof,” by the way, you’ve really got to get out more.
Imagine that you’re a journalist covering the race for Spartan Sports Weekly, and you’re taking a series of photos for your article. Figure 2-8 shows the situation at the start of the race and your first two photos.
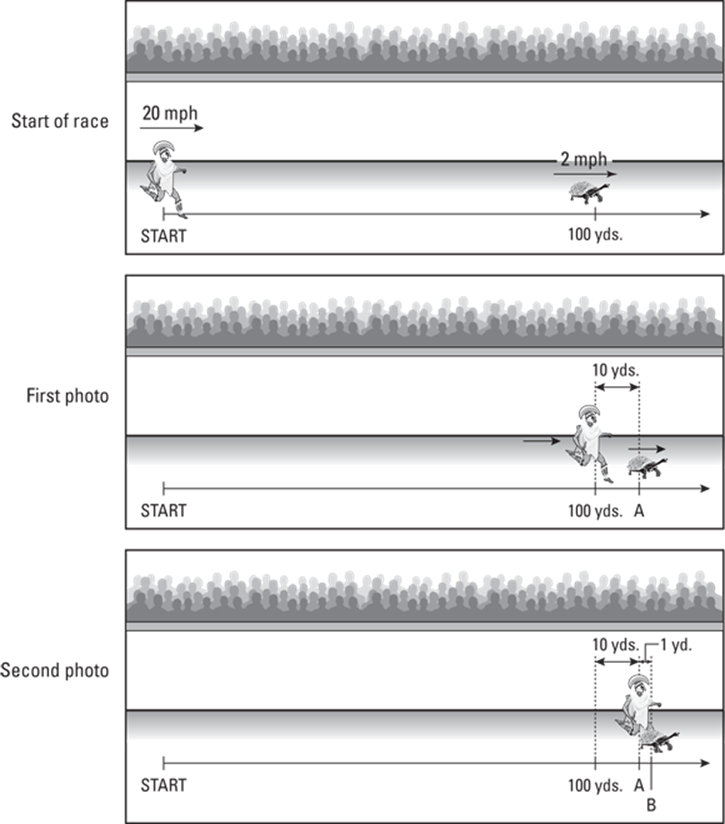
FIGURE 2-8: Achilles versus the tortoise — it’s a photo finish.
You take your first photo the instant Achilles reaches the point where the tortoise started. By the time Achilles gets there, the tortoise has “raced” forward and is now 10 yards ahead of Achilles. (The tortoise moves a tenth as fast as Achilles, so in the time it takes Achilles to travel 100 yards, the tortoise covers a tenth as much ground, or 10 yards.) If you do the math, you find that it took Achilles about 10 seconds to run the 100 yards. (For the sake of argument, let’s call it exactly 10 seconds.)
You have a cool app that allows you to look at your first photo and note precisely where the tortoise is as Achilles crosses the tortoise’s starting point. The tortoise’s position is shown as point A in the middle image in Figure 2-8. Then you take your second photo when Achilles reaches point A, which takes him about one more second. In that second, the tortoise has moved ahead 1 yard to point B. You take your third photo (not shown) when Achilles reaches point B and the tortoise has moved ahead to point C.
Every time Achilles reaches the point where the tortoise was, you take another photo. There is no end to this series of photographs. Assuming you and your camera can work infinitely fast, you will take an infinite number of photos. And every single time Achilles reaches the point where the tortoise was, the tortoise has covered more ground — even if only a millimeter or a millionth of a millimeter. This process never ends, right? Thus, the argument goes, because you can never get to the end of your infinite series of photos, Achilles can never catch or pass the tortoise.
Well, as everyone knows, Achilles does in fact reach and pass the tortoise —thus the paradox. The mathematics of infinite series explains how this infinite series of time intervals sums to a finite amount of time — the precise time when Achilles passes the tortoise. Here’s the sum for those who are curious:
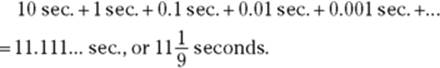
Achilles passes the tortoise after ![]() seconds at the
seconds at the ![]()
Infinite series problems are rich with bizarre, counterintuitive paradoxes. You see more of them in Part 5.