Easy Algebra Step-by-Step: Master High-Frequency Concepts and Skills for Algebra Proficiency—FAST! (2012)
Chapter 17. Graphing Linear Equation
In this chapter, you learn about graphing linear equations.
Properties of a Line
The graph of a linear equation is a straight line or simply a line. The line is the simplest graph of algebra but is probably the most referenced graph because it applies to many situations. Moreover, it has some unique properties that are exploited to great advantage in the study of mathematics. Here are two important properties of a line.
![]() Two Important Properties of a Line
Two Important Properties of a Line
1. A line is completely determined by two distinct points.
2. Every nonvertical line has a unique number associated with it called the slope.
See Chapter 16 for an additional discussion of slope.
Graphing a Linear Equation That Is in Standard Form
The standard form of the equation of a line is Ax + By = C. For graphing purposes, the slope-y-intercept form y = m x + b is the most useful. You use simple algebraic steps to put an equation of a line in this form.
If you have two distinct points (x1, y1) and (x2, y2) on a nonvertical line, then the slope, m, of the line is given by the ratio ![]() . If the slope is negative, the line is slanting down as you move from left to right. If the slope is positive, the line is slanting up as you move from left to right. And if the slope is 0, the line is a horizontal line.
. If the slope is negative, the line is slanting down as you move from left to right. If the slope is positive, the line is slanting up as you move from left to right. And if the slope is 0, the line is a horizontal line.
Problem Find the slope of the line that passes through the points (4,6) and (3,7).
Solution
![]() Step 1. Use the slope ratio formula to find the slope.
Step 1. Use the slope ratio formula to find the slope.
![]()
When you graph linear equations “by hand,” you put the equation in the slope-y-Intercept form and then set up an x-y T-table (illustrated below) to compute point values for the graph.
Problem Graph the line whose equation is y – 2 x = –1.
Solution
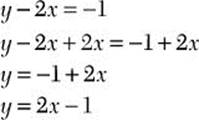
![]() Step 1. Put the equation in slope-y-Intercept form by solving for y.
Step 1. Put the equation in slope-y-Intercept form by solving for y.
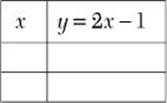
Step 2. Set up an x-y T-table.
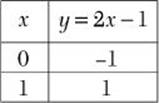
Step 3. Because two points determine a line, substitute two convenient values for x and compute the corresponding y values.
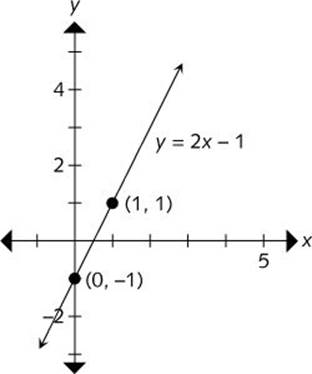
Step 4. Plot the two points and draw the line through the points.
Graphing a Linear Equation That Is in slope-y-Intercept Form
When the equation is in slope-y-Intercept form, ![]() the number m is the slope, and the number b is the y value of the point on the line where it crosses the y-axis. Hence, b is the y-Intercept. The x value for the intersection point is always x = 0. In that case, you actually need to calculate only one y value to draw the line.
the number m is the slope, and the number b is the y value of the point on the line where it crosses the y-axis. Hence, b is the y-Intercept. The x value for the intersection point is always x = 0. In that case, you actually need to calculate only one y value to draw the line.
Problem Graph the line whose equation is ![]()
Solution
![]() Step 1. Substitute a value for x other than 0 and compute the corresponding y value.
Step 1. Substitute a value for x other than 0 and compute the corresponding y value.
When ![]()
Step 2. Plot the intercept point and the point (1,4) and draw the graph.
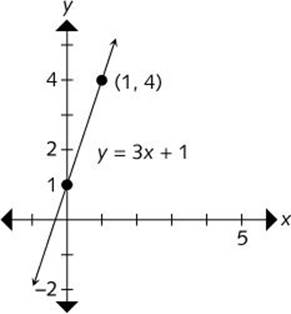
Observe from the graph that the run is 1 and the rise is 3, so the slope is ![]() as verified by the equation
as verified by the equation ![]()
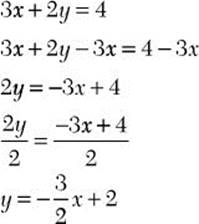
Problem Graph the line whose equation is ![]()
Solution
![]() Step 1. Solve the equation for y to get the slope-y-Intercept form.
Step 1. Solve the equation for y to get the slope-y-Intercept form.
Step 2. Choose a convenient x value, say, x = 2, and compute the corresponding y value.
![]() .
.
Step 3. Plot the intercept point and the point (2,–1) and draw the graph.
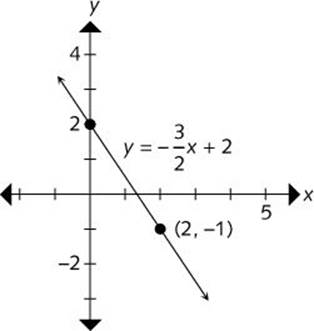
Observe from the graph that the run is –2 and the rise is 3, so the slope is ![]() as verified by the equation
as verified by the equation ![]() .
.
As you can see, graphing linear equations is relatively simple because all you need is two points that lie on the graph of the equation. Finally, if you are using a graphing calculator to graph linear equations, the equation must be in slope-y-Intercept form.
 Exercise 17
1. Find the slope of the line through the points (5,11) and (3,14).
For 2–6, draw the graph of the line determined by the given equation.
![]()
![]()
4. y = x
![]()
6. ![]()