GMAT Quantitative Review
3.0 Math Review
3.1 Arithmetic
8. Descriptive Statistics
A list of numbers, or numerical data, can be described by various statistical measures. One of the most common of these measures is the average, or (arithmetic) mean, which locates a type of “center” for the data. The average of n numbers is defined as the sum of the n numbers divided by n. For example, the average of 6, 4, 7, 10, and 4 is 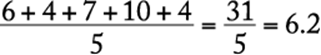 .
.
The median is another type of center for a list of numbers. To calculate the median of n numbers, first order the numbers from least to greatest; if n is odd, the median is defined as the middle number, whereas if n is even, the median is defined as the average of the two middle numbers. In the example above, the numbers, in order, are 4, 4, 6, 7, 10, and the median is 6, the middle number.
For the numbers 4, 6, 6, 8, 9, 12, the median is 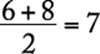 . Note that the mean of these numbers is 7.5.
The median of a set of data can be less than, equal to, or greater than the mean. Note that for a large set of data (for example, the salaries of 800 company employees), it is often true that about half of the data is less than the median and about half of the data is greater than the median; but this is not always the case, as the following data show.
3, 5, 7, 7, 7, 7, 7, 7, 8, 9, 9, 9, 9, 10, 10
Here the median is 7, but only ![]() of the data is less than the median.
of the data is less than the median.
The mode of a list of numbers is the number that occurs most frequently in the list. For example, the mode of 1, 3, 6, 4, 3, 5 is 3. A list of numbers may have more than one mode. For example, the list 1, 2, 3, 3, 3, 5, 7, 10, 10, 10, 20 has two modes, 3 and 10.
The degree to which numerical data are spread out or dispersed can be measured in many ways. The simplest measure of dispersion is the range, which is defined as the greatest value in the numerical data minus the least value. For example, the range of 11, 10, 5, 13, 21 is ![]() . Note how the range depends on only two values in the data.
. Note how the range depends on only two values in the data.
One of the most common measures of dispersion is the standard deviation. Generally speaking, the more the data are spread away from the mean, the greater the standard deviation. The standard deviation of n numbers can be calculated as follows: (1) find the arithmetic mean, (2) find the differences between the mean and each of the n numbers, (3) square each of the differences, (4) find the average of the squared differences, and (5) take the nonnegative square root of this average. Shown below is this calculation for the data 0, 7, 8, 10, 10, which have arithmetic mean 7.
|
x |
|
|
|
0 |
−7 |
49 |
|
7 |
0 |
0 |
|
8 |
1 |
1 |
|
10 |
3 |
9 |
|
10 |
3 |
9 |
|
Total |
68 |
Standard deviation 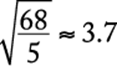
Notice that the standard deviation depends on every data value, although it depends most on values that are farthest from the mean. This is why a distribution with data grouped closely around the mean will have a smaller standard deviation than will data spread far from the mean. To illustrate this, compare the data 6, 6, 6.5, 7.5, 9, which also have mean 7. Note that the numbers in the second set of data seem to be grouped more closely around the mean of 7 than the numbers in the first set. This is reflected in the standard deviation, which is less for the second set (approximately 1.1) than for the first set (approximately 3.7).
There are many ways to display numerical data that show how the data are distributed. One simple way is with a frequency distribution, which is useful for data that have values occurring with varying frequencies. For example, the 20 numbers
−4 0 0 −3 −2 −1 −1 0 −1 −4
−1 −5 0 −2 0 −5 −2 0 0 −1
are displayed on the next page in a frequency distribution by listing each different value x and the frequency f with which x occurs.
|
Data Value |
Frequency |
|
−5 |
2 |
|
−4 |
2 |
|
−3 |
1 |
|
−2 |
3 |
|
−1 |
5 |
|
0 |
7 |
|
Total |
20 |
From the frequency distribution, one can readily compute descriptive statistics:
Mean: 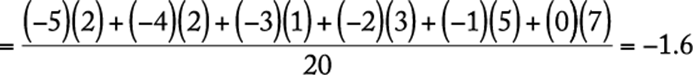
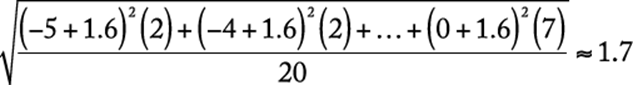
Median: −1 (the average of the 10th and 11th numbers) Mode: 0 (the number that occurs most frequently) Range: ![]()
Standard deviation: