GMAT Quantitative Review
3.0 Math Review
3.4 Word Problems
7. Sets
If S is the set of numbers 1, 2, 3, and 4, you can write ![]() . Sets can also be represented by Venn diagrams. That is, the relationship among the members of sets can be represented by circles.
. Sets can also be represented by Venn diagrams. That is, the relationship among the members of sets can be represented by circles.
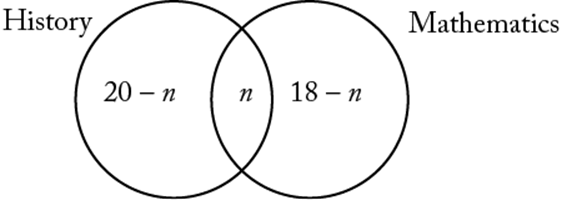
Example 1: Each of 25 people is enrolled in history, mathematics, or both. If 20 are enrolled in history and 18 are enrolled in mathematics, how many are enrolled in both history and mathematics?
Solution: The 25 people can be divided into three sets: those who study history only, those who study mathematics only, and those who study history and mathematics. Thus a Venn diagram may be drawn as follows, where n is the number of people enrolled in both courses, ![]() is the number enrolled in history only, and
is the number enrolled in history only, and ![]() is the number enrolled in mathematics only.
is the number enrolled in mathematics only.
Since there is a total of 25 people, ![]() , or
, or ![]() . Thirteen people are enrolled in both history and mathematics. Note that
. Thirteen people are enrolled in both history and mathematics. Note that ![]() , which is the general addition rule for two sets (see section 3.1.9).
, which is the general addition rule for two sets (see section 3.1.9).
Example 2: In a certain production lot, 40 percent of the toys are red and the remaining toys are green. Half of the toys are small and half are large. If 10 percent of the toys are red and small, and 40 toys are green and large, how many of the toys are red and large.
Solution: For this kind of problem, it is helpful to organize the information in a table:
|
Red |
Green |
Total |
|
|
Small |
10% |
50% |
|
|
Large |
50% |
||
|
Total |
40% |
60% |
100% |
The numbers in the table are the percentages given. The following percentages can be computed on the basis of what is given:
|
Red |
Green |
Total |
|
|
Small |
10% |
40% |
50% |
|
Large |
30% |
20% |
50% |
|
Total |
40% |
60% |
100% |
Since 20% of the number of toys (n) are green and large, ![]() (40 toys are green and large), or
(40 toys are green and large), or ![]() . Therefore, 30% of the 200 toys, or
. Therefore, 30% of the 200 toys, or ![]() , are red and large.
, are red and large.