Basic Math and Pre-Algebra
PART 2. Into the Unknown
CHAPTER 11. Coordinate Graphing
Graphs of Inequalities
The graph of an equation is a picture of all the pairs of numbers that solve the equation, so the graph of an inequality should be the picture of all the pairs of numbers that make the inequality true. That may (or may not) include points on a line, but it will include a lot of other points, either above or below the line.
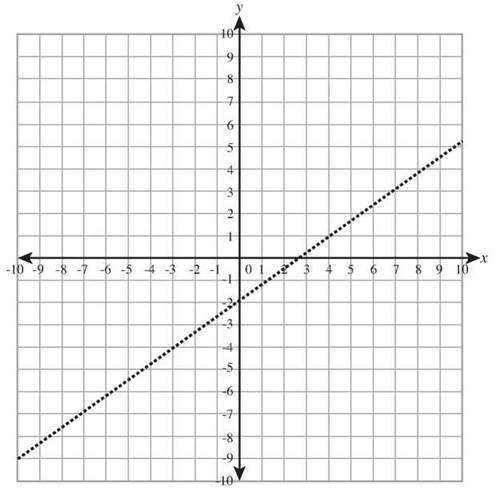
To graph an inequality like ![]() begin by graphing the line
begin by graphing the line ![]() If the inequality sign is ≥ or ≤, you would use a solid line, but here, for > or <, use a dotted line.
If the inequality sign is ≥ or ≤, you would use a solid line, but here, for > or <, use a dotted line.
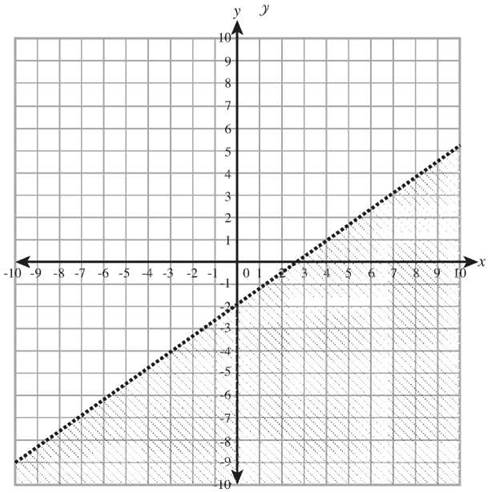
You want the points with y-coordinates that are less than 3/4x - 2. The points on the line have y-coordinates equal to that, one side of the line has points with y-coordinates that are greater and the other side of the line has the ones that are less. Test a point on one side of the line in the inequality; the origin is often a convenient choice. If the result is true, shade that side of the line; if not, shade the other side.
CHECK POINT
Solve each equation.
The Least You Need to Know
• The coordinate system assigns a pair of numbers, called coordinates, to every point in the plane. The first number tells you how to move horizontally, and the second tells how to move vertically.
• Any equation can be graphed by making a table and plotting points. The x-intercept and the y-intercept are easy points to calculate.
• The slope is a number that tells whether a line rises or falls and how steeply.
• If the equation is in y = mx + b form, start at b on the y-axis and count the slope, m, to see where the line goes.