Mathematics for the liberal arts (2013)
Part I. MATHEMATICS IN HISTORY
Chapter 4. CALCULUS
4.19 Exponential Growth and Doubling Times
If you’ve studied science, you may know that radioactive substances have a “half life,” a period during which half of the substance will decay into another element. For example, Polonium-210, which is used as a detonator for nuclear bombs, has a half-life of 138 days. After 138 days, a 1 gram sample of Polonium-210 decays until half of it is lead. After another 138 days, half of the remaining Polonium-210 will have decayed into lead (meaning that there is only 1/4 gram of Polonium-210 left in the sample). An expensive aspect of maintaining a large nuclear arsenal is continuously replacing decayed detonators.
If you’ve studied finance (or worked Exercise 4.64), you may know that compound interest endows investments with a doubling time. You might have learned the “rule of 72,” which estimates how long it takes for your money to double. According to the rule, if you divide 72 by your compound interest rate, the result is approximately the doubling time. For example, if you earn 6% on your money, it should double in 72/6 = 12 years.
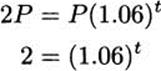
Although the rule of 72 is often a good estimate, as math students, we can compute doubling times precisely. Let P be the amount of principal invested, and assume it grows at 6%, compounded annually. Then the amount of money after t years, A(t), is given by the formula
![]()
If we want to know when the investment will double, we simply set A(t) = 2P and find t. Calculating,
and to solve this, we take a logarithm of both sides,
![]()
Finally, we divide by In 1.06 to get t:
![]()
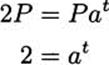
A similar calculation works with any investment that pays compound interest. That’s because compound interest is an example of exponential growth, and anything that grows exponentially has a doubling time. To see this, let A(t) = Pat be a generic exponential function with base a > 1 (it doesn’t grow if a < 1). Then we can compute the time it takes for doubling:
and, using logarithms, as before,
![]()
You can verify that the time required to go from 2P to 4P is of the same duration, as is the time to go from 3P to 6P, etc.
Other than compound interest, can you think of anything else that grows exponentially? Anything that “grows by a percentage” is exponential growth. For example, over the long term inflation is expected to grow around 3% per year. That means if an item costs $10 this year, it costs 3% more money a year from now, or $10 + $10(0.03) = $10(1.03) = $10.30. In two years, the cost is $10(1.03)2, and after t years the cost is $10(1.03)t.
Population is another quantity that often grows exponentially. Some percentage of the population tends to be older (or die randomly from accidents). Another percentage is of childbearing age and temperament to have offspring. The difference is the growth rate of the population. It fluctuates, but over the long term it has tended to have an exponential shape.
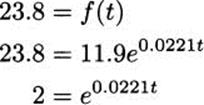
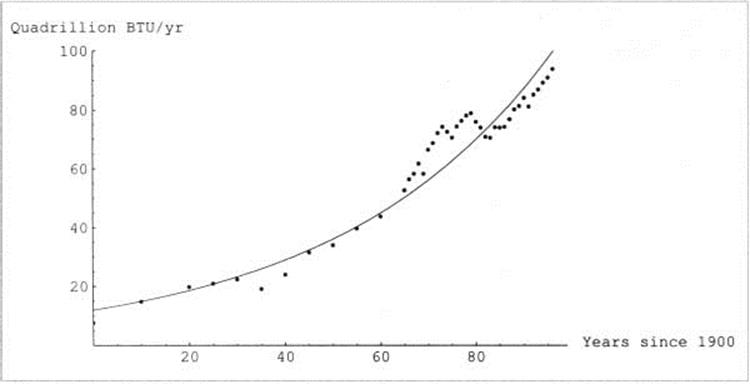
Figure 4.40 shows government estimates for the amount of fossil fuel used in the United States since 1900. The curve through the data points has the formula f(t) = e2.48+0.0221t = 11.9e0.0221t, which we recognize as an exponential curve.
If fossil fuel use has grown (approximately) exponentially, it should have a doubling time, and we can calculate it. First, f(0) = 11.9, since fossil fuel use in 1900 was approximately 11.9 quadrillion British thermal units. To find the doubling period, we solve to find the t for which fuel use had doubled to 23.8 quadrillion BTUs:
and taking logs of both sides,
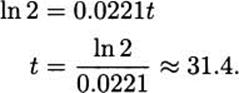
In the United States over the last century, fossil fuel use doubled approximately every 31.4 years. Is that an alarming rate? Perhaps not: the growth rate might be thought leisurely at only a bit over 2% per year. Yet there are some reasons to think it is alarming, and our knowledge of series can give us some perspective on the question.
Figure 4.40 US fossil fuel use since 1900.
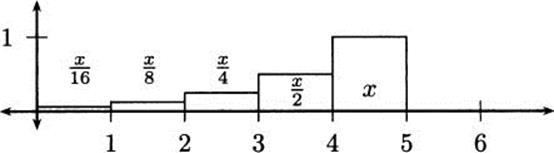
Let x be the total amount of fossil fuel used in one doubling period (in this case 31.4 years). How much was used during the period before? If you answered ![]() , you are correct. How much was used during the period before that? Yes,
, you are correct. How much was used during the period before that? Yes, ![]() . Looking backward, counting by doubling times, we get a progression that looks like a geometric series, as in Figure 4.41.
. Looking backward, counting by doubling times, we get a progression that looks like a geometric series, as in Figure 4.41.
Figure 4.41 Fossil fuel use divided into doubling periods.
Compare the amount of fuel used in the final doubling period to the periods that came before. What happens if we start adding the previous amounts? We get
![]()
This is a finite part of a geometric series, with a = ![]() and r =
and r = ![]() . four terms is less than the sum of the entire series, which we can calculate:
. four terms is less than the sum of the entire series, which we can calculate:
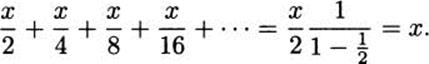
What did we learn? Not only is the amount of fossil fuel used in the final doubling period equal to twice as much as the preceding period, it is more than all of previous history added together. If this kind of growth continues, what will happen during the next doubling period? In Figure 4.42 the final doubling period again exceeds all of previous history, and that includes the period we just finished!
Figure 4.42 Fossil fuel use after one more doubling period.
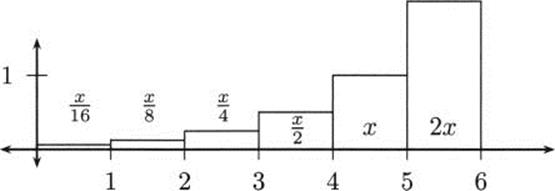
Exponential growth negates many arguments for complacency about energy policy. For example, what if there are twice as many resources as we estimate still in the ground, coal and oil and gas still undiscovered and untapped? That buys us more time, but not hundreds of years, merely one more 31.4 year doubling period. It is clear that repeatedly doubling consumption is not a pattern that can continue indefinitely.
![]() EXAMPLE 4.51
EXAMPLE 4.51
The United Nations has estimated that the world human population was approximately 6 billion in the year 2000 and was increasing at the rate of approximately 1 percent per year at that time. Based on this information, find the function representing world human population as a function of the number of years past 2000. When will population reach 10 billion, according to this model?
Solution: Let A(t) be the world human population at time t, where t is number of years after 2000. Since population grows by a percentage, we recognize it as exponential growth, and we can write A(t) = Pert for some value of Pand some value of r. We are told that the population in 2000 is 6 billion, thus 6 × 109 = A(0) = Per·0 = P, and it follows that A(t) = 6 × 10⁹ ert.
We are also told that the rate of change of population is 1 percent per year. Since derivatives tell us rates of change, this means that
![]()
and substituting for A(t), we have
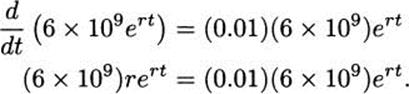
Divide both sides by 6 × 10⁹ ert to get
![]()
Therefore, the model for global population growth is
![]()
and to find the time when A(t) = 1010 we solve the equation
![]()
obtaining t ≈ 51. The world’s human population will reach 10 billion in the year 2051, according to this model.
![]()
EXERCISES
4.98 Suppose that you have a bank account earning 5 percent interest per year, compounded annually. If you have $2000 today, when will you have $4000?
4.99 Assume the inflation rate remains 3.4% per year.
a) How many years will it take for prices to double?
b) How many years will it take for prices to quadruple?
c) How many years will it take for prices to grow 10-fold?