SAT SUBJECT TEST MATH LEVEL 2
PART 2
![]()
REVIEW OF MAJOR TOPICS
![]()
CHAPTER 3
Numbers and Operations
|
• Counting • Complex Numbers • Matrices • Sequences and Series • Vectors |

3.1 Counting
![]()
VENN DIAGRAMS
Counting problems usually begin with the phrase “How many . . .” or the phrase “In how many ways . . .” Illustrating counting techniques by example is best.
EXAMPLES
1. A certain sports club has 50 members. Of these, 35 golf, 30 hunt, and 18 do both. How many club members do neither?
Add 35 and 30, then subtract the 18 that were counted twice. This makes 47 who golf, hunt, or do both. Therefore, only 3 (50 – 47) do neither.
2. Among the seniors at a small high school, 80 take math, 41 take Spanish, and 54 take physics. Ten seniors take math and Spanish; 19 take math and physics; and 12 take physics and Spanish. Seven seniors take all three. How many seniors take math but not Spanish or physics?
A Venn diagram will help you sort out this complicated-sounding problem.
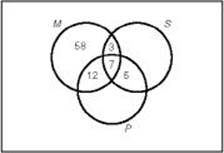
Start with the 7 who take all three courses. Since 10 take math and Spanish, this leaves 3 who take math and Spanish but not physics. Use similar reasoning to see that 5 take physics and Spanish but not math, and 12 take math and physics but not Spanish.
Finally, using the totals for how many students take each course, we can conclude that 58 (80 – 3 – 7 – 12) take math but not physics or Spanish.
EXERCISE
1. There are 50 people in a room. Twenty-eight are male, and 32 are under the age of 30. Twelve are males under the age of 30. How many women over the age of 30 are in the group?
(A) 2
(B) 3
(C) 4
(D) 5
(E) 6