SAT Subject Test Physics (2012)
PART III. PHYSICS TOPIC REVIEW
Chapter 1. MEASUREMENTS AND DATA DISPLAYS
It is often said that mathematics is the language of physics. The reason for this conclusion is that so much of physics deals with measurements and calculations. It is therefore useful to review some basic information involving measurements and data.
Measurements
In SAT Physics, you will be required to interpret and use measurements provided in a variety of formats. Perhaps one of the most important aspects of measurements for you to know to be able to deal with measurements correctly is to be familiar with units of measurements. The units used by physicists and in questions in SAT Physics are those of the International System of Units (SI). The SI has seven base quantities that are assumed to be independent. The base quantities, along with their names and symbols, are shown in Table 1.
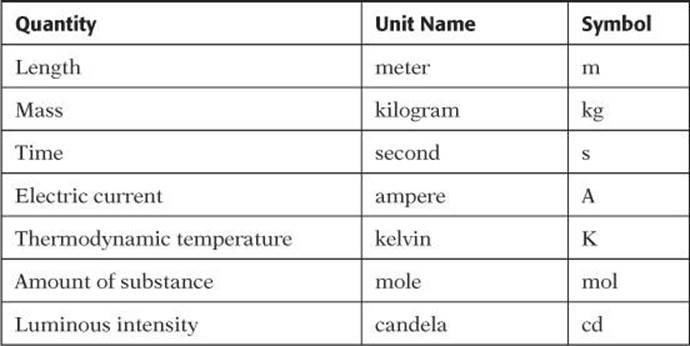
TABLE 1. SI Base Units
Derived quantities are those defined in terms of the seven base quantities. Common derived quantities are shown in Table 2. Notice how the unit for each derived quantity consists of a combination of base units.

TABLE 2. Derived Quantities
As you complete your review, you will encounter many other SI units. Note that most have more than one expression in terms of SI units. Several examples are listed in Table 3.

TABLE 3. Equivalent Units
Significant Figures
No measuring device can give perfectly accurate measurements without some degree of uncertainty. The rightmost digit is considered to be uncertain. For example, a measured mass of 84.6 g is considered to have an uncertainty of plus or minus 0.1 g. A measured mass of 84.60 has an uncertainty of plus or minus 0.01 g. Digits in a number that are known with some degree of certainty are said to be significant figures. There are several basic rules for deciding the number of significant figures:
• All nonzero digits are significant.
5.648 cm has 4 significant figures.
3.1 cm has 2 significant figures.
• Zeros within a number are significant.
2509 m has 4 significant figures.
32.06 has 4 significant figures.
• Zeros to the left of the first nonzero digit are not significant.
0.018 g has 2 significant figures.
0.009 g has 1 significant figure.
• Trailing zeros that are to the right of the decimal point are significant.
0.50 has 2 significant figures.
0.0310 has 3 significant figures.
• Trailing zeros are not significant unless the decimal point is indicated.
540 has 2 significant figures. 540.
has 3 significant figures.
Adding and Subtracting When you combine measurements, the sum can be no more accurate than the least accurate measurement. Therefore, the sum or difference of measurements can contain no more decimal places than the least accurate measurement. Notice in the following example that the sum or difference is rounded to the correct number of decimal places.

Multiplying and Dividing As with adding and subtracting, the result can be no more accurate than the least accurate measurement. When multiplying and dividing, it is the number of significant figures you count rather than the decimal places. The product or quotient of measurements can have no more significant figures than the least accurate measurement. Again notice that the product or quotient is rounded to the correct number of significant figures.

Scientific Notation
Any ambiguity presented by zeros in measurements can be avoided by using scientific notation, which is also known as standard notation or exponential notation. In this form, the number of significant figures is clearly indicated. Scientific notation is generally a method of writing very large or very small numbers.
Numbers written in scientific notation have three parts: the base, the coefficient, and the exponent.

To write a number in scientific notation, write the significant digits as a number between 1 and 10. If the original number was greater than 1, write the number of spaces the decimal point moved as a positive exponent of 10. If the original number was less than 1, write the number of spaces the decimal point moved as a negative exponent of 10.
Example:

Graphing
Scientific data is often presented in a graph. Although SAT Physics will not require you to draw a graph, you will need to be able to recognize and interpret the information in different kinds of graphs. Most data will be plotted using Cartesian coordinates where the independent variable is plotted along the x-axis and the dependent variable is plotted along the y-axis.
While specific data will vary, there are some general trends that you should be able to recognize easily. A direct relationship is one in which two variables increase or decrease simultaneously. In other words, if the independent variable increases or decreases, so does the dependent variable. An indirect relationship is one in which the dependent variable changes opposite to the independent variable. So, for example, if the independent variable increases, the dependent variable decreases.
One type of relationship is a linear relationship. This type of relationship can be described by an equation in the form y = mx + b where x is the independent variable, y is the dependent variable, m is the slope, and b is the y-intercept.
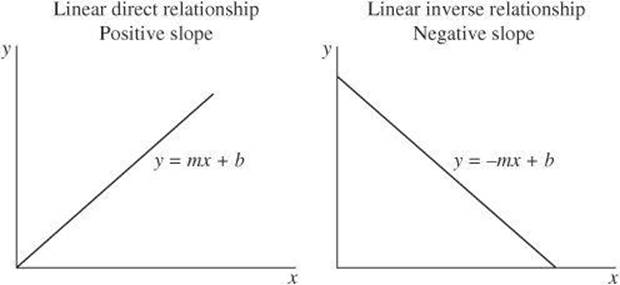
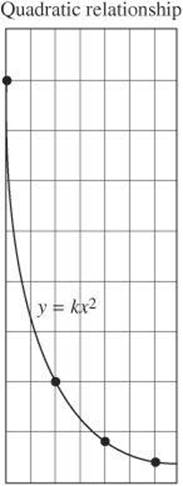
Another common relationship is a quadratic relationship, which is a relationship in which one variable varies with the square of another variable. The graph of a quadratic relationship takes the form of a parabola.
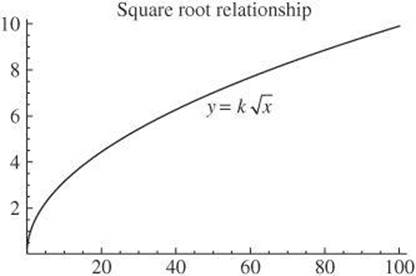
A third relationship you should recognize is the graph of a square root relationship. It takes the shape of the graph shown.
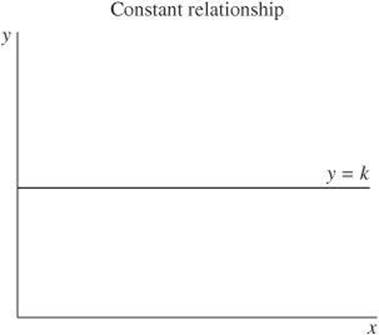
Finally, there is one graph that may be presented that takes the form of a horizontal line. This type of graph represents a relationship in which the dependent variable remains the same, despite changes in the independent variable. For these types of graphs, pay attention to the variables to be plotted. For example, if the dependent variable is distance, the graph shows that distance (position) stays the same. If the dependent variable is speed, the graph shows that speed stays the same.
Test-Taking Hint
When performing calculations, keep all of the digits until the last step. Then round to the correct number of significant figures.