SAT Subject Test Physics (2012)
PART III. PHYSICS TOPIC REVIEW
Chapter 3. KINEMATICS
Physical bodies move in many different ways. Kinematics is the study of the motion of objects. Understanding the principles of kinematics will enable you to describe how bodies move so that when you review dynamics in the next chapter, you will be able to explain the causes for motion.
Displacement
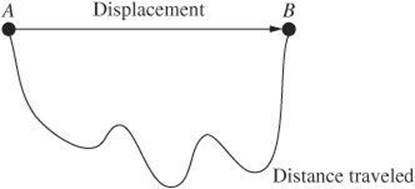
A moving object can take many different paths to the same ending point. Displacement is the change in position of an object. To evaluate displacement, compare only the starting and ending points. Displacement is a vector quantity because it has both magnitude and direction. As you can see in the diagram, displacement is different from the distance traveled. SAT Physics may require you to distinguish between displacement and distance.
Example:
Tyler and Maria are biologists searching for evidence of sea turtle nests along a shoreline. Tyler walks 30 m directly south along the water. Maria investigates several points up and down the beach. When Tyler and Maria get to the end point, who has walked the farther distance? What are their displacements?
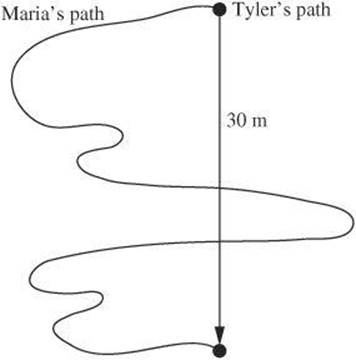
Tyler took a direct path, whereas Maria took an indirect path. As a result, Maria traveled a greater distance. Her path is clearly longer. Both Tyler and Maria started and ended at the same point. Therefore, both biologists have the same displacement of 30 m south. For Tyler only, the distance traveled is equal to the displacement.
Once Tyler and Maria get to the end point, both biologists turn around and walk 30 m directly north to return to their starting point. Now how does the distance Tyler walked compare to his displacement?
Tyler has walked a total distance of 60 m, but his displacement is zero because his ending point is the same as his starting point.
Speed and Velocity
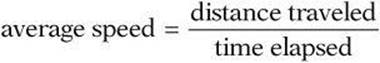
When you observe a moving object, one of the first aspects you may notice is how fast it is moving. The average speed of an object is the distance traveled divided by the time it takes to travel this distance.
Speed is a scalar quantity. Velocity is a vector quantity that describes speed in a given direction. The magnitude of an object’s velocity is its speed. Average velocity is defined in terms of displacement rather than total distance. The average velocity (v) of an object is its displacement divided by time.
You can use the Greek letter delta Δ to represent a change in a quantity. So, for example, Δx can represent a change in displacement and Δt can represent a change in time. A bar over a letter is commonly used to indicate an average. Thus the average velocity can be written as follows.
![]()
Example:
A cyclist takes 2.5 h to travel 40.0 km along a straight road toward the east. What is the average velocity of the cyclist?
![]()
The change in position is 40 km and the change in time is 2.5 h. The result is an average velocity of 16 km/h.
Instantaneous Velocity
The previous discussions involved averages determined over a given time interval. Many problems on SAT Physics involve velocity at a given moment. Instantaneous velocity at any moment is the average velocity over an infinitesimally short interval of time. Unless a question specifically mentions average velocity, assume it is looking for instantaneous velocity. Also note that if an object moves at a constant, or uniform, velocity over some time interval, then its instantaneous velocity at any instant is equal to its average velocity.
Accelerated Motion
Motion in which the velocity is constant is considered uniform motion. If the speed, direction, or both speed and direction change, then velocity is not constant. If the velocity changes, the motion is said to be accelerated. Acceleration (a) is change in velocity divided by the time it took to make that change. Because acceleration involves velocity, it too is a vector quantity.
You can see from the formula that a unit of velocity is being divided by a unit of time. Therefore, units of acceleration involve a unit of velocity, such as meters per second, and a unit of time, such as seconds. A common of unit of velocity is the meter per second per second (m/s2).
Example:
A car accelerates from rest to 64 km/h in 4.0 s. What is the magnitude of its average acceleration?
The car starts from rest, so ![]() . The final velocity, v2, is 64 km/h.
. The final velocity, v2, is 64 km/h.
![]()
The average acceleration of the car is 16 kilometers per hour per second.
Uniformly Accelerated Motion
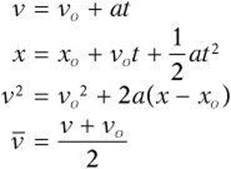
When acceleration is constant and in one dimension, the motion is also known as uniformly accelerated motion. In other words, the object is moving in a straight line and acceleration stays the same. For this type of motion, you should know the following kinematic equations that relate position x, initial velocity vo, final velocity vf, acceleration a, and elapsed time t. SAT Physics questions will often give you three of the five variables and ask you to solve for the fourth. The fifth will not be involved in the question. Knowing this, you’ll need to choose the equation that omits the variable that is not involved in the question.
Remember that these equations are valid only when acceleration is constant. In many questions, xo, which is the object’s position at ![]() , is zero, so the equations are simplified even further. Also make sure you recognize that xrepresents position and not distance. Therefore,
, is zero, so the equations are simplified even further. Also make sure you recognize that xrepresents position and not distance. Therefore, ![]() is displacement.
is displacement.
Example:
A driver steps on the brakes of a car, causing the car to slow to a stop at a constant acceleration of –6.0 m/s2. If the car is moving at an initial velocity of 32 m/s, estimate the displacement of the car as it comes to a stop.
List the known information and the unknown information
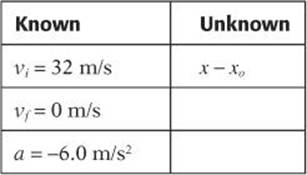
Choose the equation that contains the known and unknown variables.
![]()
Substitute the values into the equation.
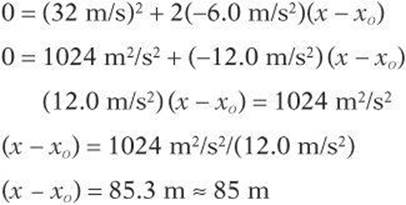
The car travels about 85 m as it comes to a stop.
Graphing Motion
Many of the SAT Physics questions involving kinematics will provide graphs plotting position velocity, or acceleration against time. Being prepared to read these kinds of graphs will help you to solve problems quickly and efficiently.
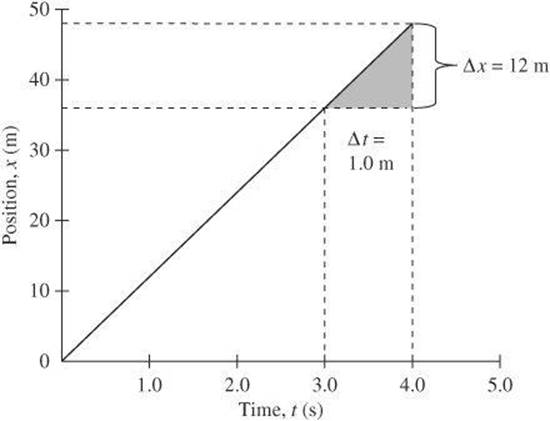
Position Versus Time Graph First consider a position versus time graph. Examine the following graph, which represents the motion of a car moving at a constant velocity of 12 m/s. You can see that x increases by 12 m each second. Because the position increases linearly with time, the graph of x versus t is a straight line. Each point on the graph represents the position of the car at a particular time. For example, at 3.0 s, the car is at 36 m. At 4.0 s, the car is at 48 m.
The shaded triangle indicates the slope of the line, which is the change in the dependent variable (Δx) divided by the corresponding change in the independent variable (Δt).
![]()
If you look at the equation for slope, you will notice that it is the same as the equation for velocity. For this graph, ![]() , which was the velocity given at the beginning of the example.
, which was the velocity given at the beginning of the example.
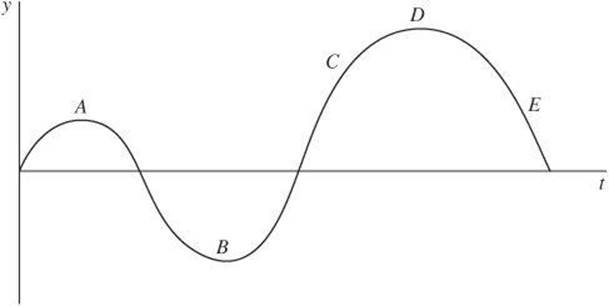
Calculating the velocity of a straight-line graph is relatively straightforward. However, if a graph is curved because velocity changes, calculating velocity requires calculus. Fortunately, SAT Physics does not require you to use calculus. If you encounter a curved position versus time graph, you will need to consider qualitative questions about the motion. Most likely, you will need to identify the point with the greatest or least velocity. Keep in mind that points at the top of peaks or the bottom of valleys have a slope of zero and therefore have zero velocity.
In the following graph, the velocity is zero at points A, B, and D. The velocity is greatest at point C and least at point E. Note also that the velocity at point E is negative, whereas the velocity at point C is positive.
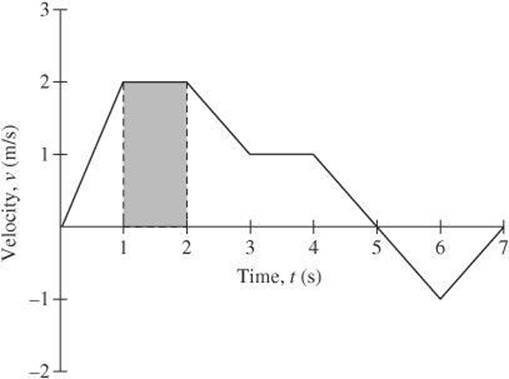
Velocity Versus Time Graph Now consider a velocity versus time graph. This type of graph indicates the velocity of an object at a given time. By looking at the following graph, you can see the velocity at any given time. For example, at 1 second after it started moving, the object is moving at 2 m/s. At 2 seconds the object is still moving at 2 /ms, but at 3 seconds, the object is moving at 1 m/s.
You can also use the graph to determine the direction of the object. The y-coordinates are defined such that right is positive and left is negative. When the velocity is positive, between t = 0 and ![]() , the object is moving to the right. When the velocity is negative, between
, the object is moving to the right. When the velocity is negative, between ![]() and
and ![]() , the object is moving to the left.
, the object is moving to the left.
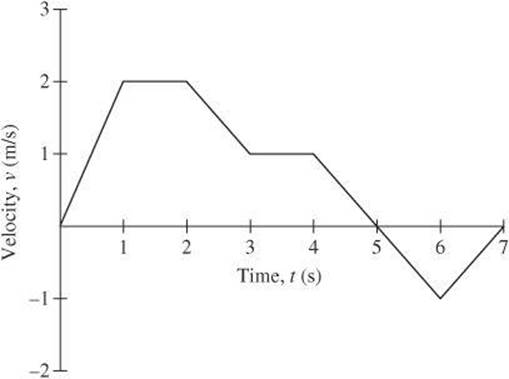
Just as you found velocity as the slope of the positive versus time graph, you can calculate acceleration from a velocity versus time graph. Where the graph is horizontal, the acceleration is zero. Therefore, acceleration is zero between ![]() and
and ![]() and between
and between ![]() and
and ![]() . The acceleration between
. The acceleration between ![]() and
and ![]() is constant, so you can find the acceleration at
is constant, so you can find the acceleration at ![]() by calculating the average acceleration between
by calculating the average acceleration between ![]() and
and ![]() .
.
![]()
You can also use a velocity versus time graph to calculate displacement. To do so, divide the time axis into subintervals. The displacement in a given time interval equals the area under the graph during that interval. For example, in the following graph, the displacement between ![]() and
and ![]() is the area of the rectangle shown (Δt × v), or
is the area of the rectangle shown (Δt × v), or ![]() m to the right.
m to the right.
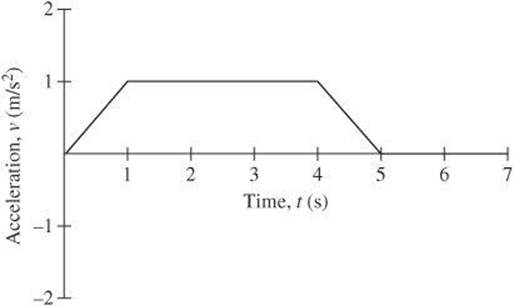
Acceleration Versus Time Graph Examine acceleration versus time graphs in much the same way as the previous graphs. You can see that the object represented by the following graph has positive acceleration between t = 0 and ![]() and negative acceleration between
and negative acceleration between ![]() and
and ![]() . It accelerates at a constant rate of 1 m/s2 between
. It accelerates at a constant rate of 1 m/s2 between ![]() and
and ![]() . The object is not accelerating between
. The object is not accelerating between ![]() and
and ![]() , which means that its velocity is constant.
, which means that its velocity is constant.
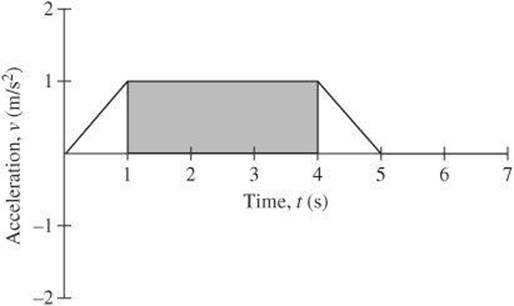
Just as you used a velocity versus time graph to calculate displacement, you can use an acceleration versus time graph to calculate the change in velocity. The change in velocity in a given time interval equals the area under the graph during that interval. The acceleration is constant between ![]() and
and ![]() , so the change in velocity during that interval is equal to the area of the shaded rectangle:
, so the change in velocity during that interval is equal to the area of the shaded rectangle: ![]() . The velocity at
. The velocity at ![]() is 3 m/s greater than it was at
is 3 m/s greater than it was at ![]() .
.
Frame of Reference
One important point to remember when solving kinematics problems is to consider the appropriate frame of reference. In everyday language, the frame of reference is generally considered to be Earth. However, some problems will include alternate frames of reference that must be considered.
Example:
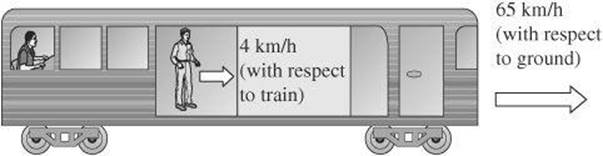
Imagine a passenger on a train traveling at 65 km/h with respect to the ground. Another passenger walks to the front of the train at 4 km/h with respect to the train. The walking passenger is actually moving at 69 km/h (65 km/h + 4 km/h) with respect to the ground. As you can see, it is always important to look for clues that describe frame of reference in both problems and solutions.
Test-Taking Hint
You might think that some questions are missing information. However, there may be clues that will help you translate information in questions into values for kinematic equations. For example, the phrase starts from rest tells you that ![]() . The phrase comes to rest tells you that that
. The phrase comes to rest tells you that that ![]() , and the phrase moves at constant velocity tells you that
, and the phrase moves at constant velocity tells you that ![]() .
.
REVIEW QUESTIONS
Select the choice that best answers the question or completes the statement.
1. A shopper in a hardware store pushes a cart 25 m north up one aisle. She then moves 12 m west before turning south and moving 30 m. She moves 12 m east in order to pay for her purchase. What is her displacement?
(A) 15 m north
(B) 5 m south
(C) 5 m west
(D) 55 m south
(E) 79 m east
2. Usain Bolt ran straight from the start to the finish line of the 100-meter dash in 9.58 s. What was his average speed?
(A) 1.92 m/s
(B) 3.22 m/s
(C) 5.20 m/s
(D) 10.4 m/s
(E) 45.2 m/s
3. Which of the following sentences describes an example of instantaneous velocity?
(A) The hot-air balloon rose upward 42 meters in 12 seconds.
(B) The pitcher can throw a baseball that moves at 42 meters per second.
(C) At the age of 16, Jessica Watson sailed 23,000 nautical miles around the world in 210 days.
(D) The runner moved 18 kilometers in her first 2 hours of the marathon.
(E) At the 10-second mark, the submersible was sinking downward at 25 meters per second.
4. A sports car accelerates along a track from rest to 88 km/h in 5.9 s. What is its average acceleration?
(A) 4.1 m/s2
(B) 5.4 m/s2
(C) 9.1 m/s2
(D) 14 m/s2
(E) 15 m/s2
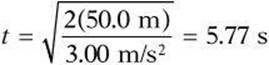
5. How long does it take a car to travel 50.0 m if it accelerates from rest at a constant rate of 3.00 m/s2?
(A) 3.05 s
(B) 4.08 s
(C) 5.77 s
(D) 12.2 s
(E) 16.7 s
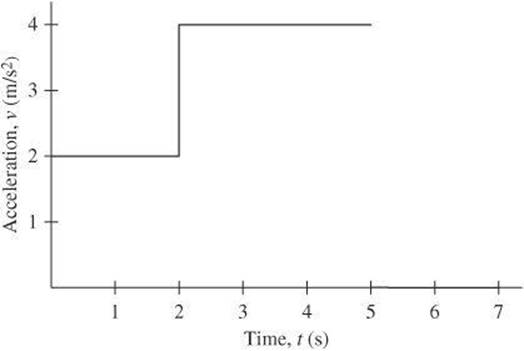
6. The graph below shows the acceleration of a particle. At t = 0, the speed of the particle is 1 m/s. What is the speed of the particle at ![]() ?
?
(A) 20 m/s
(B) 17 m/s
(C) 15 m/s
(D) 12 m/s
(E) 5 m/s
Questions 7–10 relate to the graph below, which represents the motion of Cars A and B on straight parallel paths. Car B passes Car A at the same instant that Car A starts from rest at t = 0 s.
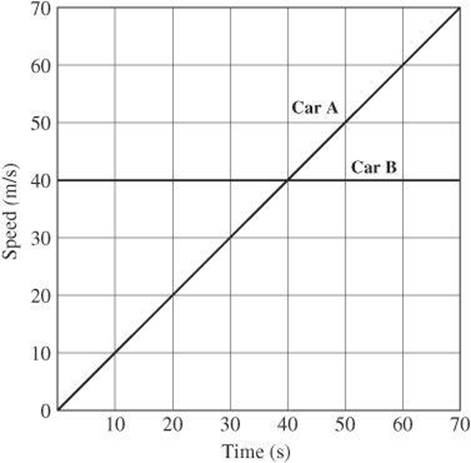
7. What is the acceleration of Car A during the interval between t = 0 and t = 70.0 seconds?
(A) 0 m/s2
(B) 1 m/s2
(C) 10 m/s2
(D) 40 m/s2
(E) 70 m/s2
8. How far did Car A travel between t = 0 and ![]() seconds?
seconds?
(A) 70 m
(B) 110 m
(C) 280 m
(D) 2450 m
(E) 4900 m
9. Which choice describes the car that traveled the greatest distance during the time intervals listed?
(A) Car A from t = 0 to ![]()
(B) Car A from ![]() to
to ![]()
(C) Car A from ![]() to
to ![]()
(D) Car B from t = 0 to ![]()
(E) Car B from ![]() to
to ![]()
10. How many seconds after t = 0 did it take for Car A to catch up with Car B?
(A) 0
(B) 20
(C) 40
(D) 60
(E) 80
QUESTION ANSWERS AND EXPLANATIONS
1. B This is a problem that will be easier to solve by drawing a diagram. In doing so, you will see that that distance moved west and east cancel out. The southward movement is 5 m longer than the northward movement, so the total displacement is 5 m south. Be sure to differentiate displacement from distance, because the shopper moved a total distance of 79 m.
2. D Because he ran straight, his displacement is the same as his distance.
![]()
3. E To find an example of instantaneous velocity, look for a vector quantity that describes a particular instant in time. E meets these requirements. A and C describe average velocity, B describe instantaneous speed, and D provides an example of average speed.
4. A The physics of this type of question is straightforward, but there is a little trick. Because the initial velocity is zero, the change in velocity is 88 km/h and the elapsed time is 5.9 s. Notice that the velocity is given in km/h but time is given in s. In addition, the choices are shown in m/s2. Before you can do anything, you need to convert the velocity to m/s.
![]()
Average acceleration equals the change in velocity divided by the elapsed time.
![]()
5. C Solving this problem comes down to selecting the correct kinematic equation. The known values are ![]() ,
, ![]() ,
, ![]() , and
, and ![]() . The unknown is the time t. The equation you need is
. The unknown is the time t. The equation you need is ![]() . Once you substitute xo and vo into the equation, it simplifies to
. Once you substitute xo and vo into the equation, it simplifies to ![]() . By rearranging to solve for t, the equation becomes
. By rearranging to solve for t, the equation becomes  .
.
6. B The acceleration is constant from t = 0 to ![]() and again from
and again from ![]() to
to ![]() . The constant acceleration means that you can use of your kinematic equations:
. The constant acceleration means that you can use of your kinematic equations: ![]() at. At
at. At ![]() s, the speed of the particle is
s, the speed of the particle is ![]() . At
. At ![]() s, the speed of the particle is
s, the speed of the particle is ![]() .
.
7. B Use the change in velocity and the elapsed time to calculate the acceleration. Car A starts from rest so its initial velocity is zero. At the end of 70 s, its velocity is 70 m/s according to the graph.
![]()
8. D Car A starts at rest and moves with constant acceleration. The distance traveled is therefore one-half the product of its acceleration and the square of the time traveled.
![]()
9. C For a graph of speed versus time, you can use the area under the graph to find the distance traveled during that interval. Car B travels at a constant speed so the area under the graph for each 20-second interval is 8 squares. For Car A, you must examine each individual interval. Between t = 0 to ![]() , there are 2 squares under the graph. Between
, there are 2 squares under the graph. Between ![]() to
to ![]() , there are 6 squares under the graph. Between
, there are 6 squares under the graph. Between ![]() to
to ![]() , there are 12 squares under the graph.
, there are 12 squares under the graph.
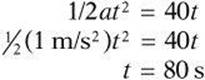
10. E Car B travels at a constant speed of 40 m/s. The distance traveled is the product of the speed and the elapsed time, 40t. The cars meet when they travel the same distance. The distance Car A travels is 1/2at2. Set the two expressions equal to each other and solve for t.