SAT Test Prep
CHAPTER 11
ESSENTIAL ALGEBRA 2 SKILLS
Lesson 2: Functions
What Is a Function?
A function is any set of instructions for turning an input number (usually called x) into an output number (usually called y). For instance, ![]() is a function that takes any input x and multiplies it by 3 and then adds 2. The result is the output, which we call f (x) or y.
is a function that takes any input x and multiplies it by 3 and then adds 2. The result is the output, which we call f (x) or y.
If ![]() , what is f (2h)?
, what is f (2h)?
In the expression f (2h), the 2h represents the input to the function f. So just substitute 2h for x in the equation and simplify: ![]() .
.
Functions as Equations, Tables, or Graphs
The SAT usually represents a function in one of three ways: as an equation, as a table of inputs and outputs, or as a graph on the xy-plane. Make sure that you can work with all three representations. For instance, know how to use a table to verify an equation or a graph, or how to use an equation to create or verify a graph.
Linear Functions
A linear function is any function whose graph is a line. The equations of linear functions always have the form ![]() , where m is the slope of the line, and b is where the line intersects the y-axis. (For more on slopes, see Chapter 10, Lesson 4.)
, where m is the slope of the line, and b is where the line intersects the y-axis. (For more on slopes, see Chapter 10, Lesson 4.)
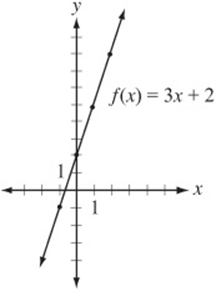
The function ![]() is linear with a slope of 3 and a y-intercept of 2. It can also be represented with a table of x and y (or f (x)) values that work in the equation:
is linear with a slope of 3 and a y-intercept of 2. It can also be represented with a table of x and y (or f (x)) values that work in the equation:
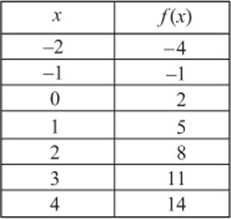
Notice several important things about this table. First, as in every linear function, when the x values are “evenly spaced,” the y values are also “evenly spaced.” In this table, whenever the x value increases by 1, the y value increases by 3, which is the slope of the line and the coefficient ofx in the equation. Notice also that the y-intercept is the output to the function when the input is 0.
Now we can take this table of values and plot each ordered pair as a point on the xy-plane, and the result is the graph of a line:
Quadratic Functions
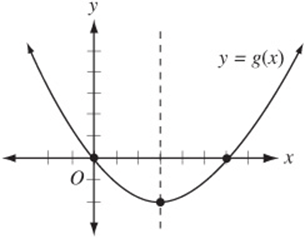
The graph of a quadratic function is always a parabola with a vertical axis of symmetry. The equations of quadratic functions always have the form ![]() , where c is the y-intercept. When a (the coefficient of x2) is positive, the parabola is “open up,” and when a is negative, it is “open down.”
, where c is the y-intercept. When a (the coefficient of x2) is positive, the parabola is “open up,” and when a is negative, it is “open down.”
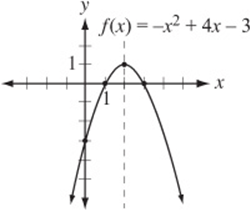
The graph above represents the function ![]() . Notice that it is an “open down” parabola with an axis of symmetry through its vertex at
. Notice that it is an “open down” parabola with an axis of symmetry through its vertex at ![]() .
.
The figure above shows the graph of the function f in the xy-plane. If ![]() , which of the following could be the value of b?
, which of the following could be the value of b?
(A) –3
(B) –2
(C) 2
(D) 3
(E) 4
Although this can be solved algebraically, you should be able to solve this problem more simply just by inspecting the graph, which clearly shows that ![]() . (You can plug
. (You can plug ![]() into the equation to verify.) Since this point is two units from the axis of symmetry, its reflection is two units on the other side of the axis, which is the point (4, –3).
into the equation to verify.) Since this point is two units from the axis of symmetry, its reflection is two units on the other side of the axis, which is the point (4, –3).
Concept Review 2: Functions
1. What is a function?
2. What are the three basic ways of representing a function?
3. What is the general form of the equation of a linear function, and what does the equation tell you about the graph?
4. How can you determine the slope of a linear function from a table of its inputs and outputs?
5. How can you determine the slope of a linear function from its graph?
6. What is the general form of the equation of a quadratic function?
7. What kind of symmetry does the graph of a quadratic function have?
SAT Practice 2: Functions
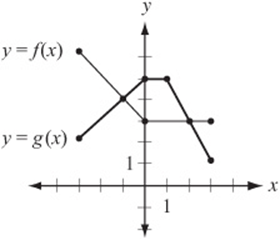
1. The graphs of functions f and g for values of x between –3 and 3 are shown above. Which of the following describes the set of all x for which ![]()
![]()
![]() or
or ![]()
![]()
![]()
![]()
2. If ![]() and
and ![]() , which of the following could be g (x)?
, which of the following could be g (x)?
(A) 3 x
![]()
![]()
![]()
![]()
3. What is the least possible value of ![]() if
if ![]()
(A) –3
(B) –2
(C) –1
(D) 0
(E) 1
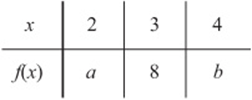
4. The table above gives the value of the linear function f for several values of x. What is the value of ![]()
(A) 8
(B) 12
(C) 16
(D) 24
(E) It cannot be determined from the information given.
5. The graph on the xy-plane of the quadratic function g is a parabola with vertex at (3, –2). If ![]() , then which of the following must also equal 0?
, then which of the following must also equal 0?
(A) g (2)
(B) g (3)
(C) g (4)
(D) g (6)
(E) g (7)
6. In the xy-plane, the graph of the function h is a line. If ![]() and
and ![]() , what is the value of h (0)?
, what is the value of h (0)?
(A) 2.0
(B) 2.2
(C) 3.3
(D) 3.5
(E) 3.7
Answer Key 2: Functions
Concept Review 2
1. A set of instructions for turning an input number (usually called x) into an output number (usually called y).
2. As an equation (as in ![]() ), as a table of input and output values, and as a graph in the xy-plane.
), as a table of input and output values, and as a graph in the xy-plane.
![]() , where m is the slope of the line and b is its y-intercept.
, where m is the slope of the line and b is its y-intercept.
4. If the table provides two ordered pairs, (x1, y1) and (x2, y2), the slope can be calculated with  . (Also see Chapter 10, Lesson 4.)
5. Choose any two points on the graph and call their coordinates (x1, y1) and (x2, y2). Then calculate the slope with .
![]() , where c is the y-intercept.
, where c is the y-intercept.
7. It is a parabola that has a vertical line of symmetry through its vertex.
SAT Practice 2
1. C In this graph, saying that ![]() is the same as saying that the g function “meets or is above” the f function. This is true between the points where they meet, at
is the same as saying that the g function “meets or is above” the f function. This is true between the points where they meet, at ![]() and
and ![]() .
.
2. B Since ![]() , f (g (1)) must equal
, f (g (1)) must equal ![]() . Therefore
. Therefore ![]() and
and ![]() . So g (x) must be a function that gives an output of 4 when its input is 1. The only expression among the choices that equals 4 when
. So g (x) must be a function that gives an output of 4 when its input is 1. The only expression among the choices that equals 4 when ![]() is
is ![]() .
.
3. D This question asks you to analyze the “outputs” to the function ![]() given a set of “inputs.” Don”t just assume that the least input, –3, gives the least output,
given a set of “inputs.” Don”t just assume that the least input, –3, gives the least output, ![]() . In fact, that”s not the least output. Just think about the arithmetic:
. In fact, that”s not the least output. Just think about the arithmetic: ![]() is the square of a number. What is the least possible square of a real number? It must be 0, because 02 equals 0, but the square of any other real number is positive. Can
is the square of a number. What is the least possible square of a real number? It must be 0, because 02 equals 0, but the square of any other real number is positive. Can ![]() in this problem equal 0? Certainly, if
in this problem equal 0? Certainly, if ![]() , which is in fact one of the allowed values of x. Another way to solve the problem is to notice that the function
, which is in fact one of the allowed values of x. Another way to solve the problem is to notice that the function ![]() is quadratic, so its graph is a parabola. Choose values of x between –3 and 0 to make a quick sketch of this function to see that its vertex is at (–2, 0).
is quadratic, so its graph is a parabola. Choose values of x between –3 and 0 to make a quick sketch of this function to see that its vertex is at (–2, 0).
4. C Since f is a linear function, it has the form ![]() . The table shows that an input of 3 gives an output of 8, so
. The table shows that an input of 3 gives an output of 8, so ![]() . Now, if you want, you can just “guess and check” values for m and b that work, for instance,
. Now, if you want, you can just “guess and check” values for m and b that work, for instance, ![]() and
and ![]() . This gives the equation
. This gives the equation ![]() . To find the missing outputs in the table, just substitute
. To find the missing outputs in the table, just substitute ![]() and then
and then ![]() :
: ![]() and
and ![]() . Therefore,
. Therefore, ![]() . But how do we know that
. But how do we know that ![]() will always equal 16? Because the slope m of any linear function represents the amount thaty increases (or decreases) whenever x increases by 1. Since the table shows x values that increase by 1, a must equal
will always equal 16? Because the slope m of any linear function represents the amount thaty increases (or decreases) whenever x increases by 1. Since the table shows x values that increase by 1, a must equal ![]() , and b must equal 8 + m. Therefore
, and b must equal 8 + m. Therefore ![]() .
.
5. D Don”t worry about actually finding the equation for g (x). Since g is a quadratic function, it has a vertical line of symmetry through its vertex, the line ![]() . Since
. Since ![]() , the graph also passes through the origin. Draw a quick sketch of a parabola that passes through the origin and (3, –2) and has an axis of symmetry at
, the graph also passes through the origin. Draw a quick sketch of a parabola that passes through the origin and (3, –2) and has an axis of symmetry at ![]() :
:
The graph shows that the point (0, 0), when reflected over the line ![]() , gives the point (6, 0). Therefore g (6) is also equal to 0.
, gives the point (6, 0). Therefore g (6) is also equal to 0.
6. D The problem provides two ordered pairs that lie on the line: (–1, 4) and (5, 1). Therefore, the slope of this line is ![]() . Therefore, for every one step that the line takes to the right (the x direction), the y value decreases by ½. Since 0 is one unit to the right of –1 on the x-axis, h (0) must be1/2 less than h ((–1), or
. Therefore, for every one step that the line takes to the right (the x direction), the y value decreases by ½. Since 0 is one unit to the right of –1 on the x-axis, h (0) must be1/2 less than h ((–1), or ![]() .
.