SAT 2016
CHAPTER 8
The SAT Math Test: Problem Solving and Data Analysis
Skill 3: Working with Tables of Data
Lesson 10: Using tables as problem-solving tools
A table can be useful for organizing information that falls into categories. Even if a problem does not include a table, ask yourself: does the information in this problem fall into non-overlapping categories? If so, consider setting up a table with the categories as row or column labels.
A committee determines that it will meet on the Thursday after the third Monday of every month. What is the latest date of the month on which this meeting could fall?
A) the 17th
B) the 18nd
C) the 24rd
D) the 25th
(Medium) A calendar, which of course is a kind of table, can be handy here. But how do we fill in the numbers? Since we want the latest date of the month possible, we need to find the latest date on which the third Monday could fall. A little trial-and-error should reveal that the latest thefirst Monday could fall is the 7th.
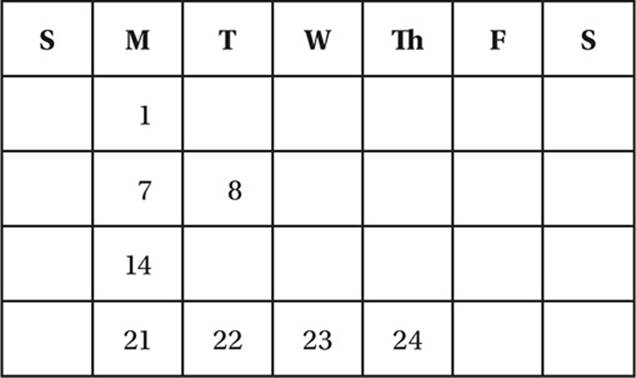
Since there are seven days per week, the second Monday must be the 14th and the third must be the 21st. Therefore the meeting will be three days later, on Thursday the 24th. We don”t have to complete the entire calendar page to solve the problem.
Sam is considering buying a car, and has two models to choose from. Model N has a sticker price that is 25% higher than that of Model P, but he will receive $1,500 in trade-in credit from the Model N dealer and only $1,000 in trade-in credit from the Model P dealer. Even after the trade-in credits are applied to both cars, Model N is still $2,000 more expensive than Model P (before taxes and fees). What is the sticker price of Model N?
A) $10,000
B) $12,000
C) $12,500
D) $13,000
(Medium) Again, this problem does not give us a table, but the fact that we must keep track of two car models and two prices per car model (sticker price and post trade-in price) suggests that a table might be useful.
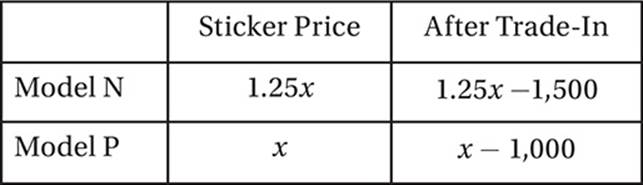
Since Model N has a sticker price that is 25% higher than that of Model P, if the sticker price of Model P is x, then the sticker price for Model N is 1.25x. The respective costs after trade-in, then, are 1.25x − 1,500 and x − 1,000. Now we must solve for x by setting up an equation, which comes from the fact that, even after the trade-in, Model N is still $2,000 more expensive. Therefore 1.25x − 1500 = (x − 1,000) + 2,000.
Simplify:
1.25x − 1,500 = x + 1,000
Add 1,500 and subtract x:
0.25x = 2,500
Divide by 0.25:
x = 10,000
Now, keep in mind that the question is asking for the sticker price of Model N, not Model P. Therefore the correct answer is (1.25)(10,000) = 12,500.
Lesson 11: Finding conditional probabilities and population fractions
OPINION ON PROPOSAL 547
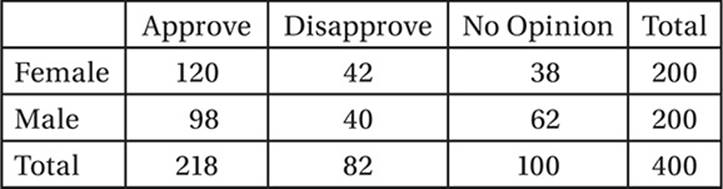
According to the results of the poll indicated in the table above, what percent of those who expressed an opinion on the proposal were female?
A) 52%
B) 54%
C) 68%
D) 81%
(Medium) This question asks us to find a population fraction, that is, a part-to-whole fraction. This question is almost identical to asking a conditional probability question, namely: if a poll subject who expressed an opinion on Proposal 547 is chosen at random, what is the probability that the person is female?
The probability of an event is a part-to-whole ratio, and therefore can have only a value from 0 to 1. An event with probability 0 is impossible, and an event with probability 1 is certain.
The table indicates that the total number of respondents who expressed an opinion is 218 + 82 = 300. Of these, 120 + 42 = 162 are women, and therefore the percent of these that are women is 162/300 × 100% = 54%. Alternately, we could say that if a respondent expressing an opinion were chosen at random, that person would have a 0.54 probability of being female.
Lesson 12: Analyzing variable relations with tables
In Lesson 4 we used tables to identify direct and inverse variations between variables, but ordered pairs of variables can have many other relationships as well.
Tables—along with graphs and equations—are important tools for analyzing functional relationships between variables. When given an equation expressing y in terms of x, you should know how to generate a table of ordered pairs and use that table to graph the relationship. Alternately, you should learn to analyze the properties of a function from that table of values.
Even if our equation is complicated, like
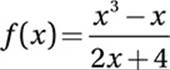
we can just pick values for x, like −3, −2, −1, 0, 1, 2, and 3, use these to calculate the corresponding values of y (or f(x)) and create a table of ordered pairs
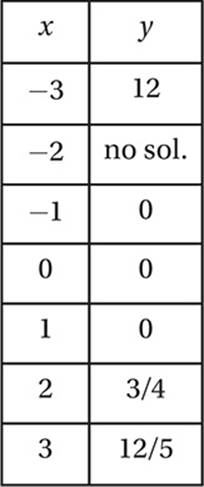
which we can then use to plot points on a graph.
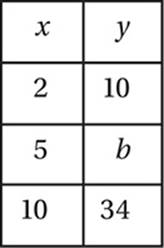
If the variables x and y in the table above have a linear relationship, what is the value of b?
A) 19
B) 20
C) 21
D) 22
(Medium) One way to approach this question is to use the fact that, in a linear relation, the y increases in proportion to the change in x. This rate of increase is the slope of the line. Taking the first and third ordered pairs, it seems that when x increases by 10 − 2 = 8, y in turn increases by 34 − 10 = 24. Therefore, the slope of the line is 24/8 = 3. That is, every time the x coordinate increases by 1, the y coordinate increases by 3. Now looking at the first and second ordered pairs, since x is increasing by 5 − 2 = 3, y must increase by 3(3) = 9, and so b is equal to 10 + 9 = 19, and the correct answer is (A).
Another way to look at it is that we have solved the proportion 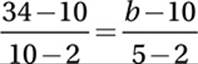 :
:
Simplify:
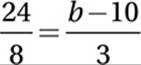
Cross multiply:
72 = 8b − 80
Add 80:
152 = 8b
Divide by 8:
19 = b
Exercise Set 4 (Calculator)
1
BACTERIA CULTURE POPULATION
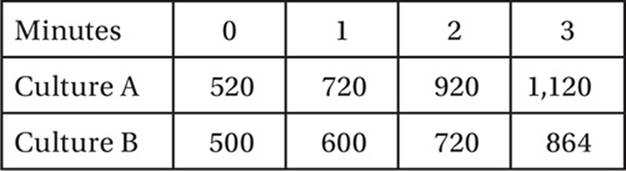
Which of the following equations best expresses the population, P, of bacteria culture A, as a function of t, in minutes?
A) P = 200t + 520
B) P = 520(1.4)t
C) P = 2,000(t − 0.5)2
D) P = 520t + 200
2
Which of the following equations best expresses the population, P, of bacteria culture B, as a function of t, in minutes?
A) P = 100t + 500
B) P = 500(1.2)t
C) P = 2,000(t − 0.5)2
D) P = 500t + 100
3
After 2 minutes, the population of culture A is what percent greater than the population of culture B?
A) 16.7%
B) 20.0%
C) 27.8%
D) 127.8%
4
If culture A continues to grow at a constant rate, at what time should its population reach 2,000?
A) 7 minutes 4 seconds
B) 7 minutes 24 seconds
C) 7 minutes 40 seconds
D) 8 minutes 20 seconds
5
By what percent did the population of culture B increase over the first 3 minutes?
A) 36.4%
B) 42.1%
C) 72.8%
D) 172.8%
![]()
Questions 6–8 refer to the following information
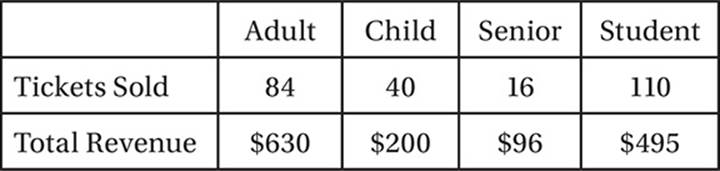
TALENT SHOW TICKETS
6
According to the table above, how much is the price of one senior ticket?
A) $4.00
B) $6.00
C) $12.00
D) $16.00
7
How much more is the cost of one adult ticket than the cost of one student ticket?
A) $0.50
B) $1.50
C) $2.50
D) $3.00
8
Which is closest to the average (arithmetic mean) price of the 250 tickets sold?
A) $5.54
B) $5.59
C) $5.68
D) $5.72
![]()
9
What is the median price of the 250 tickets sold?
A) $5.00
B) $5.50
C) $5.75
D) $6.00
10
If a meeting must take place on the third Tuesday of the month, what is the earliest date of the month on which it could take place?
A) the 14th
B) the 15th
C) the 22nd
D) the 27th
11
What is the latest date of the month on which the meeting could take place?
A) the 13th
B) the 14th
C) the 21st
D) the 26th
![]()
Questions 12–21 refer to the following information
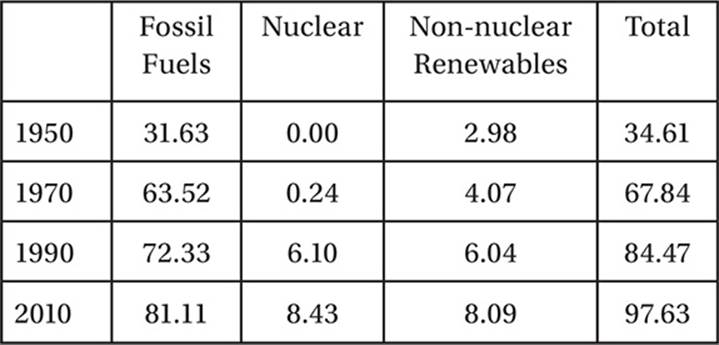
U.S. ENERGY CONSUMPTION (Quadrillion BTU (QBTU))
12
From 1970 to 1990, the percent increase in the U.S. consumption of nuclear energy was closest to
A) 96%
B) 240%
C) 2,400%
D) 3,400%
13
In a pie graph representing total U.S. energy consumption in 2010, the sector representing non nuclear renewables would have a central angle measuring approximately
A) 8°
B) 12°
C) 24°
D) 30°
14
Nuclear energy and renewable energy are often grouped together in the category “non-greenhouse” energy. In 1970, approximately what percent of non-greenhouse energy was nuclear?
A) 0.4%
B) 5.6%
C) 5.9%
D) 6.4%
15
In 2010 what percent of non-greenhouse energy consumption was nuclear?
A) 9%
B) 29%
C) 49%
D) 51%
16
In the four years shown, what percent of the total energy consumed was due to non-nuclear renewables?
A) 5.6%
B) 6.8%
C) 7.4%
D) 7.9%
17
What was the percent increase in fossil fuel energy consumption between 1950 and 2010?
A) 28%
B) 61%
C) 124%
D) 156%
18
The “renewability index” is defined as the fraction of total U.S. energy consumption that comes from non-nuclear renewable energy. What was the percent increase in the renewability index from 1970 to 2010?
A) 17%
B) 37%
C) 47%
D) 99%
19
For how many of the years shown above did fossil fuels account for less than 90% of the annual U.S. energy consumption?
A) One
B) Two
C) Three
D) Four
20
Between 1950 and 2010, the average annual rate of increase in the consumption of non-nuclear renewable energy was closest to
A) 0.085 QBTU/yr
B) 0.128 QBTU/yr
C) 1.70 QBTU/yr
D) 2.27 QBTU/yr
21
Between 1970 and 2010, the annual consumption of fossil fuels in the U.S. increased nearly linearly. If this linear trend were to continue, which of the following is closest to the level of U.S. fossil fuel consumption we would expect for 2035 (in quadrillion BTUs)?
A) 90
B) 91
C) 92
D) 93
![]()
EXERCISE SET 4 ANSWER KEY
1. A According to the table, the population of culture A increases by 200 bacteria every minute, indicating a linear relationship with a slope of 200. (Remember that the slope of a function is equivalent to its unit rate of change.) Choice (A) is the only option that indicates a line with slope 200.
2. B The table indicates that culture B is not increasing linearly, since the population difference from minute to minute is not constant, but increasing. This rules out choices (A) and (D). By substituting t = 0, t = 1 and t = 2, we can see that only the function in (B) gives the correct populations. Notice that the base of the exponential, 1.2, indicates that the population grows by 20% each minute.
3. C At the 2 minute mark, the populations are 920 and 720, respectively, so culture A has a population that is (920 − 720)/720 × 100% = 27.8% greater.
4. B If we use the population equation (see question 1), we can solve for t. Plugging in 2,000 for P gives us 2,000 = 200t + 520, which gives a solution of t = 7.4 minutes. Since 0.4 minutes equals 0.4 × 60 = 24 seconds, the time elapsed is 7 minutes 24 seconds.
5. C In the first 3 minutes, culture B grew from 500 to 864 bacteria, which is an increase of (864 − 500)/500 × 100% = 72.8%.
6. B The total revenue for each ticket type equals the price per ticket times the number of tickets sold. Therefore, the price for each senior ticket is $96 ÷ 16 = $6.
7. D One adult ticket costs $630 ÷ 84 = $7.50, and one student ticket costs $495 ÷ 110 = $4.50, so each adult ticket costs $3 more.
8. C The average price per ticket equals the total revenue for all tickets divided by the number of tickets: ($630 + $200 + $96 + $495)/250 = $5.684.
9. A The median price of 250 tickets is the average of the prices of the 125th and 126th tickets, if the price for each ticket is listed in increasing order. The ticket prices, in increasing order, are $4.50 for students (110 tickets), $5.00 for children (40 tickets), $6.00 for seniors (16 tickets), and $7.50 for adults (84 tickets). With this ordering, the 125th and 126th price are both $5.00.
10. B The earliest the first Tuesday could be is the 1st, so the earliest the third Tuesday could be is the 15th.
11. C The latest the first Tuesday could be is the 7th, so the latest the third Tuesday could be is the 21st.
12. C In 1970, nuclear energy consumption was 0.24, and in 1990 it was 6.10. This represents an increase of (6.10 − 0.24)/0.24 × 100% = 2,442%.
13. D In 2010, non nuclear renewables accounted for 8.09/97.63 × 100% = 8.3% of consumption, which would correspond to a 0.083 × 360° = 29.88° central angle.
14. B In 1970, the total “non-greenhouse” energy was 0.24 + 4.07 = 4.31. Therefore the percent that was nuclear is 0.24/4.31 × 100% = 5.6%.
15. D In 2010, this percent was 8.43/(8.43 + 8.09) × 100% = 51%.
16. C The total non nuclear renewable energy consumption for the four years is 2.98 + 4.07 + 6.04 + 8.09 = 21.18, and the total energy consumption is 34.61 + 67.84 + 84.47 + 97.63 = 284.55. Therefore the percent is 21.18/284.55 × 100% = 7.4%.
17. D In 1950, fossil fuel consumption was 31.63, and in 2010 it was 81.11. This is an increase of (81.11 − 31.63)/31.63 × 100% = 156%.
18. B In 1970, the renewability index was 4.07/67.84 = 0.060, and in 2010 it was 8.09/97.63 = .082. This is a percent increase of (0.082 − 0.060)/0.060 × 100% = 37%.
19. B In 1990, the percent of consumption from fossil fuels was 72.33/84.47 × 100% = 85.6%, and in 2010 it was 81.11/97.62 × 100% = 83.1%.
20. A The annual rate of increase is the total increase divided by the time span in years. The total increase is 8.09 − 2.98 = 5.11. Over a 60-year span, this gives a rate of 5.11/60 = 0.085.
21. C In the 40 year span from 1970 to 2010, fossil fuel consumption increased at a rate of (81.11 − 63.52)/40 = 0.44 QBTU/Yr. In 25 more years at this rate, the consumption should be 81.11 + 25(0.44) = 92.11 QBTU.