Cracking the New SAT with 4 Practice Tests, 2016 Edition (2015)
Part IV. How to Crack the Math Test
Chapter 14. Advanced Arithmetic
Now that we have reviewed some mathematical fundamentals and some algebra, it is time to jump into our review of the more advanced arithmetic concepts you will find on the SAT. Many Math questions test concepts you learned in junior high school, such as averages and proportions. Some difficult questions build on these basic concepts by requiring you to use charts and data to obtain your numbers or combine multiple techniques. In this chapter, we will review the arithmetic concepts you’ll need to know for the SAT and show you how to apply these concepts when working with charts and data. All the questions in this chapter will appear in the Calculator section of the test.
RATIOS AND PROPORTIONS
A Ratio Is a Comparison
Many students get extremely nervous when they are asked to work with ratios. But there’s no need to be nervous. A ratio is a comparison between the quantities of ingredients you have in a mixture, be it a class full of people or a bowl of cake batter. Ratios can be written to look like fractions—don’t get them confused.
The ratio of x to y can be expressed in the following three ways:
1.![]()
2.the ratio of x to y
3.x:y
Part, Part, Whole
Ratios are a lot like fractions. In fact, anything you can do to a fraction (convert it to a decimal or percentage, reduce it, and so on), you can do to a ratio. The difference is that a fraction gives you a part (the top number) over a whole (the bottom number), while a ratio typically gives you two parts (boys to girls, CDs to cassettes, sugar to flour), and it is your job to come up with the whole. For example, if there is one cup of sugar for every two cups of flour in a recipe, that’s three cups of stuff. The ratio of sugar to flour is 1:2. Add the parts to get the whole.
Ratios vs. Fractions
Keep in mind that a ratio
compares part of
something to another part.
A fraction compares
part of something to the
whole thing.
Ratio: 
Fraction: 
Ratio to Real
If a class contains 3 students and the ratio of boys to girls in that class is 2:1, how many boys and how many girls are there in the class? Of course: There are 2 boys and 1 girl.
Now, suppose a class contains 24 students and the ratio of boys to girls is still 2:1. How many boys and how many girls are there in the class? This is a little harder, but the answer is easy to find if you think about it. There are 16 boys and 8 girls.
How did we get the answer? We added up the number of “parts” in the ratio (2 parts boys plus 1 part girls, or 3 parts all together) and divided it into the total number of students. In other words, we divided 24 by 3. This told us that the class contained 3 equal parts of 8 students each. From the given ratio (2:1), we knew that two of these parts consisted of boys and one of them consisted of girls.
An easy way to keep track of all this is to use a tool we call the Ratio Box.
Here’s how it works:
Let’s go back to our class containing 24 students, in which the ratio of boys to girls is 2:1. Quickly sketch a table that has columns and rows, like this:

This is the information you have been given. The ratio is 2:1, so you have 2 parts boys and 1 part girls, for a total of 3 parts. You also know that the actual number of students in the whole class is 24. You start by writing these numbers in the proper spaces in your box.
Your goal is to fill in the two empty spaces in the bottom row. To do that, you will multiply each number in the parts row by the same number. To find that number, look in the last column. What number would you multiply by 3 to get 24? You should see easily that you would multiply by 8. Therefore, write an 8 in all three blanks in the Multiply By row. (The spaces in this row will always contain the same number, although of course it won’t always be an 8.) Here’s what your Ratio Box should look like now:
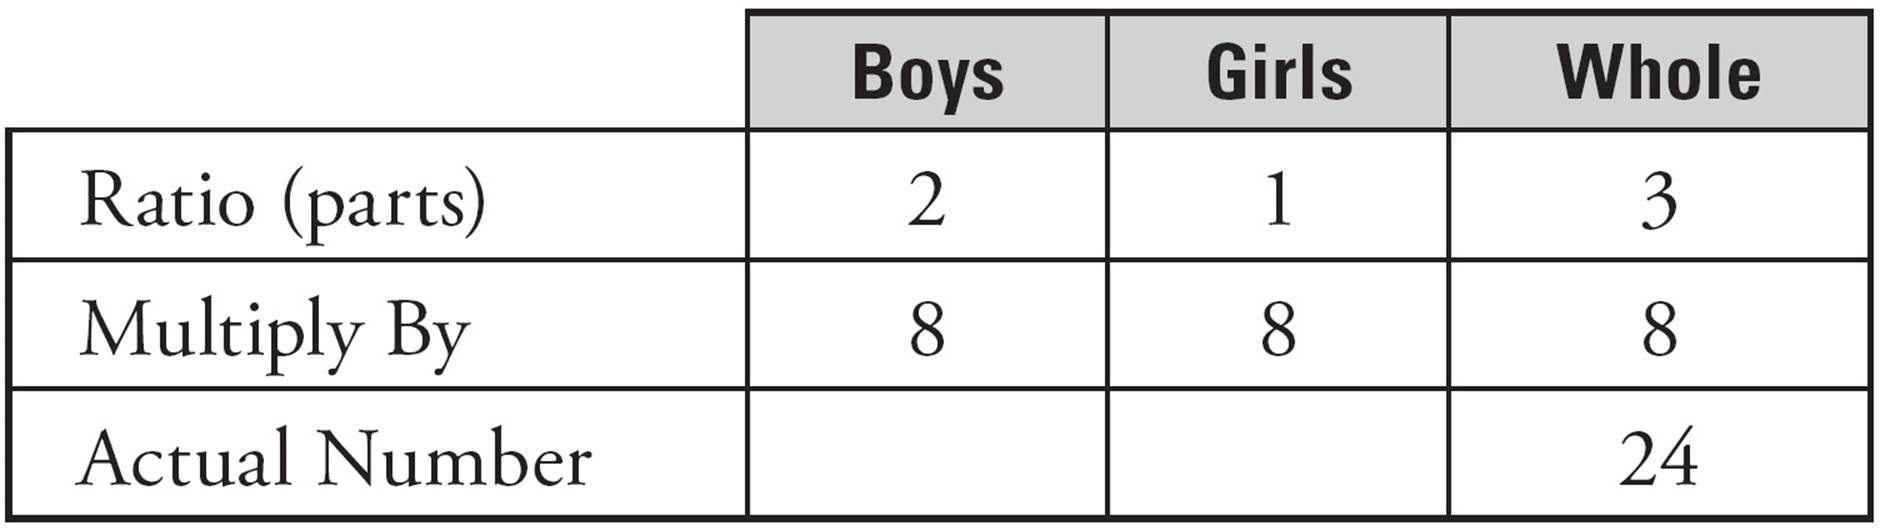
The next step is to fill in the empty spaces in the bottom row. You do that the same way you did in the last column, by multiplying. First, multiply the numbers in the boys column (2 × 8 = 16). Then multiply the numbers in the girls column (1 × 8 = 8).
Here’s what your box should look like now:

Now you have enough information to answer any question you might be asked. Here are some examples:
•What is the ratio of boys to girls? You can see easily from the ratio (parts) row of the box that the ratio is 2:1.
•What is the ratio of girls to boys? You can see easily from the ratio (parts) row of the box that the ratio is 1:2.
•What is the total number of boys in the class? You can see easily from the bottom row of the box that it is 16.
•What is the total number of girls in the class? You can see easily from the bottom row of the box that it is 8.
•What fractional part of the class is boys? There are 16 boys in a class of 24, so the fraction representing the boys is 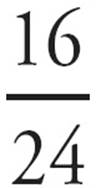 , which can be reduced to
 ![]() .
.
As you can see, the Ratio Box is an easy way to find, organize, and keep track of information on ratio problems. And it works the same no matter what information you are given. Just remember that all the boxes in the Multiply By row will always contain the same number.
Here’s another example:
![]()
12.An acidic solution is mixed so that the mass ratio of nitric acid to water is 2:7. If a total of 270 grams of acid solution is mixed, how many more grams of water are there than the nitric acid?
A)60
B)110
C)150
D)210
Here’s How to Crack It
For this question, your Ratio Box should look like this:
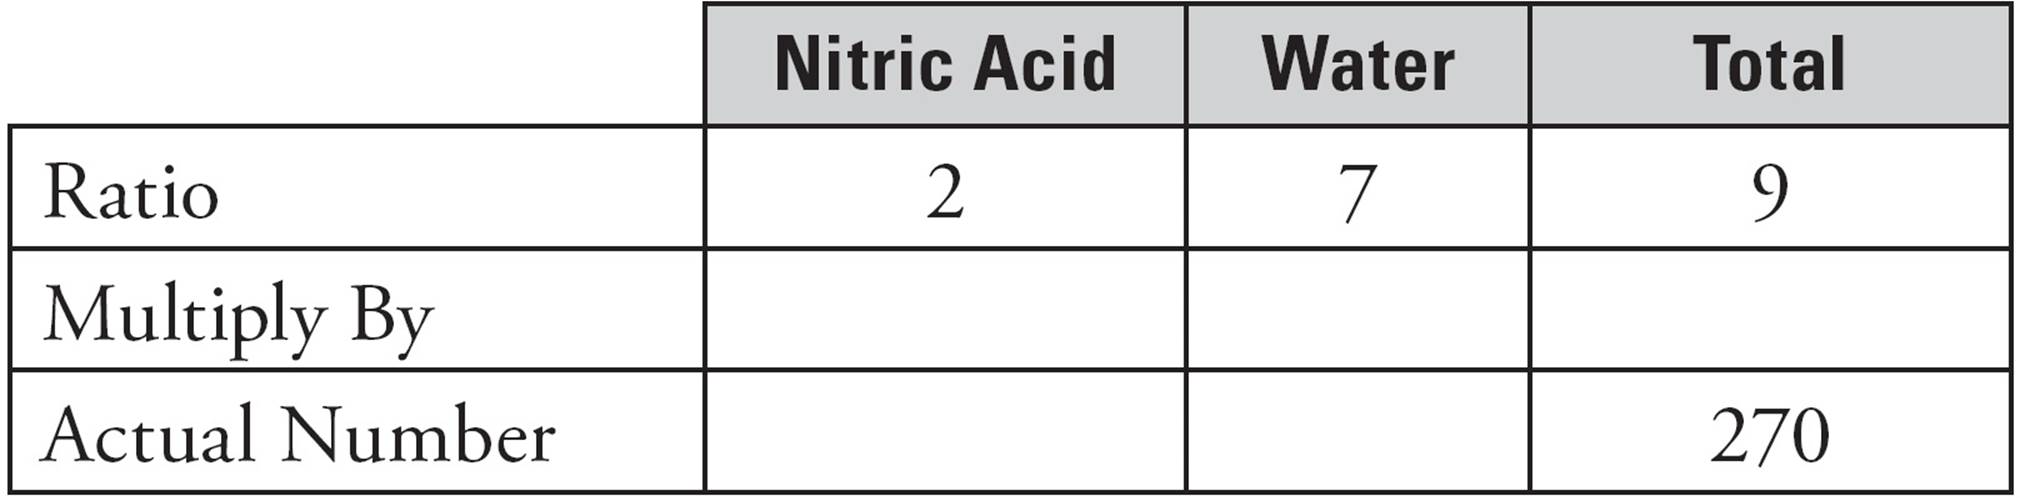
Now find the multiplier. What do you multiply 9 by to get 270? That number is 30, so write 30 in each box in the Multiply By row.
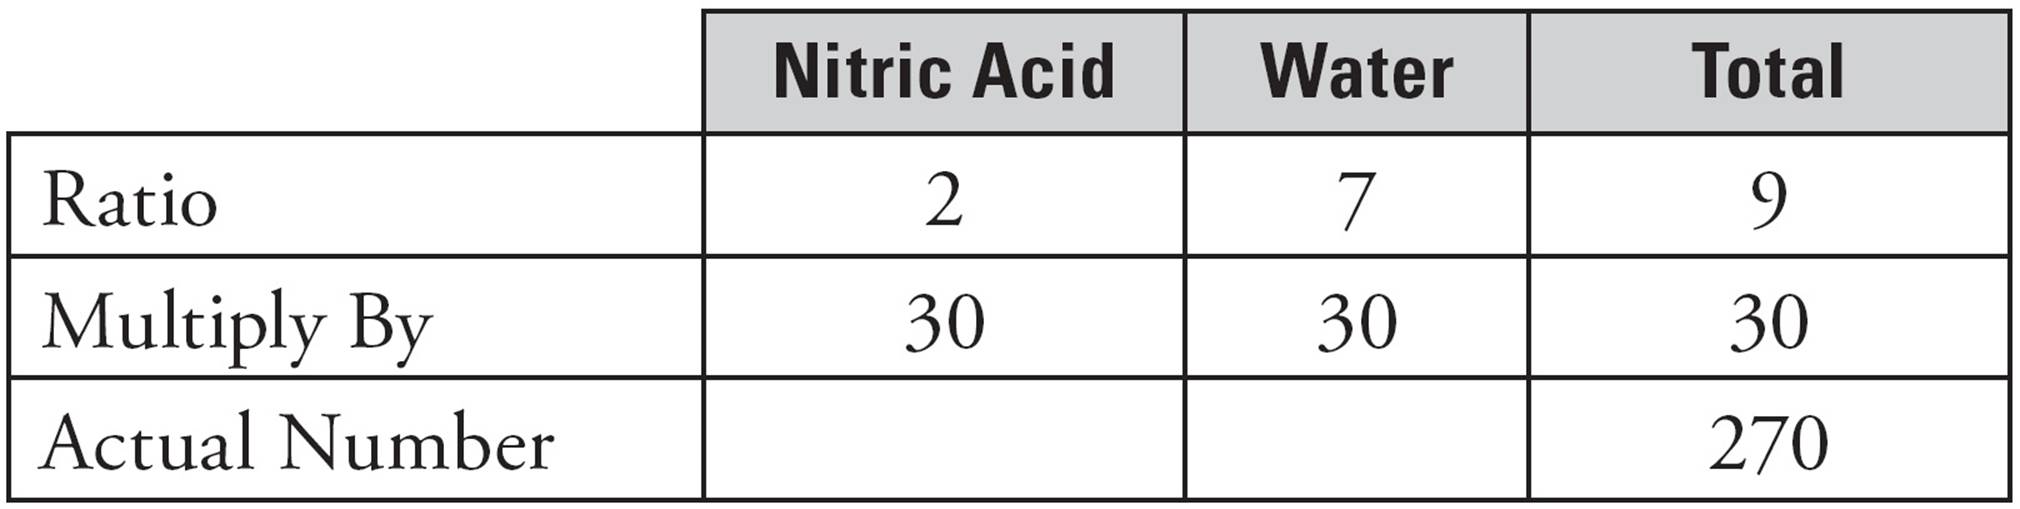
The question asks how many more grams of water are in the solution than there are grams of nitric acid, so multiply both columns to find the actual numbers.
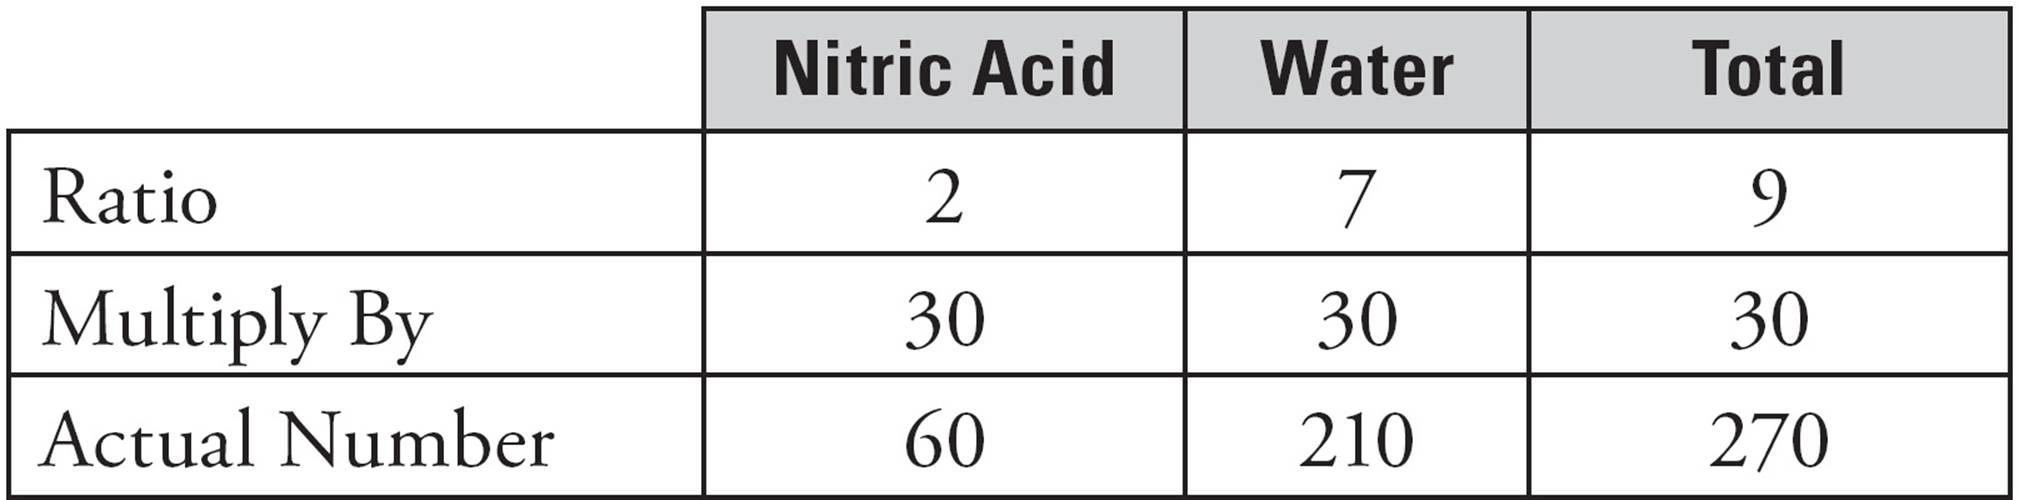
To find the difference between the number of grams of nitric acid and water, subtract: 210 − 60 = 150. The correct answer is (C).
![]()
Don’t forget that you can use more than one technique to solve a problem. There’s no reason why you can’t combine the Ratio Box with some form of Plugging In. In fact, if one technique makes the problem easy, two techniques might make it downright simple!
Here’s a problem for which combining techniques is just the ticket:
![]()
17.In Miss Hoover’s class, the ratio of boys to girls is x to y. If the total number of children in the class is five times the number of boys in the class, and x and y are integers, which of the following could be the sum of x and y ?
A)9
B)10
C)11
D)12
Here’s How to Crack It
Since the problem uses the word ratio, you can use the Ratio Box. However, the Ratio Box works best with numbers rather than variables. What to do? Plug in, of course! It’s difficult to plug in for x and y, because the ratio will depend on the number of boys in the class. Start with that number and say there are 4 boys in the class. The total number of students is therefore 20, or five times 4. Now, it’s time to draw the Ratio Box and fill in what you know:
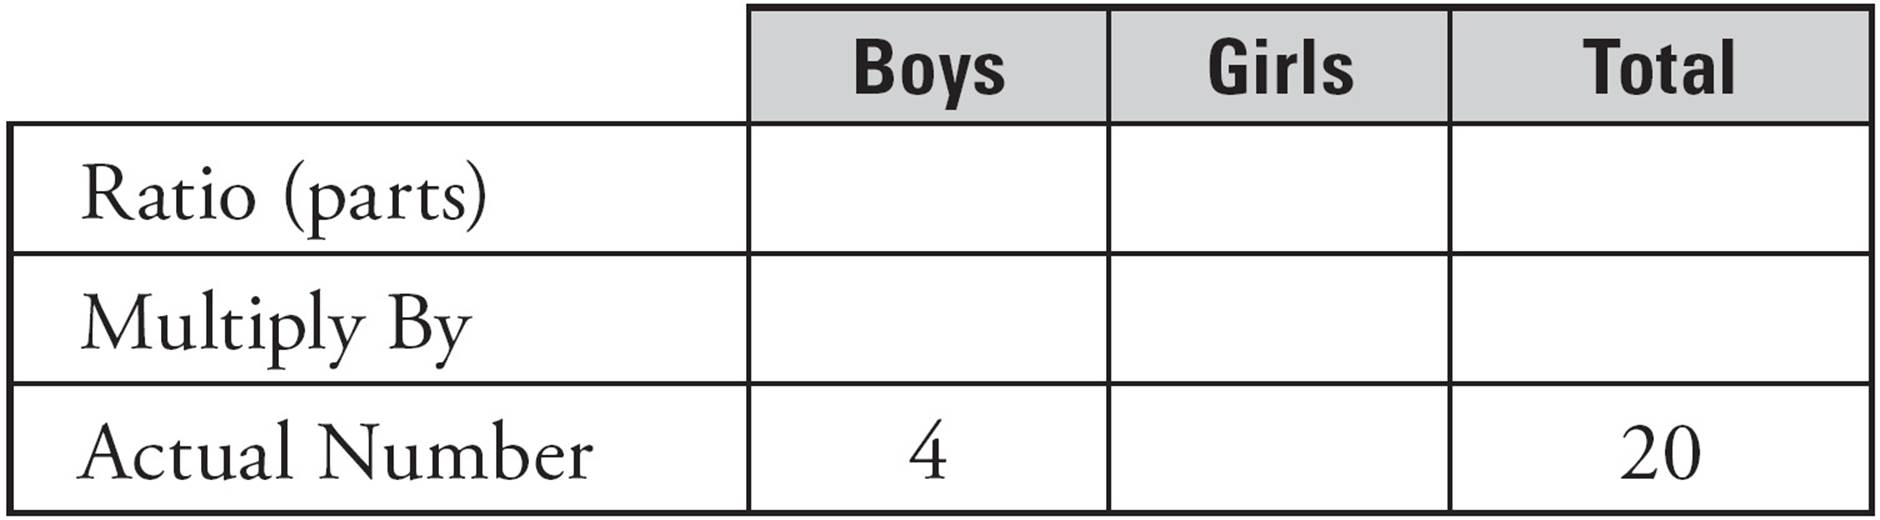
Now use the box to find the ratio, which will give you your x and y values. If there are 4 boys, there are 16 girls. Plug in a simple multiplier, like 2. Work backwards to find the parts of the ratio. If there are 4 actual boys and the multiplier is 2, the boys part of the ratio is 2. The girls part of the ratio is 8. Here’s what your filled-in box should look like:
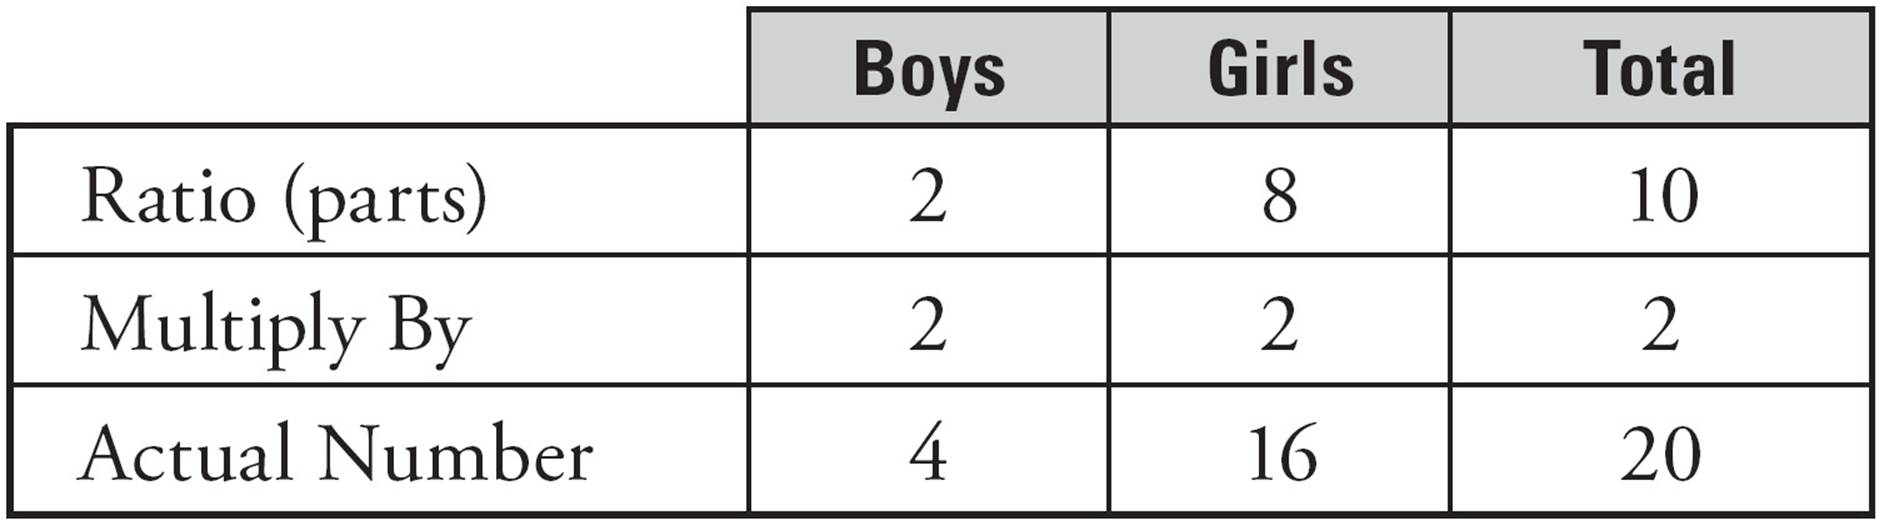
In this example, x = 2 and y = 8, so the sum is 10, which happens to be one of our numbers: (B). We got lucky with the numbers we picked and got exactly what we wanted. Sometimes, you may need to plug in a few times to see if there is a pattern. Regardless of where you start, the sum of the ratio parts in this class will always be a multiple of 5.
![]()
Proportions Are Equal Ratios
Some SAT math problems will contain two proportional, or equal, ratios from which one piece of information is missing.
Here’s an example:
![]()
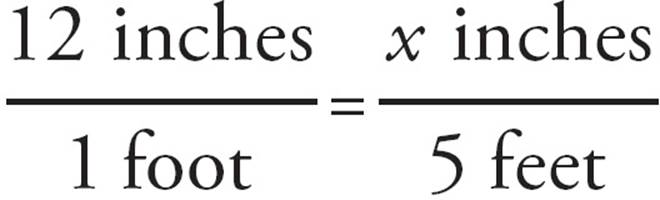
5.If 2 packages contain a total of 12 doughnuts, how many doughnuts are there in 5 packages?
A)24
B)30
C)36
D)60
Here’s How to Crack It
This problem simply describes two equal ratios, one of which is missing a single piece of information. Here’s the given information represented as two equal ratios:
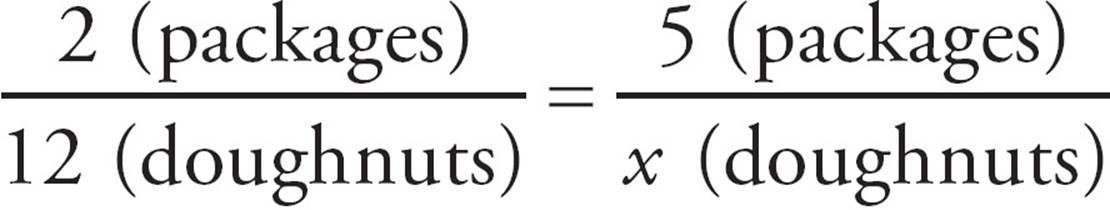
Because ratios can be written so they look like fractions, we can treat them exactly like fractions. To find the answer, all you have to do is figure out what you could plug in for x that would make 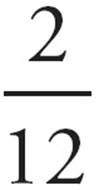 =
= ![]() . Now cross-multiply:
. Now cross-multiply:
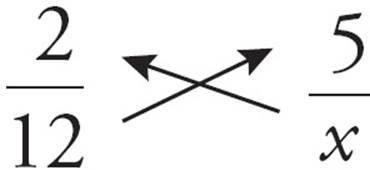
so, 2x = 60
x = 30
The answer is (B).
![]()
Many proportion questions will also involve unit conversion. Make sure to pay attentions to the units and have the same units in both numerators and the same units in both denominators.
Let’s look at an example.
![]()
21.Gary is using a 3D printer to create a miniature version of himself. The scale of the miniature is 0.4 inches to 1 foot of Gary’s actual height. If Gary is 5 feet and 9 inches tall, what will be the height of his 3D-printed miniature? (12 inches = 1 foot)
A)2.0 inches
B)2.3 inches
C)2.6 inches
D)2.9 inches
Here’s How to Crack It
The scale of the 3D printer is in inches and feet—0.4 inches on the miniature for every 1 foot in real life. Start by converting every measurement to inches. There are 12 inches in each foot, so the scale will be 0.4 inches = 12 inches in real life. Now convert Gary’s height into inches. Begin by setting up a proportion to find out how many inches are in 5 feet.
Cross-multiply to find that 5 feet equals 60 inches. Gary is 5 feet and 9 inches tall, so he is 60 + 9 = 69 inches tall. Now set up a proportion with the scale of the miniature and Gary’s height in inches.
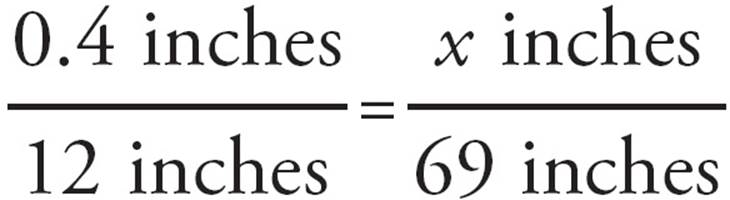
Cross-multiply to get 12x = 27.6, and then divide both sides by 12 to find that x = 2.3 inches. The answer is (B).
![]()
Direct and Inverse Variation
Problems dealing with direct variation (a fancy term for proportion) are exactly what you’ve just seen: If one quantity grows or decreases by a certain amount (a factor), the other quantity grows or decreases by the same amount. Inverse variations (also known as inverse proportions) are just the opposite of that. As one quantity grows or decreases, the other quantity decreases or grows by the same factor.
What’s in a Name?
When you see variation,
think proportion.
The main formula you want to remember for inverse proportions is
x1y1 = x2y2
Try one:
![]()
15.The amount of time it takes to consume a buffalo carcass is inversely proportional to the number of vultures. If it takes 12 vultures 3 days to consume a buffalo, how many fewer hours will it take if there are 4 more vultures?
A)![]()
B)![]()
C)18
D)54
Translate!
Direct means divide.
Since inverse is
the opposite, inverse
means multiply.
Here’s How to Crack It
For inverse proportions, follow the formula. First, convert the days: 3 days is equal to 72 hours. Now set up the equation: (12 vultures)(72 hours) = (16 vultures)(x). We solve to get x = 54, which is 18 fewer hours. The answer is (C).
![]()
Since ratios and proportions are related concepts, you might be wondering how you can tell when you should set the problem up as a proportion and when you should use a Ratio Box. Here are some guidelines to help you decide.
•If the question gives you a ratio and an actual number, use a Ratio Box.
•If the question compares items that have different units (like feet and seconds), set up a proportion.
•If you don’t need the total column in the Ratio Box, then you can also do the question by setting up a proportion.
PERCENTAGES
Percentages Are Fractions
There should be nothing frightening about a percentage. It’s just a convenient way of expressing a fraction whose bottom is 100.
Percent means “per 100” or “out of 100.” If there are 100 questions on your math test and you answer 50 of them, you will have answered 50 out of 100, or  , or 50 percent. To think of it another way:
 =
=  = x percent
Memorize These Percentage-Decimal-Fraction Equivalents
These show up all the time, so go ahead and memorize them.
|
0.01 = |
0.25 = |
|
0.1 = |
0.5 = |
|
0.2 = |
0.75 = |
 = 1 percent
Converting Percentages to Fractions
To convert a percentage to a fraction, simply put the percentage over 100 and reduce:
80 percent =  =
=  =
= ![]()

Another Way
You can also convert
fractions to percentages
by cross-multiplying.
Converting Fractions to Percentages
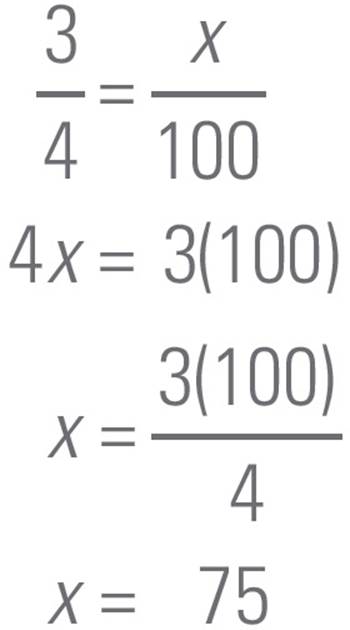
Because a percentage is just another way to express a fraction, you shouldn’t be surprised to see how easy it is to convert a fraction to a percentage. To do so, simply use your calculator to divide the top of the fraction by the bottom of the fraction, and then multiply the result by 100. Here’s an example:
Problem: Express ![]() as a percentage.
as a percentage.
Solution: ![]() = 0.75 × 100 = 75 percent.
= 0.75 × 100 = 75 percent.
Converting fractions to percentages is easy with your calculator.
Converting Percentages to Decimals
To convert a percentage to a decimal, simply move the decimal point two places to the left. For example, 25 percent can be expressed as the decimal 0.25; 50 percent is the same as 0.50 or 0.5; 100 percent is the same as 1.00 or 1.
Converting Decimals to Percentages
To convert a decimal to a percentage, just do the opposite of what you did in the preceding section. All you have to do is move the decimal point two places to the right. Thus, 0.5 = 50 percent; 0.375 = 37.5 percent; 2 = 200 percent.
The following drill will give you practice working with fractions, decimals, and percentages.
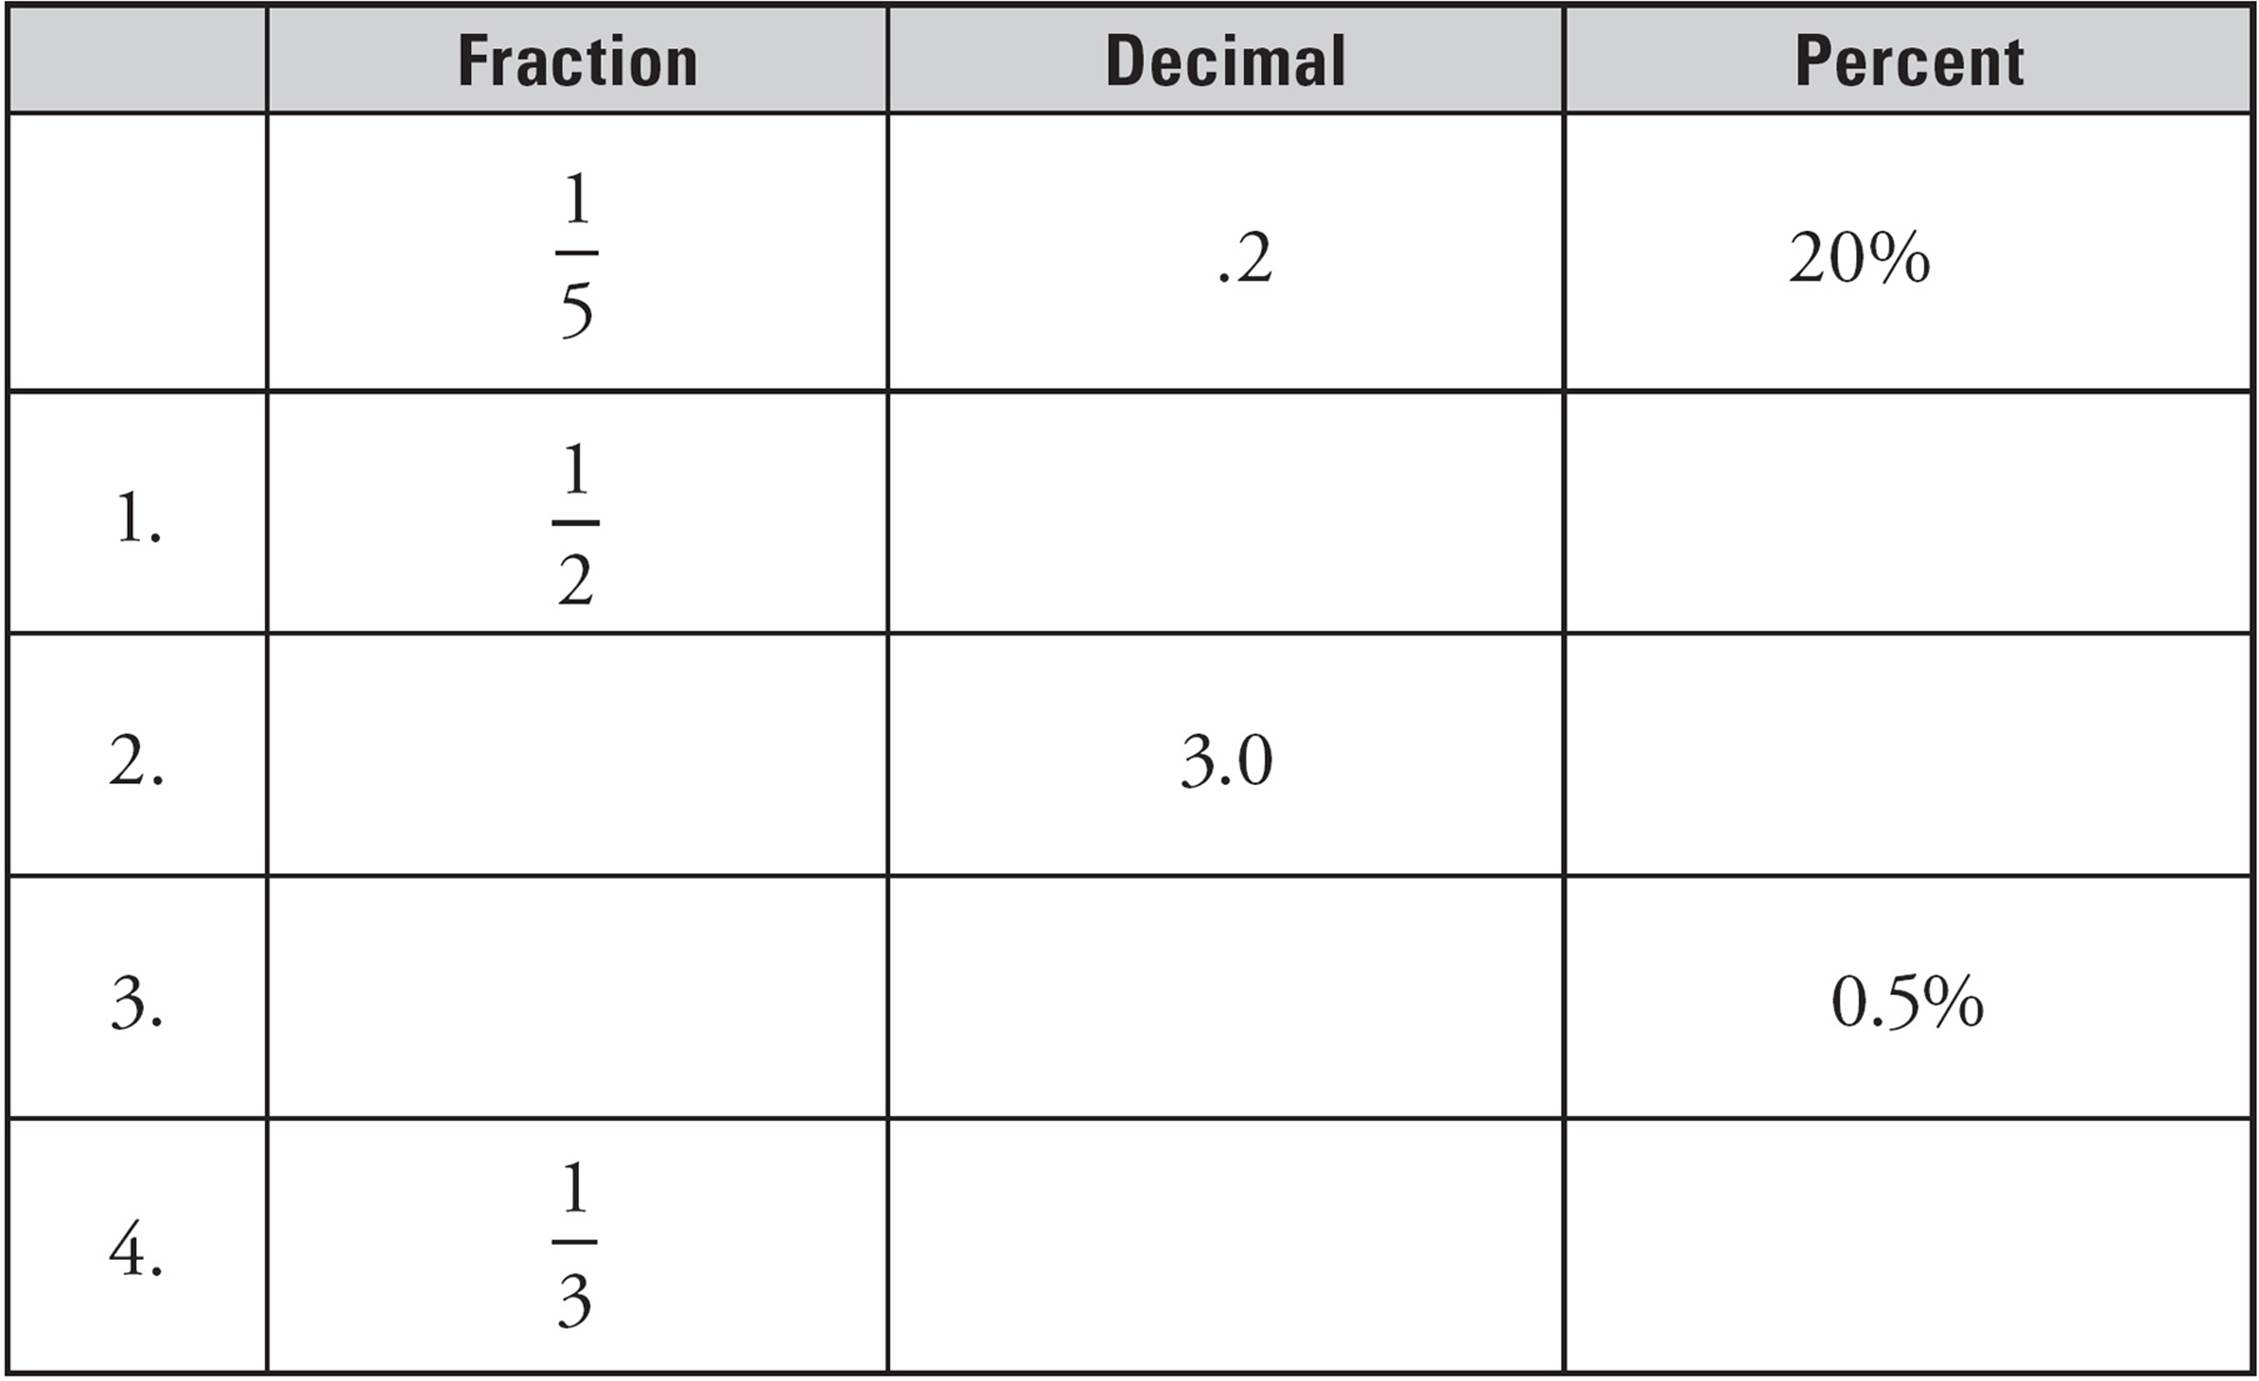
FRACTIONS, DECIMALS, AND PERCENTS DRILL
Fill in the missing information in the following table. Answers can be found on this page.
Translation, Please!
On the SAT Math Test, we can convert (or translate) words into arithmetic symbols. Here are some of the most common:
|
Word |
Symbol |
|
is, are, costs |
= |
|
greater than, more than |
+ |
|
fewer than, less than |
− |
|
of |
× (multiply) |
|
percent |
÷ 100 |
|
what |
n (variable) |
Do You Speak Math?
Problem: What number is 5 more than 10 percent of 20?
Students often make careless errors on questions like this because they aren’t sure how to turn the words they are reading into math. You won’t make mistakes if you take the words slowly and translate each one into a mathematical symbol. Let’s use the chart on the previous page to write this question in math. What number means “variable” so we can write that as n (or x or whatever letter works for you!). Is means “equals,” so now we have n = 5. More than translates to +, and 10 percent is  . That gives us n = 5 +
 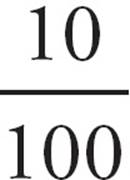 . Finally, of 20 means multiply by 20, so we’ve got our equation:
n = 5 + (20)
n = 5 + 2
n = 7
You will see the words of, is, product, sum, and what pop up a lot in the Math sections of the SAT. Don’t let these words fool you because they all translate into simple math functions. Memorize all of these terms and their math equivalents. It will save you time on the test and make your life with the SAT much nicer.
What Percent of What Percent of What?
On harder SAT questions, you may be asked to determine the effect of a series of percentage increases or decreases. The key point to remember on such problems is that each successive increase or decrease is performed on the result of the previous one.
Here’s an example:
![]()
15.A business paid $300 to rent a piece of office equipment for one year. The rent was then increased by 10% each year thereafter. How much will the company pay for the first three years it rents the equipment?
A)$920
B)$960
C)$990
D)$993
Bite-Size Pieces
Always handle
percentage problems in
bite-size pieces:
one piece at a time.
Here’s How to Crack It
This problem is a great place to use bite-sized pieces. You know that the business paid $300 to rent the piece of office equipment for the first year. Then, you were told that the rent increases by 10 percent for each year thereafter. That’s a sure sign that you’re going to need the rent for the second year, so go ahead and calculate it. For the second year, the rent is 300 + 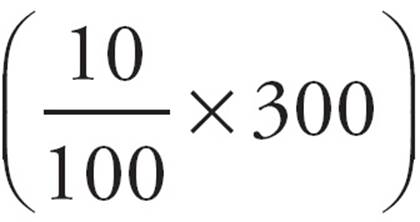 = 330.
Now, the problem tells you that the business rents the equipment for three years. So, you need to do the calculation one more time. At this point, you might want to set up a chart to help keep track of the information.
Year 1: $300
Year 2: $300 = 300 + 
Year 3: $363 = 330 +
To find the answer, all you need to do is add up the costs for each of the three years.
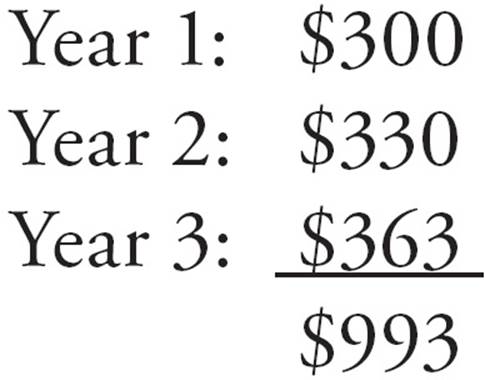
The correct answer is (D), $993.
![]()
What Percent of What Percent of…Yikes!
Sometimes you may find successive percentage problems in which you aren’t given actual numbers to work with. In such cases, you need to plug in some numbers.
Careful!
Number 17 is a tricky
question. Beware of
percentage change
problems in the later
questions. The answers
to these problems almost
always defy common
sense. Unless you are
careful, you may fall for
a trap answer.
Here’s an example:
![]()
17.A number is increased by 25 percent and then decreased by 20 percent. The result is what percent of the original number?
A)80
B)100
C)105
D)120
Here’s How to Crack It
You aren’t given a particular number to work with in this problem—just “a number.” Rather than trying to deal with the problem in the abstract, you should immediately plug in a number to work with. What number would be easiest to work with in a percentage problem? Why, 100, of course.
1.25 percent of 100 is 25, so 100 increased by 25 percent is 125.
2.Now you have to decrease 125 by 20 percent; 20 percent of 125 is 25, so 125 decreased by 20 percent is 100.
3.100 (our result) is 100 percent of 100 (the number you plugged in), so ETS’s answer, once again, is (B).
Remember: Never try to solve a percentage problem by writing an equation if you can plug in numbers instead. Plugging in on percentage problems is faster, easier, and more accurate. Why work through long, arduous equations if you don’t have to?
![]()
Percent Change
There’s one more fundamental concept that you should know about percents. Some problems will ask for a percent increase or decrease. For these problems, use the following formula.
% change =  ×100
×100
Most of the time that you use the formula, it will be pretty clear which number you should use for the original. However, if you’re not sure, remember that you should use the smaller number for the original if you are finding a percent increase. You should use the larger number for the original if you are finding a percent decrease.
Here’s an example of how to use the formula:
![]()
8.
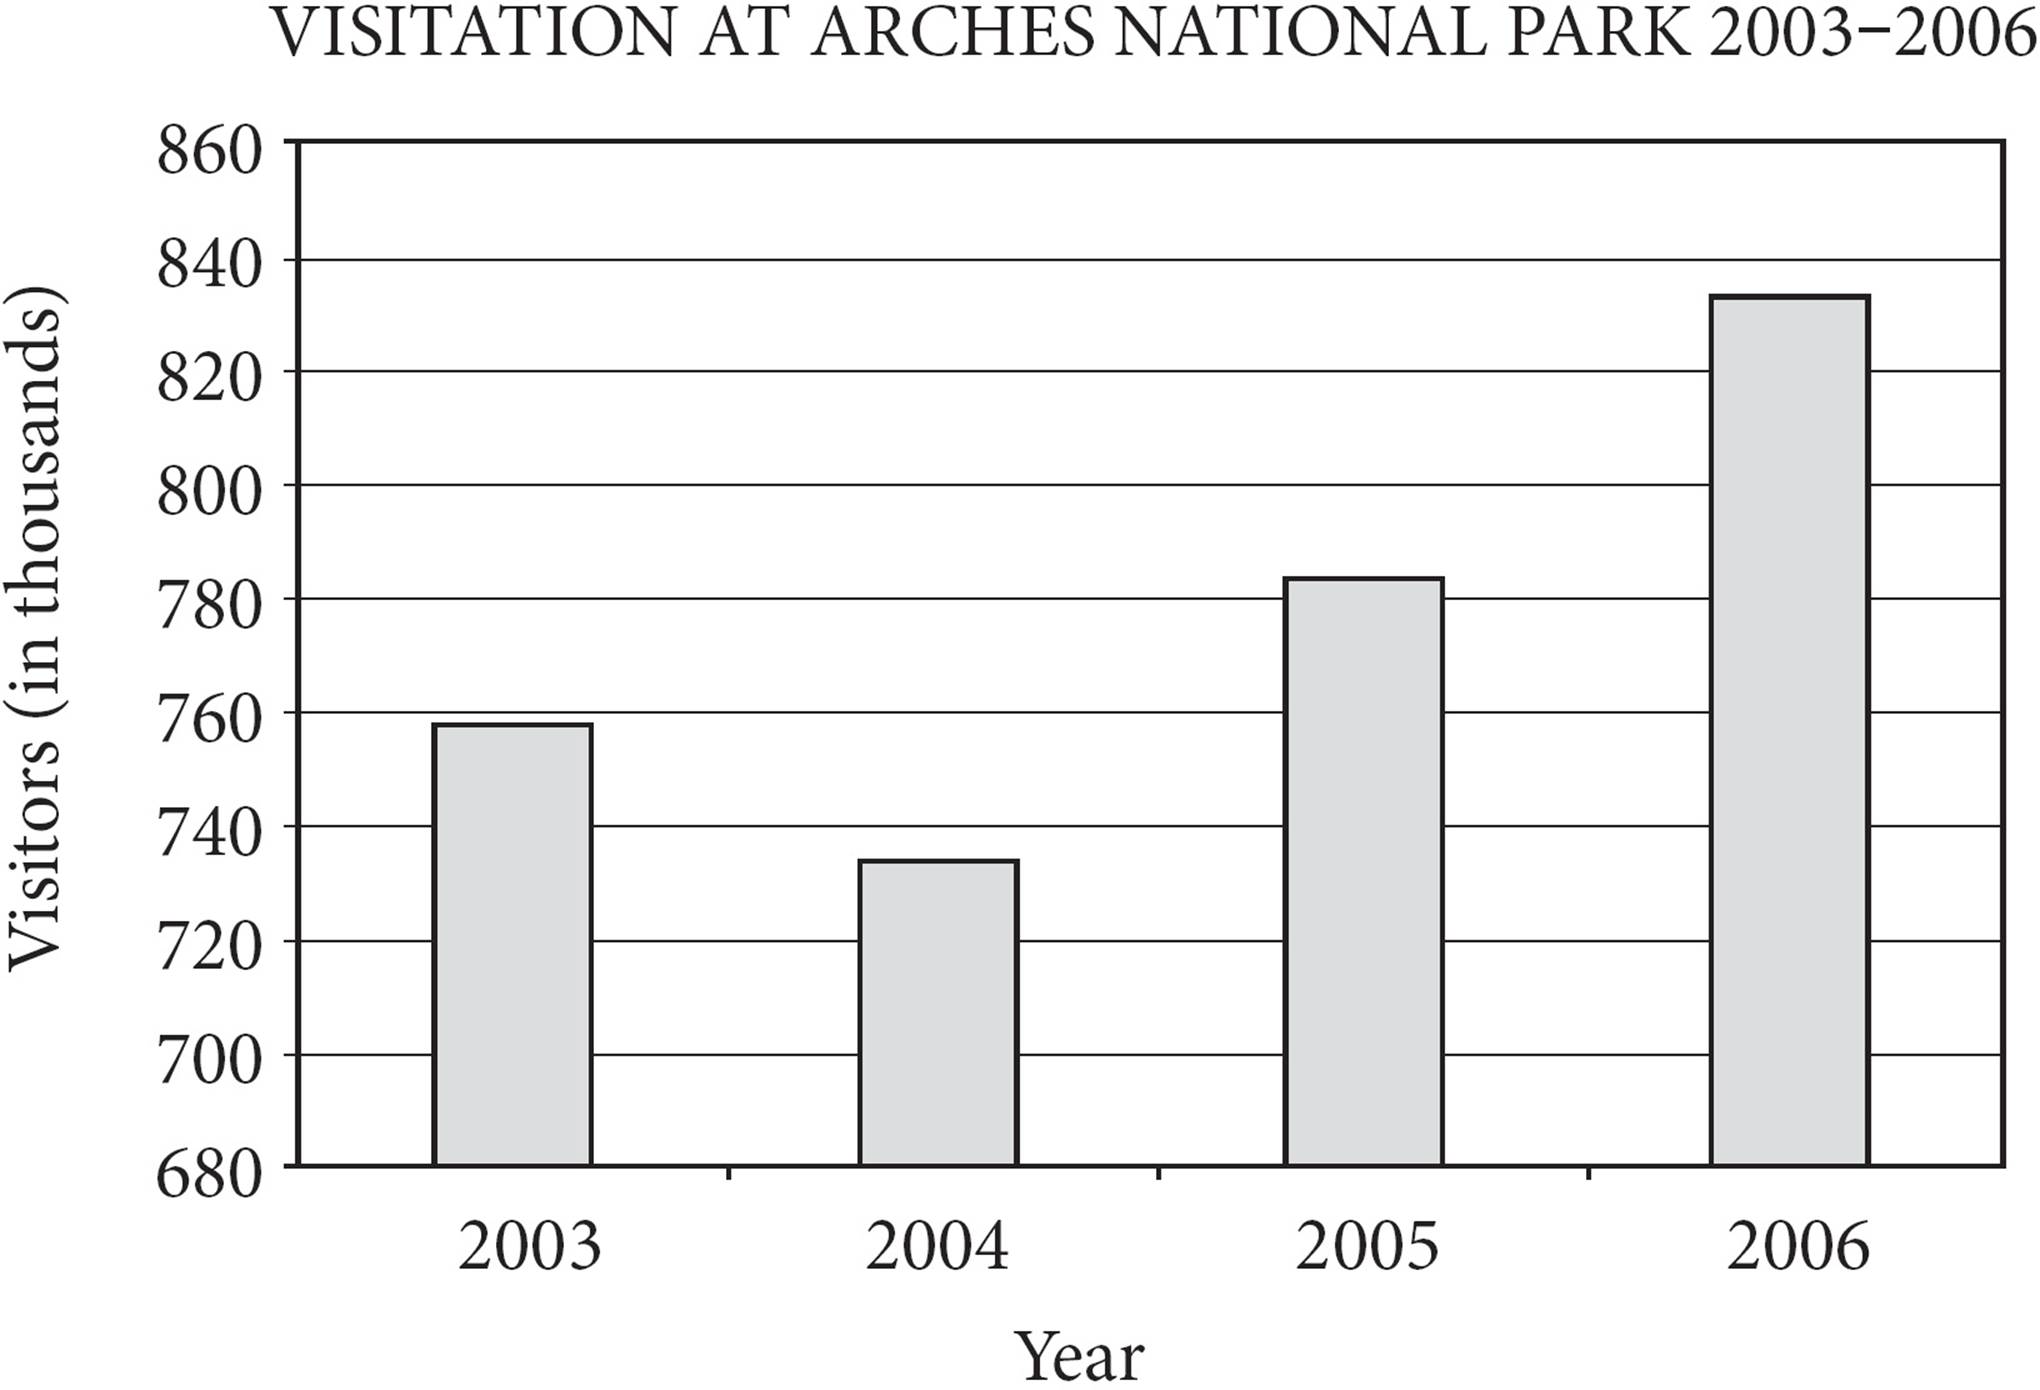
The chart shown above shows the number of visits, in thousands, at Arches National Park for the years 2003 to 2006. Which of the following is the closest approximation of the percent increase in the number of visits from 2004 to 2006?
A)5%
B)15%
C)20%
D)115%
Here’s How to Crack It
First, you need to get the data from the chart. In 2004, the chart shows that there were approximately 730,000 visitors to Arches. In 2006, the chart shows that there were about 830,000 visitors to the park. Now, it’s time to use the percent change formula. The difference is about 100,000 and the original is the 730,000 visitors in 2004:
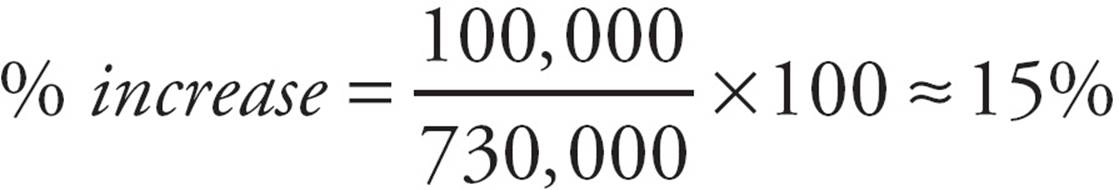
The correct answer is (B).
![]()
Percentages: Advanced Principles
Another aspect of percent questions may relate to things that increase or decrease by a certain percent over time. This is known as “growth and decay.” Real world examples include population growth, radioactive decay, and credit payments, to name a few. While Plugging In can help on these, it is also useful to know the growth and decay formula.
When the growth or decay rate is a percent of the total population:
final amount = original amount (1 ± rate)number of changes
Let’s see how this formula can make quick work of an otherwise tedious question.
![]()
23.Becca deposits $100 into a bank account that earns an annual interest rate of 4%. If she does not make any additional deposits and makes no withdrawals, how long will it take her, in years, to increase the value of her account by at least 60% ?
A)12
B)15
C)25
D)30
Here’s How to Crack It
You could add 4% to the account over and over again until you get to the desired amount, but that would take a long time. Knowing the formula will make it a lot easier. First, set up the equation with the things you know. 100 is the original amount, and the rate is 4%, or 0.04. The account is increasing, so you add the rate, and you can put in “years” for the number of changes. The formula becomes
final amount = 100(1 + 0.04)years
Now you need to figure out what you want the final amount to be. Translate the English to math: the value of her account (100) will increase (+) by 60 percent (0.6) of the current value (×100). This becomes 100 + (0.6)(100) = 100 + 60 = 160. Now the formula is
160 = 100(1.04)years
The answer choices represent the number of years Becca keeps her money in the account. Now you are all set to easily plug in the answers. Start with (B), so years = 15. Is 100(1.04)15 = 160? Use your calculator to check, making sure to follow PEMDAS rules and do the exponent before you multiply by 100. The result is $180.09. That is a bit too much money, so the answer will likely be (A), but let’s just check it. 100(1.04)12 = $160.10, which is at least $160.
A final note on growth and decay: Sometimes the population is tripling or halving instead of changing by a certain percent. In that case, the formula changes to
final amount = original amount (multiplier)number of changes
![]()
Two more topics related to percentages may be tested. You may be given a sample of a population that fits a certain requirement and asked to determine how many members of the general population will also be expected to fit that requirement. You may also be given the results of a study or poll and told that there is a margin of error of a certain percentage.
Let’s look at an example that tests both of these advanced ideas.
![]()
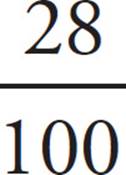
29.A summer beach volleyball league has 750 players in it. At the start of the season, 150 of the players are randomly chosen and polled on whether games will be played while it is raining, or if the games should be cancelled. The results of the poll show that 42 of the polled players would prefer to play in the rain. The margin of error on the poll is ±4%. What is the range of players in the entire league that would be expected to prefer to play volleyball in the rain rather than cancel the game?
A)24–32
B)39–48
C)150–195
D)180–240
Here’s How to Crack It
The first step is to determine the percent of polled players that wanted to play in the rain.
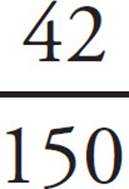 = 0.28 or 28%
Now apply this percent to the entire population of the league. Since 28% of the polled players wanted to play in the rain, 28% of all players should want to play in the rain.
 × 750 = 210
The only range that contains this value is (D), so that is the correct answer. To actually calculate the margin of error, add and subtract 4% to the actual percent of 28% to get a range of 24–32% of the total.
24% of 750 = 180
32% of 750 = 240
Therefore, the entire range is 180 to 240.
![]()
AVERAGES
What Is an Average?
The average (also called the arithmetic mean) of a set of n numbers is simply the sum of all the numbers divided by n. In other words, if you want to find the average of three numbers, add them up and divide by 3. For example, the average of 3, 7, and 8 is 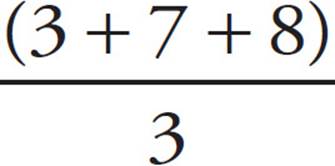 , which equals
  , or 6.
That was an easy example, but ETS does not always write average questions with clear solutions. That is, ETS doesn’t always give you the information for averages in a way that is easy to work with. For that reason, we have a visual aid, like the Ratio Box for ratios, that helps you organize the information on average questions and find ETS’s answer.
We call it the Average Pie. Here’s what it looks like:
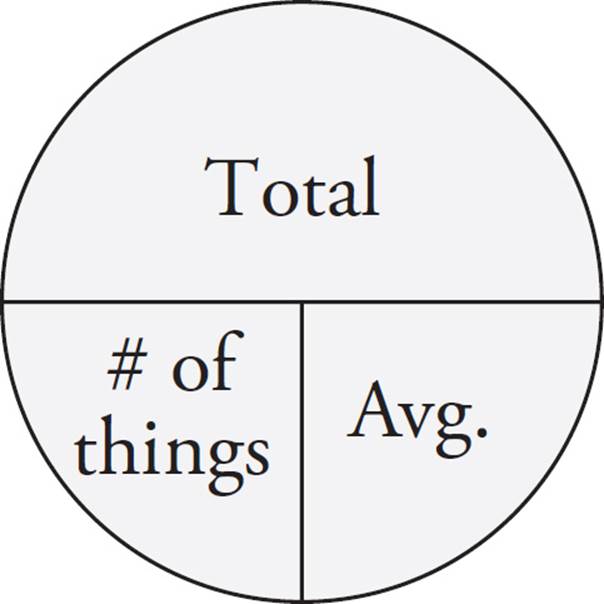
The total is the sum of all the numbers you’re averaging, and the number of things is the number of elements you’re averaging. Here’s what the Average Pie looks like using the simple average example we just gave you.
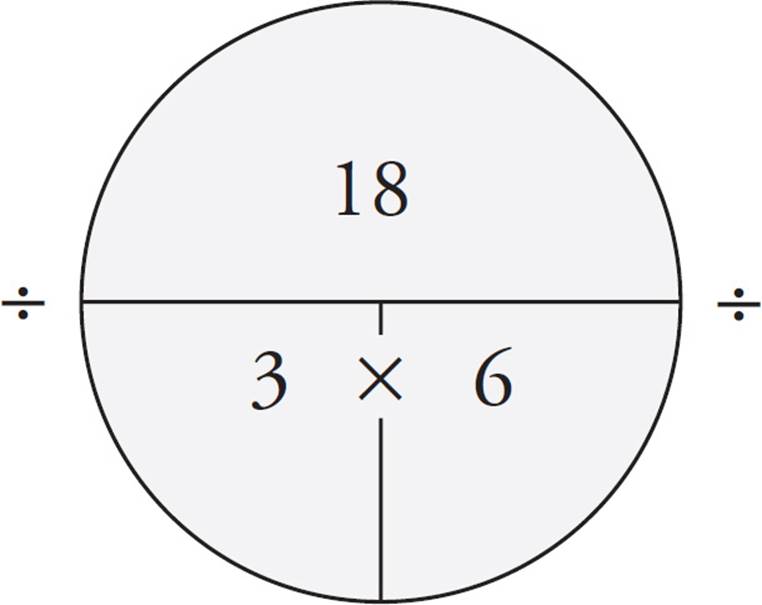
Here’s how the Average Pie works mathematically. The horizontal line in the middle means divide. If you know the total and the number of things, just divide to get the average (18 ÷ 3 = 6). If you know the total and the average, just divide to get the number of things (18 ÷ 6 = 3). If you know the average and the number of things, simply multiply to get the total (6 × 3 = 18). The key to most average questions is finding the total.
Here’s another simple example:
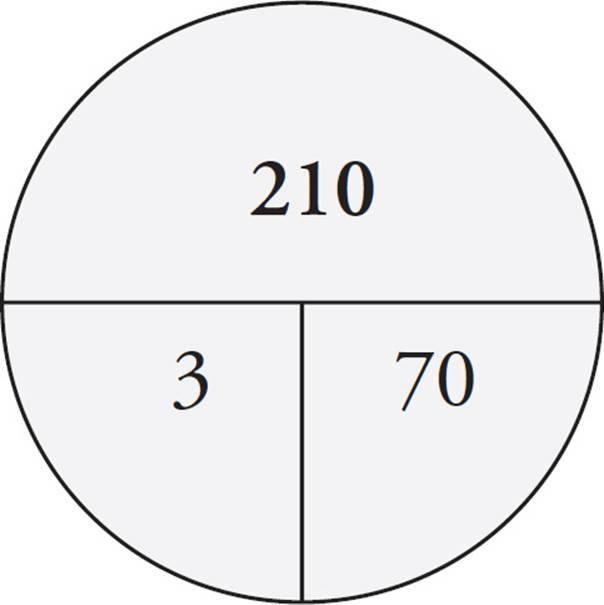
Problem: If the average of three test scores is 70, what is the total of all three test scores?
Solution: Just put the number of things (3 tests) and the average (70) in the pie. Then multiply to find the total, which is 210.
Total
When calculating
averages and means,
always find the total.
It’s the one piece of
information that
ETS loves to withhold.
Averages: Advanced Principles
To solve most difficult average problems, all you have to do is fill out one or more Average Pies. Most of the time you will use them to find the total of the number being averaged. Here’s an example:
![]()
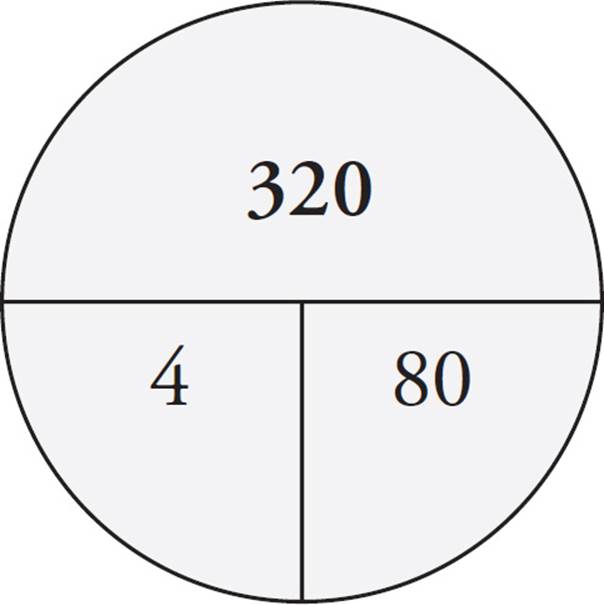
10.Maria has taken four chemistry tests and has an average (arithmetic mean) score of 80. If she scores a 90 on her fifth chemistry test, what is her average for these five tests?
A)80
B)81
C)82
D)84
Mark It!
Make sure you’re drawing
a new average pie each
time you see the word
average in a question.
Here’s How to Crack It
Start by drawing an average pie and filling in what you know. You can put 4 in for the number of things and 80 for the average. You can calculate that Maria has gotten 320 total points on her first four tests. Your pie should look like this:
Now, draw another average pie and fill in what you know. This time, there are five tests. The question wants to know the average, so you also need to fill the total. The total for all five tests is the total from the first four tests plus the score from the fifth test: 320 + 90 = 410. Put that on the pie and divide to find the average:
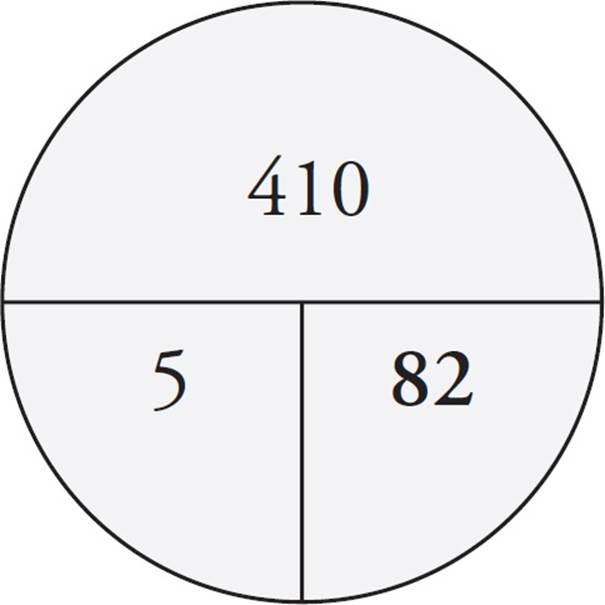
The answer is (C), 82.
![]()
Averages, and many other arithmetic topics, may be tested using charts and data. To find the numbers to average, look them up on the graphic provided and watch out for mismatched units.
![]()
24.
|
Charge No. |
Battery Life |
|
|
1 |
1:11 |
|
|
2 |
1:05 |
|
|
3 |
0:59 |
|
|
4 |
0:55 |
|
|
5 |
0:55 |
|
|
6 |
0:54 |
|
|
7 |
0:54 |
A toy drone is opened and charged to full battery life. The table above shows the duration of the battery life in hours and minutes between charges. What is the average battery life for the first five charges?
A)55 minutes
B)58 minutes
C)1 hour and 1 minute
D)1 hour and 5 minutes
Here’s How to Crack It
To find the average, add up the battery life values for the first 5 charges and divide by 5. Make sure that you convert the battery charge time for Charge 1 and 2 into minutes before calculating: 1:11 = 60 + 11 = 71 minutes, and 1:05 = 60 + 5 = 65 minutes. The average is equal to 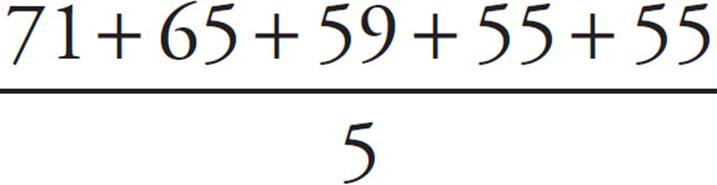 =
= 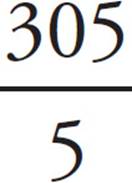 = 61 minutes, which is equal to 1 hour and 1 minute. Therefore, (C) is the correct answer.
![]()
Don’t forget that you can also plug in when using the Average Pie.
![]()
16.The average (arithmetic mean) of a list of 5 numbers is n. When an additional number is added to the list, the average of all 6 numbers is n + 3. Which of the following is the value, in terms of n, of the number added to the list?
A)6n + 18
B)5n
C)n + 18
D)n + 6
Here’s How to Crack It
Plug in for the value of n. If n = 20, then you can use the Average Pie to find the total of the five numbers on the list.
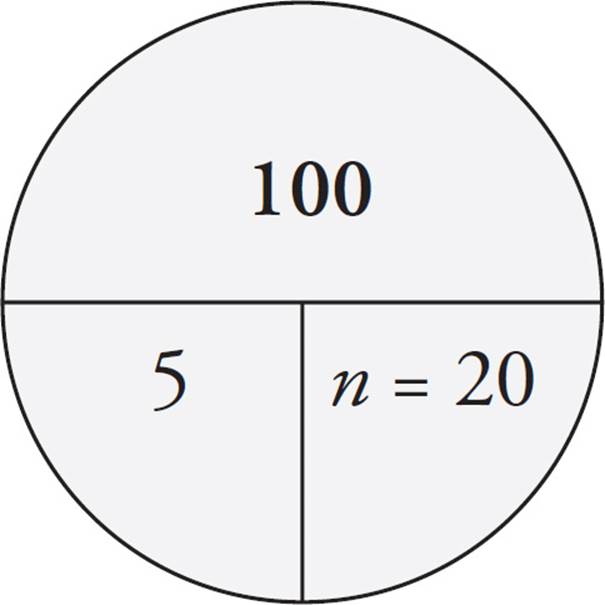
As shown on the Average Pie above, the total of the 5 numbers is 100. Now, it’s time for another Average Pie. For this pie, you know that there are 6 numbers and that their average is 20 + 3 = 23.
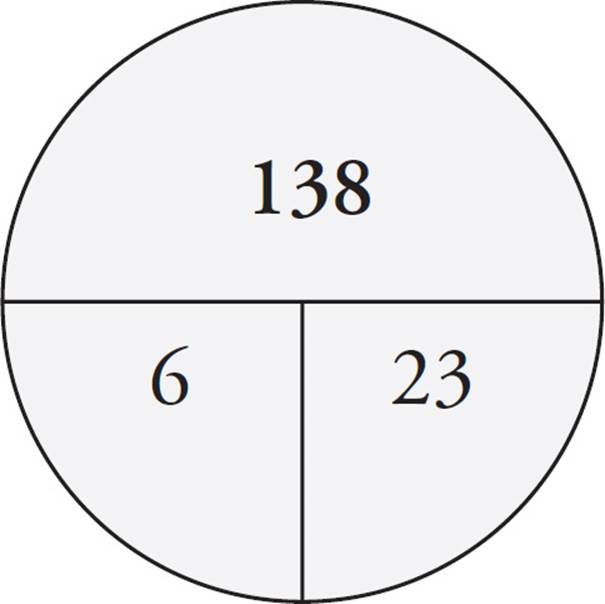
Using the Average Pie as shown above, the total of the six numbers is 138. Since the difference in the two totals was caused by the addition of the sixth number, the sixth number must be 138 − 100 = 38. That’s the target, so be sure to circle it. Only answer (C) is 38 when n = 20.
![]()
On the SAT, you’ll also need to know three other statistical topics related to averages: median, mode, and range. These topics have pretty straightforward definitions. One way the SAT will complicate the issue is by presenting the data in a chart or graph, making it harder to see the numbers you are working with.
What Is a Median?
The median of a list of numbers is the number that is exactly in the middle of the list when the list is arranged from smallest to largest, as on a number line. For example, in the group 3, 6, 6, 6, 6, 7, 8, 9, 10, 10, 11, the median is 7. Five numbers come before 7 in the list, and 5 come after. Remember it this way: Median sounds like middle.

Missing the Middle?
To find the median of a
set containing an even
number of items, take the
average of the two middle
numbers.
Let’s see how this idea might be tested:
![]()
23.
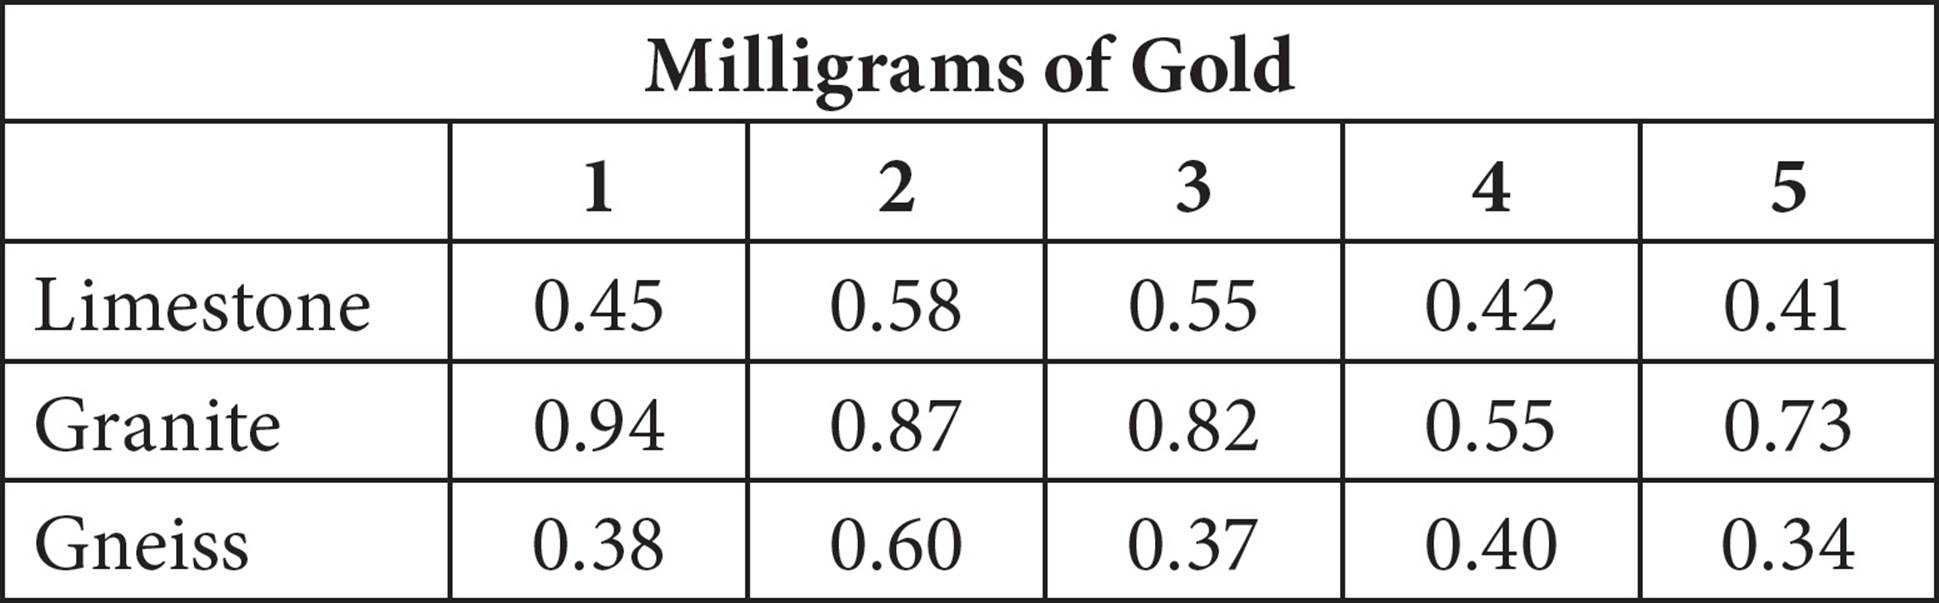
Five samples of each of three different rock types were collected on a hiking trip in Colorado. Each sample was analyzed for its gold content. The milligrams of gold found in each sample are presented in the table above. How much larger is the median of the amount of gold in the granite samples than that of the limestone samples?
A)0.00
B)0.37
C)0.45
D)0.55
Here’s How to Crack It
Start by putting the gold weights for limestone in order to get:
0.41, 0.42, 0.45, 0.55, 0.58
The median for limestone is the middle number: 0.45 mg.
Next, place the gold weights for granite in order to get:
0.55, 0.73, 0.82, 0.87, 0.94
The median for granite is 0.82.
Therefore, the difference between the median amount of gold in the granite and limestone samples is 0.82 − 0.45 = 0.37, and the correct answer is (B).
![]()
What Is a Mode?
The mode of a group of numbers is the number in the list that appears most often. In the list 3, 4, 4, 5, 7, 7, 8, 8, 8, 9, 10, the mode is 8, because it appears three times while no other number in the group appears more than twice. Remember it this way: Mode sounds like most.
Mode is often tested with bar graphs or points on a scatterplot. Look for the tallest bar on the bar graph or the row or column with the most points in a scatterplot to find the mode.
![]()
6.
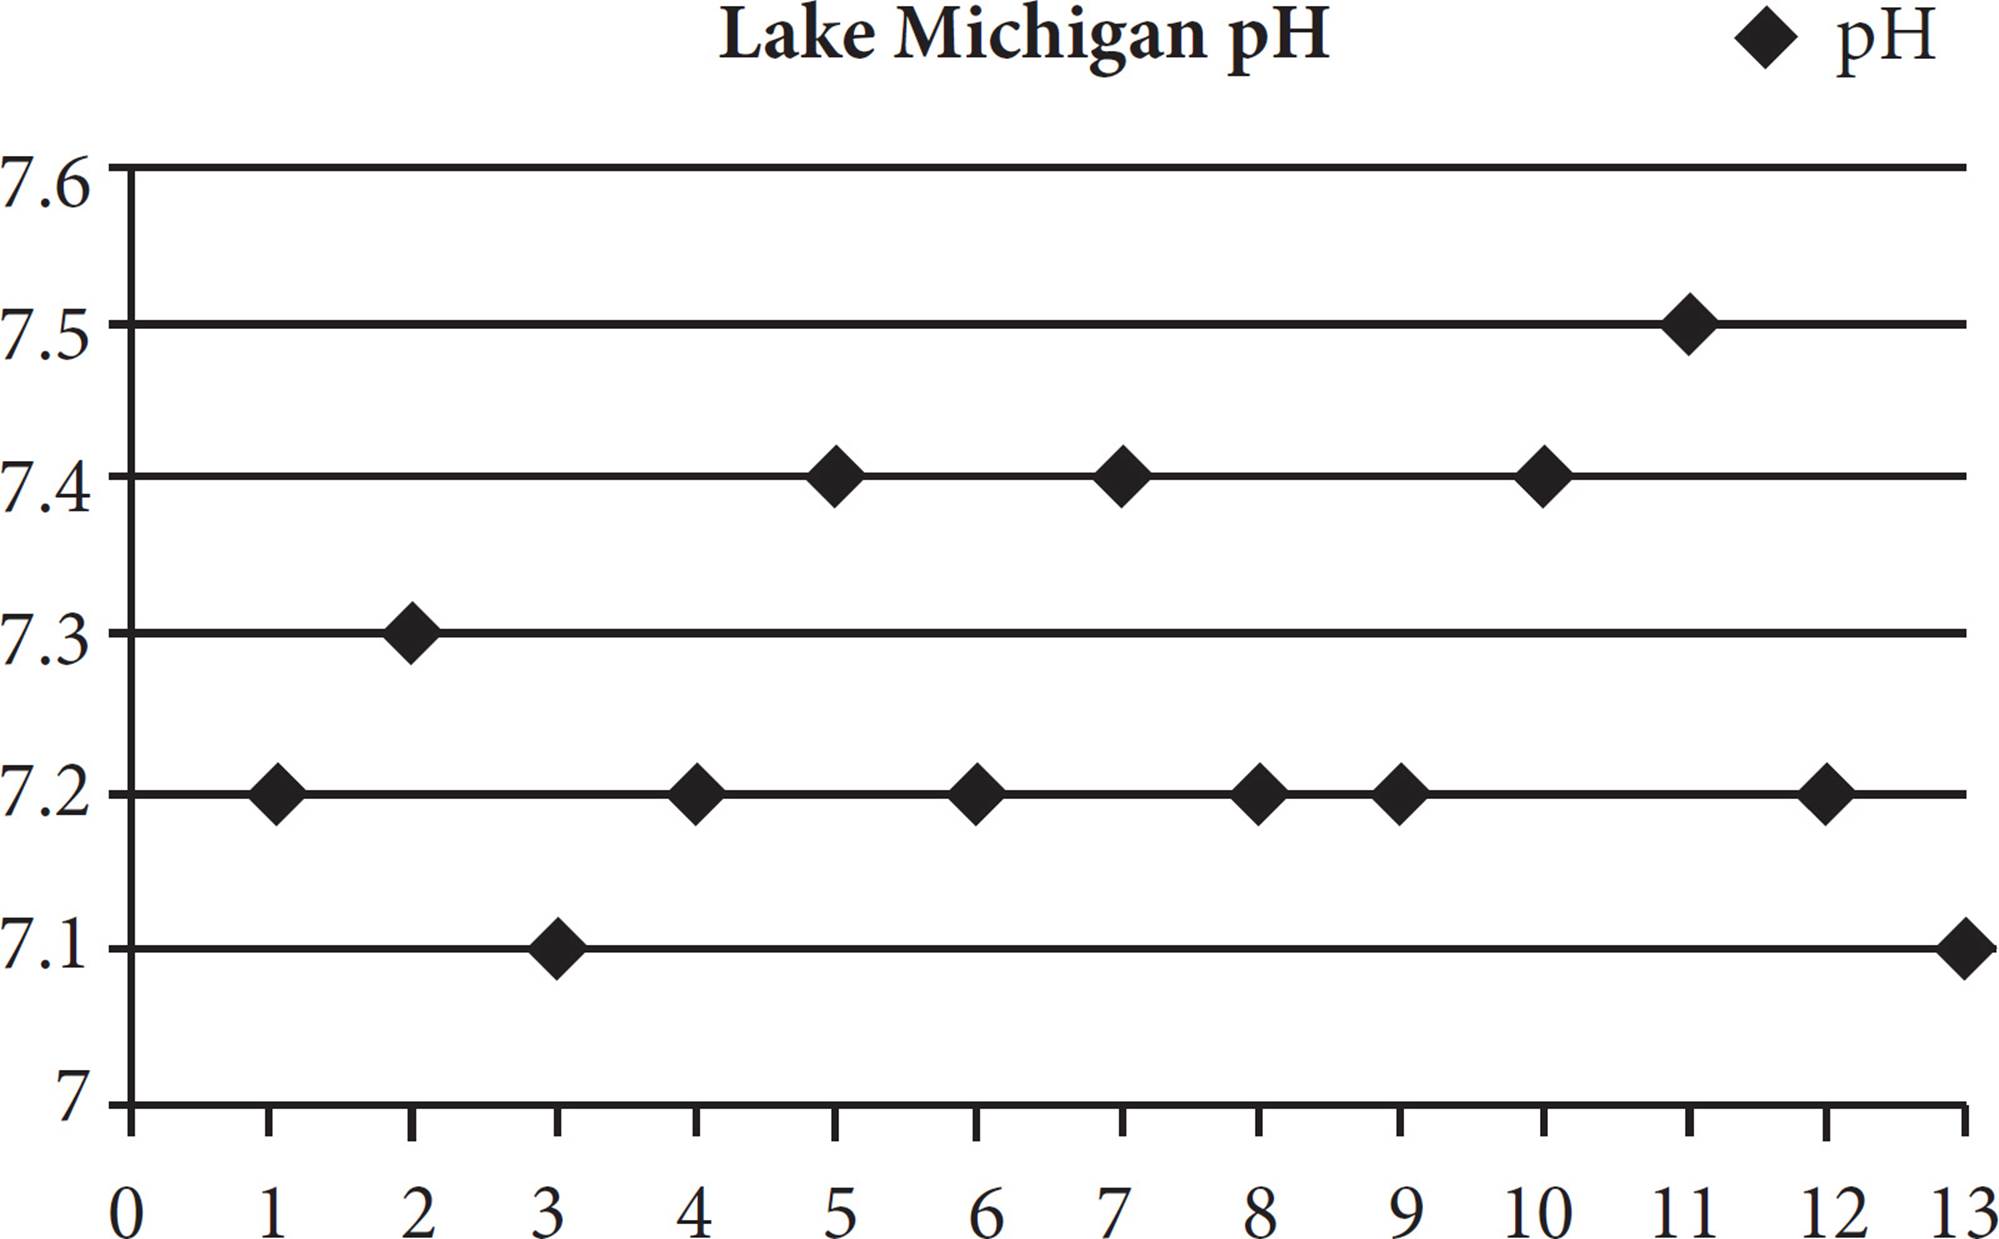
The pH of the water in Lake Michigan was tested at 13 locations along the Illinois shoreline. The data is presented in the scatterplot above. Which answer choice best represents the mode of the pH in the collected data?
A)7.2
B)7.3
C)7.4
D)7.5
Here’s How to Crack It
The mode is the data point that occurs most frequently. Each diamond is a data point, so look for the line with the most diamonds on it. That line is 7.2, which means that when the lake was tested, the pH level most often read 7.2. The correct answer is (A).
![]()
What Is a Range?
The range of a list of numbers is the difference between the greatest number on the list and the least number on the list. For the list 4, 5, 5, 6, 7, 8, 9, 10, 20, the greatest number is 20 and the least is 4, so the range is 20 − 4 = 16.
![]()
3.
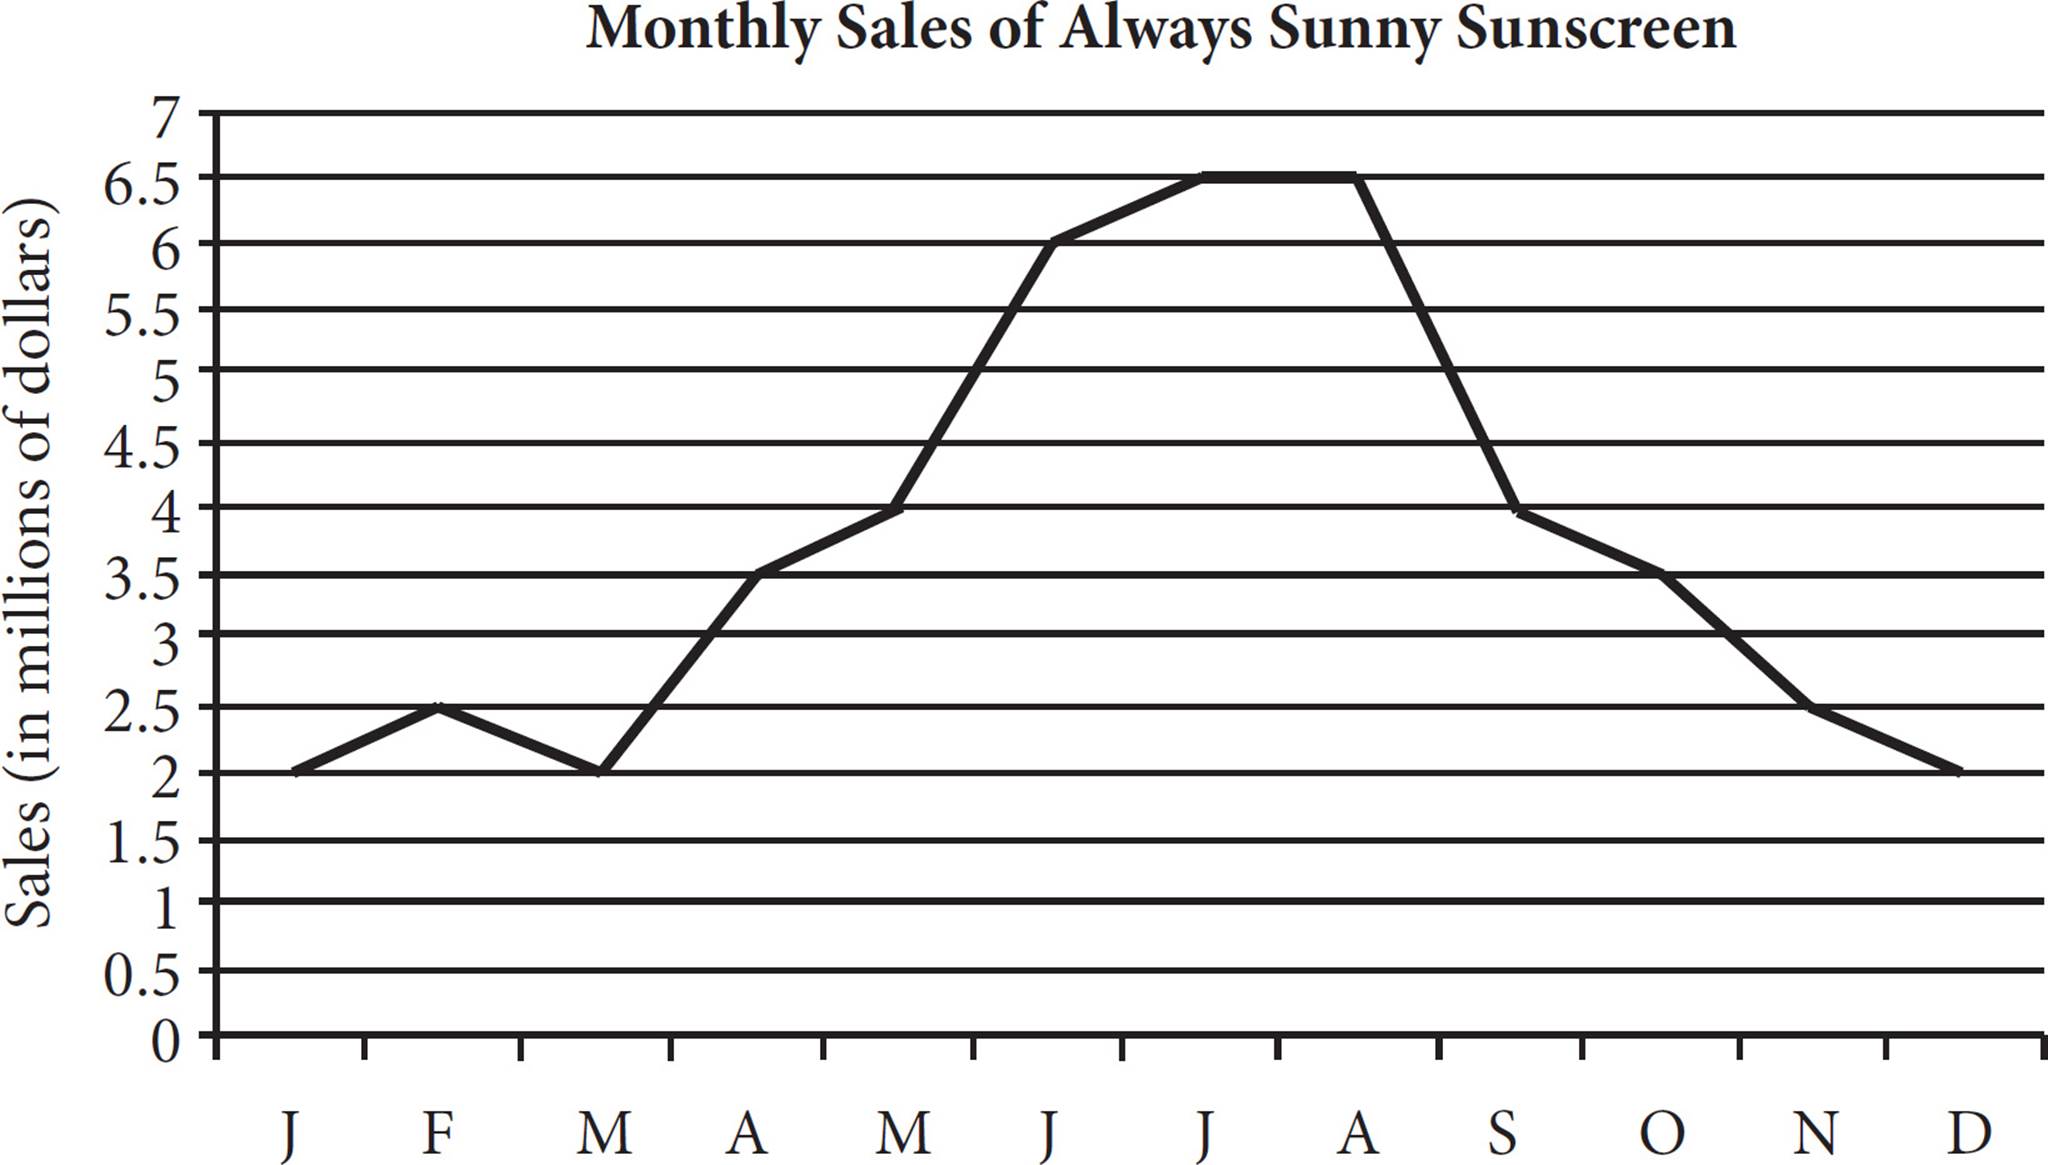
The forecasted monthly sales of Always Sunny Sunscreen are presented in the figure above. Which of the following best describes the range of monthly sales, in millions of dollars, throughout the year shown?
A)2.5
B)3.5
C)4.0
D)4.5
Here’s How to Crack It
The range of a set of values is the difference between the greatest and the smallest value. Looking at the chart, the lowest monthly sales number for Always Sunny can be found where the line dips closest to the bottom of the graph. This happens in both January and March, when the forecasted sales are 2 million. Make sure to read the units carefully. The highest point is where the line goes closest to the top of the graph. This happens in July and August, when the forecasted monthly sales are 6.5 million. Therefore, the range is 6.5 million − 2 million = 4.5 million. The correct answer is (D).
By the way, you may recognize this graph from Chapter 11. ETS sometimes uses the same chart or figure for two different questions. We’ll talk more about sets of questions later in this chapter.
![]()
The SAT might even have a question that tests more than one of these statistical concepts at the same time. Take it one step at a time and use Process of Elimination when you can.
![]()
23.
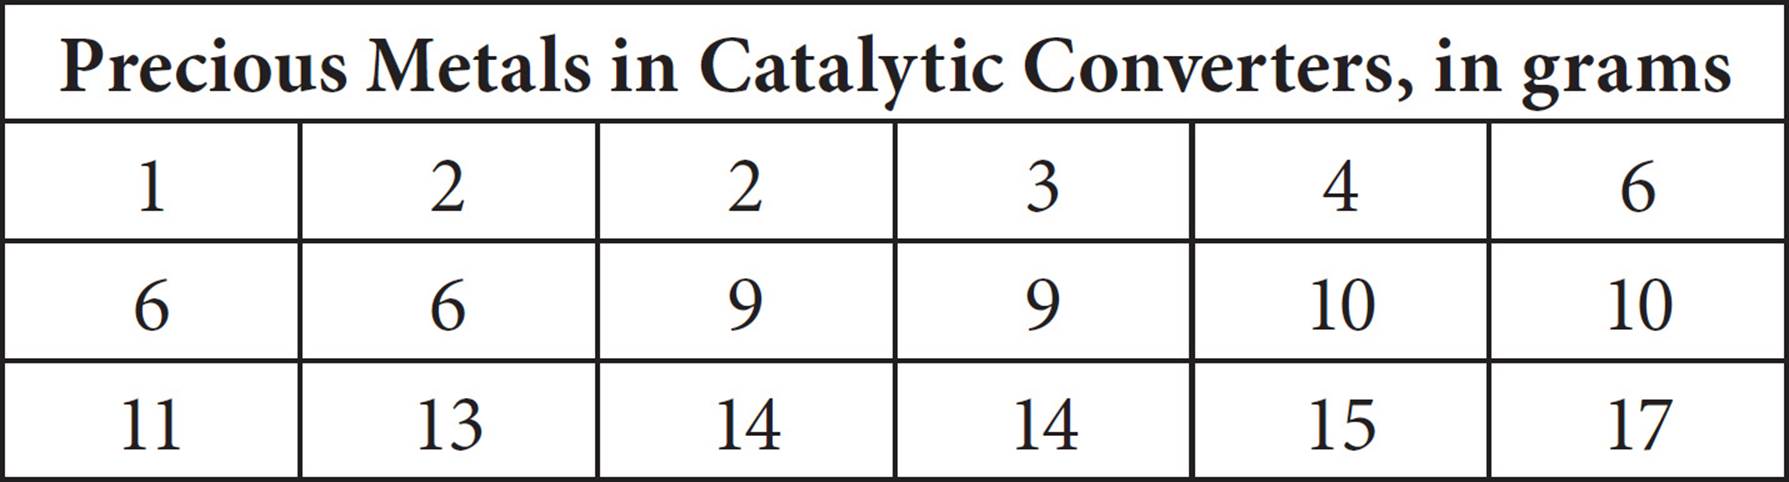
The grams of precious metals in recycled catalytic converters were measured for a variety of automobiles. The data is presented in the table above. If the lowest data point, 1 gram, and highest data point, 17 grams, are removed from the set, which of the following quantities would change the most?
A)Mode
B)Mean
C)Range
D)Median
Here’s How to Crack It
Start by evaluating the easier answer choices and save mean for last. The mode of the current list is 6, and removing 1 and 17 from the list won’t change that. Eliminate (A). The range is the difference between the smallest number and the largest number on the list. Right now, the range is 17 − 1 = 16. If those extremes are removed from the list, the new range is 15 − 2 = 13, and the range changed by 3 units. Keep (C) for now. The median is the middle number in the list, or the average of the middle two numbers. Currently, both middle numbers are 9, so the median is 9. This won’t change if 1 and 17 are removed, so eliminate (D). The mean of a list is not likely to change dramatically with the removal of the numbers at the extremes, so (C) is likely correct. To actually evaluate the mean, you need to add up all the numbers on the list and divide by the number of items in the list. For the current list, the total is 152 for the 18 items, so the average is ![]() . To find the new total if 1 and 17 are removed, don’t re-add everything; just subtract 18 from the previous total. The new list will have only 16 items, so the new average is 8.375. This is only slightly different than the previous mean, so eliminate (B) and choose (C).
. To find the new total if 1 and 17 are removed, don’t re-add everything; just subtract 18 from the previous total. The new list will have only 16 items, so the new average is 8.375. This is only slightly different than the previous mean, so eliminate (B) and choose (C).
![]()
RATES
Rate is a concept related to averages. Cars travel at an average speed. Work gets done at an average rate. Because the ideas are similar, you can also use a pie to organize your information on rate questions.
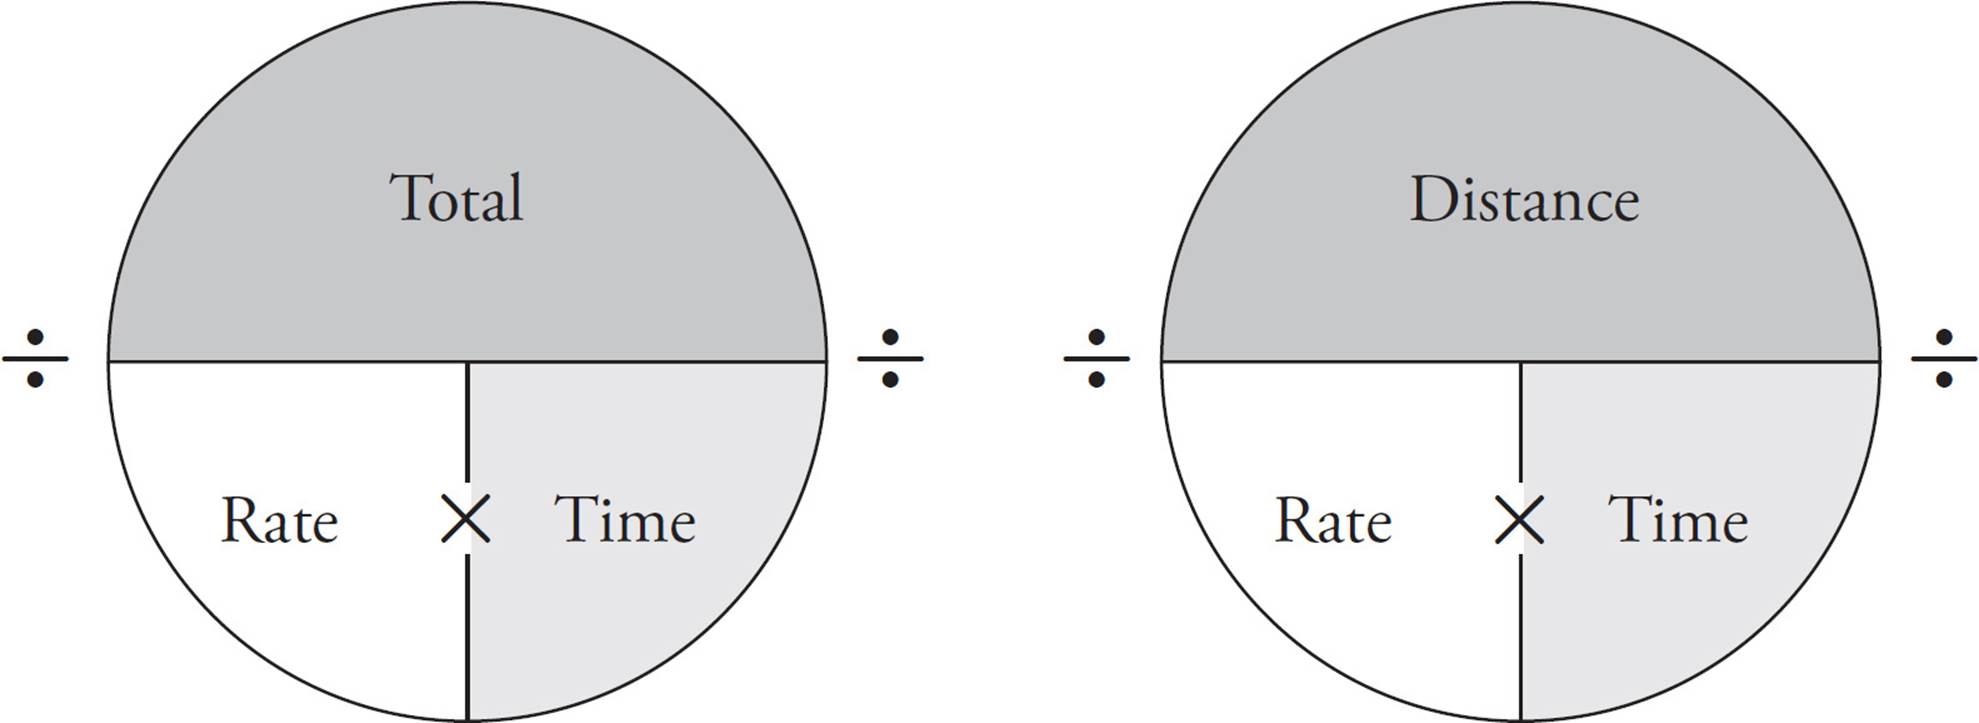
Here’s a simple example:
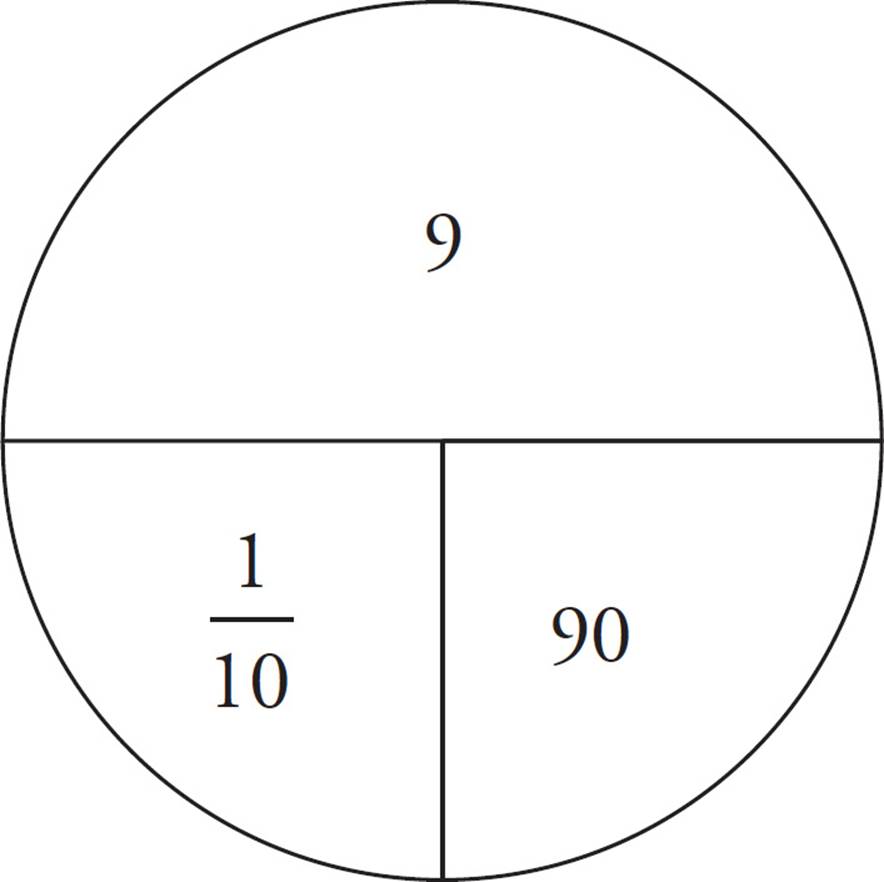
Problem: If a fisherman can tie 9 flies for fly fishing in an hour and a half, how long does it take him to tie one fly, in minutes?
Solution: First, convert the hour and a half to 90 minutes, so your units are consistent. Then fill in the top of the pie with the amount (9 flies) and the lower right part with the time (90 minutes). Divide 9 by 90 to get the rate,  , or one fly every 10 minutes.
Rates: Advanced Principles
Just as with complicated average questions, harder rate questions will also require more than one pie to solve. Here’s an example:
![]()
25.Brian plans to complete a 100-mile bike race for charity. According to his registration materials, he will need to ride at an average speed of 12.5 miles per hour if he wants to complete the course before it closes. On a practice ride the week before the race, Brian rides 60 miles and tracks his speed. For the first 30 miles, his average speed is 16 miles per hour, and for the next 30 miles, his average speed is 15 miles per hour. If Brian can match these speeds for the first 60 miles of the charity race, then he rests for a total of 1 hour after that, what approximate speed must he maintain for the last 40 miles in order to complete the ride on time?
A)8 miles per hour
B)10 miles per hour
C)13 miles per hour
D)14 miles per hour
Here’s How to Crack It
Start with the rate pie and fill in the numbers for the entire ride. You can put in 100 in for the total miles and 12.5 in for the rate. Dividing 100 by 12.5 tells you that Brian has 8 hours to complete the ride. Your pie will look like this:
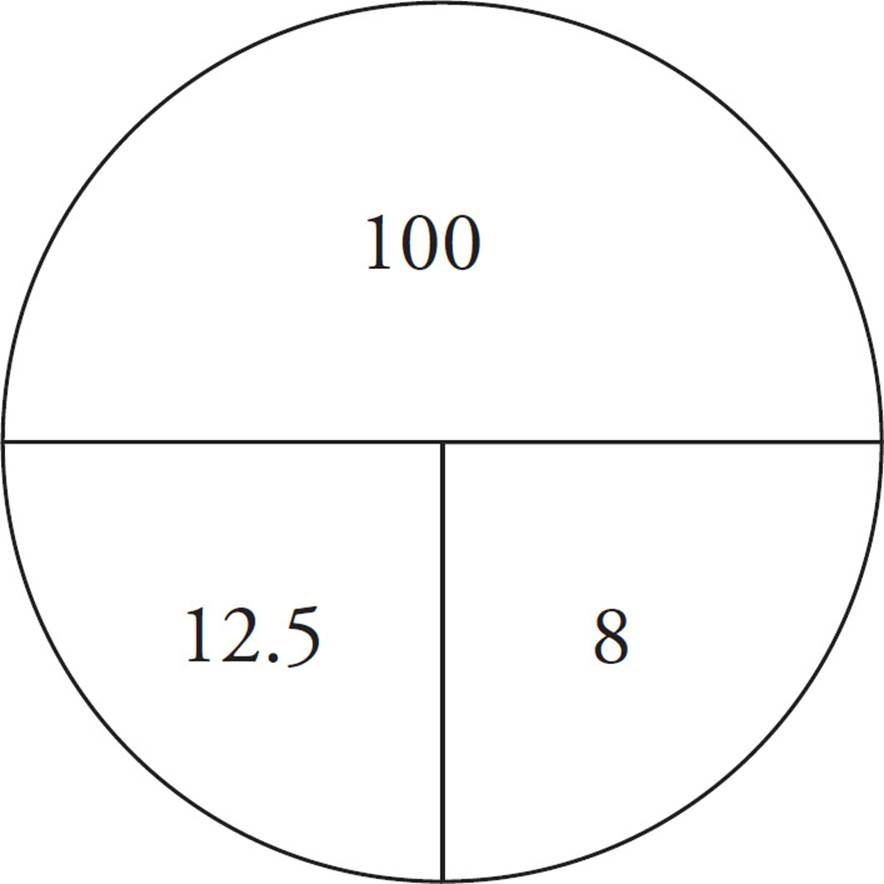
Now draw two more pies to determine how much time he would use for the first 60 miles. He rides at 16 miles an hour for the first 30 miles and 15 miles per hour for miles 31–60. Again, divide the number of miles by the rate to get the time for each portion, which is 1.875 hours for the first part and 2 hours for the second part.
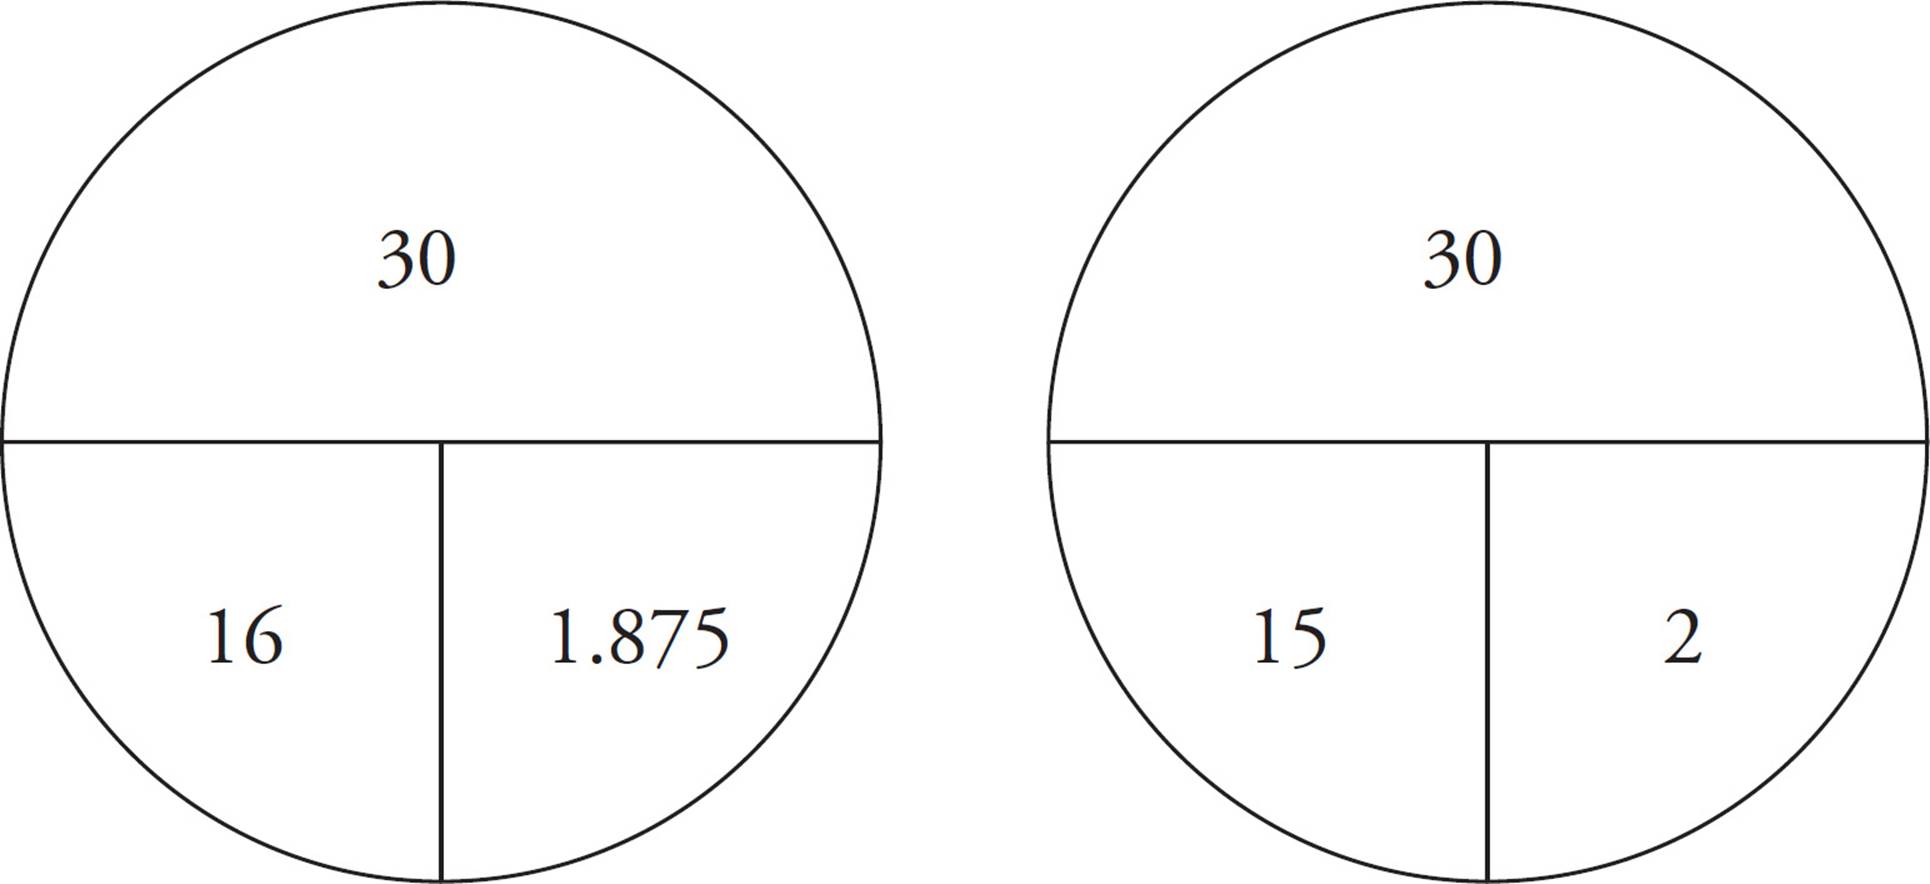
Therefore, the first 60 miles took Brian 1.875 + 2 = 3.875 hours to complete. After resting for an hour, he’s used up 4.875 of his 8 hours, so he has 3.125 hours left. He needs to go 40 miles in that time, so draw one more pie with 40 at the top and 3.125 in the lower right for time. Divide 40 by 3.125 to get 12.8 or 13 miles per hour (it is okay to round, since you are looking for the approximate speed).
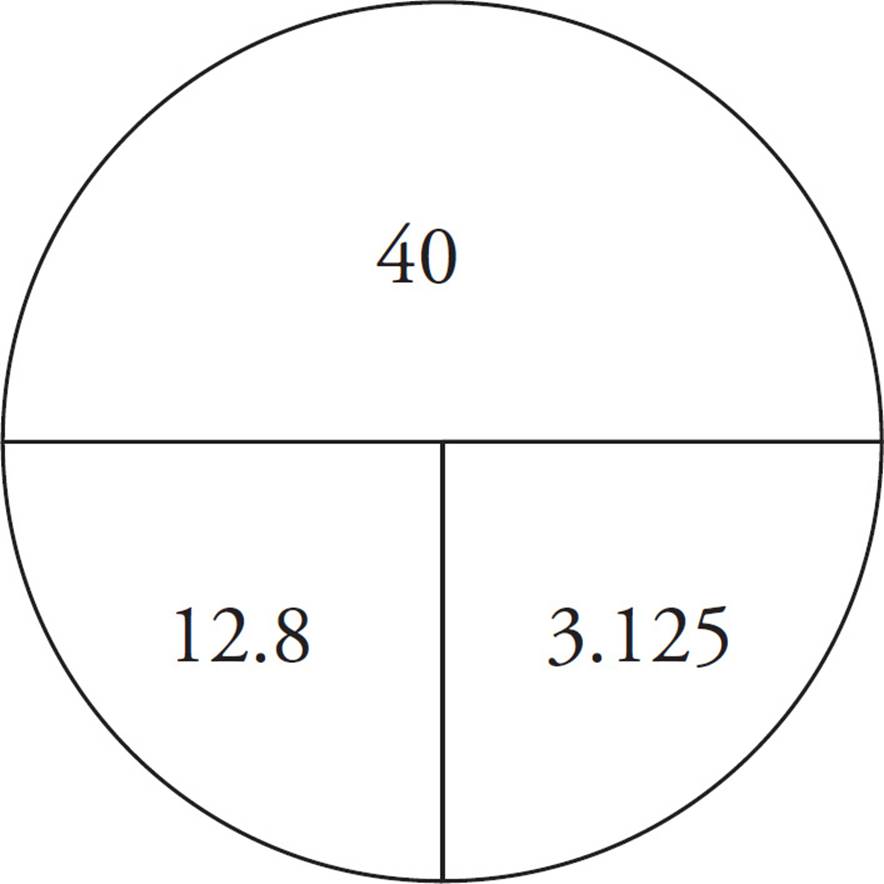
The correct answer is (C).
![]()
PROBABILITY
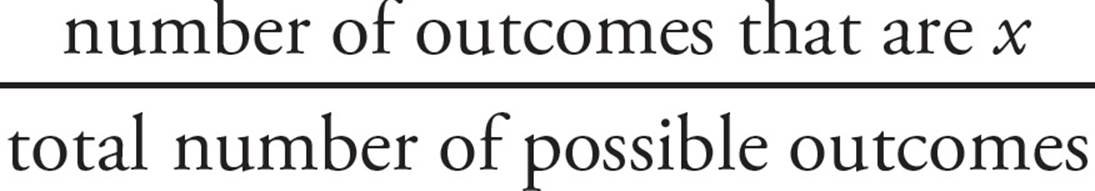
Probability is a mathematical expression of the likelihood of an event. The basis of probability is simple. The likelihood of any event is discussed in terms of all of the possible outcomes. To express the probability of a given event, x, you would count the number of possible outcomes, count the number of outcomes that give you what you want, and arrange them in a fraction, like this:
Probability of x = 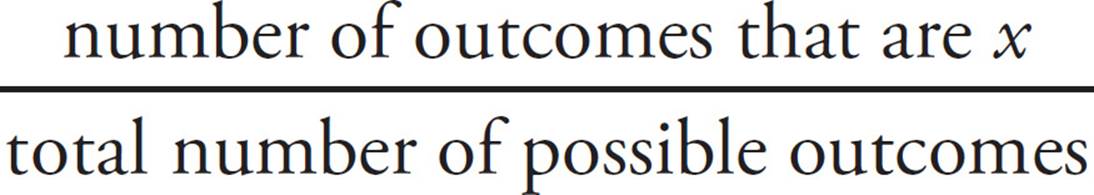
Every probability is a fraction. The largest a probability can be is 1; a probability of 1 indicates total certainty. The smallest a probability can be is 0, meaning that it’s something that cannot happen. Furthermore, you can find the probability that something WILL NOT happen by subtracting the probability that it WILL happen from 1. For example, if the weatherman tells you that there is a 0.3 probability of rain today, then there must be a 0.7 probability that it won’t rain, because 1 − 0.3 = 0.7. Figuring out the probability of any single event is usually simple. When you flip a coin, there are only two possible outcomes, heads and tails; the probability of getting heads is therefore 1 out of 2, or ![]() . When you roll a die, there are six possible outcomes, 1 through 6; the odds of getting a 6 is therefore
. When you roll a die, there are six possible outcomes, 1 through 6; the odds of getting a 6 is therefore ![]() . The odds of getting an even result when rolling a die are
. The odds of getting an even result when rolling a die are ![]() because there are 3 even results in 6 possible outcomes.
because there are 3 even results in 6 possible outcomes.
Here’s an example of a probability question:
![]()
2.A bag contains 7 blue marbles and 14 marbles that are not blue. If one marble is drawn at random from the bag, what is the probability that the marble is blue?
A)![]()
B)![]()
C)![]()
D)![]()
Here’s How to Crack It
Here, there are 21 marbles in the bag, 7 of which are blue. The probability that a marble chosen at random would be blue is therefore  , or
, or ![]() . The correct answer is (A).
. The correct answer is (A).
![]()
Some probability questions might include variables. Not to worry. Plugging in will save the day!
Here’s an example:
![]()
17.A jar contains only red marbles and white marbles. If the probability of selecting a red marble is ![]() , which of the following expressions gives the probability of selecting a white marble in terms of r and y ?
, which of the following expressions gives the probability of selecting a white marble in terms of r and y ?
A)
B)
C)![]()
D)![]()
Here’s How to Crack It
Plug in! You could make the probability of choosing a red marble be ![]() . Then
. Then ![]() =
= ![]() , which means that r = 2 and y = 3.
, which means that r = 2 and y = 3.
Now, to get the numerical answer, you need to remember that the probabilities of all the things that can happen always add up to 1. Since there are only red marbles and white marbles in the jar, choosing a red marble or choosing a white marble are the only things that can happen. So, the probability of selecting a white marble can be found by subtracting the probability of getting a red marble from 1: Probability of white = 1 − ![]() =
= ![]() . That’s your target, so circle it.
. That’s your target, so circle it.
Now, go find the answer that gives you ![]() when r = 2 and y = 3. Choice (B) is =
when r = 2 and y = 3. Choice (B) is =  =
= ![]() . Since no other answer evaluates to
. Since no other answer evaluates to ![]() , (B) is the answer.
, (B) is the answer.
![]()
Finally, let’s look at a probability question based on a chart. Again, getting to the correct answer involves reading the chart carefully to find to right numbers to use.
![]()
26.
Size of College Manhattan High Students Plan to Attend
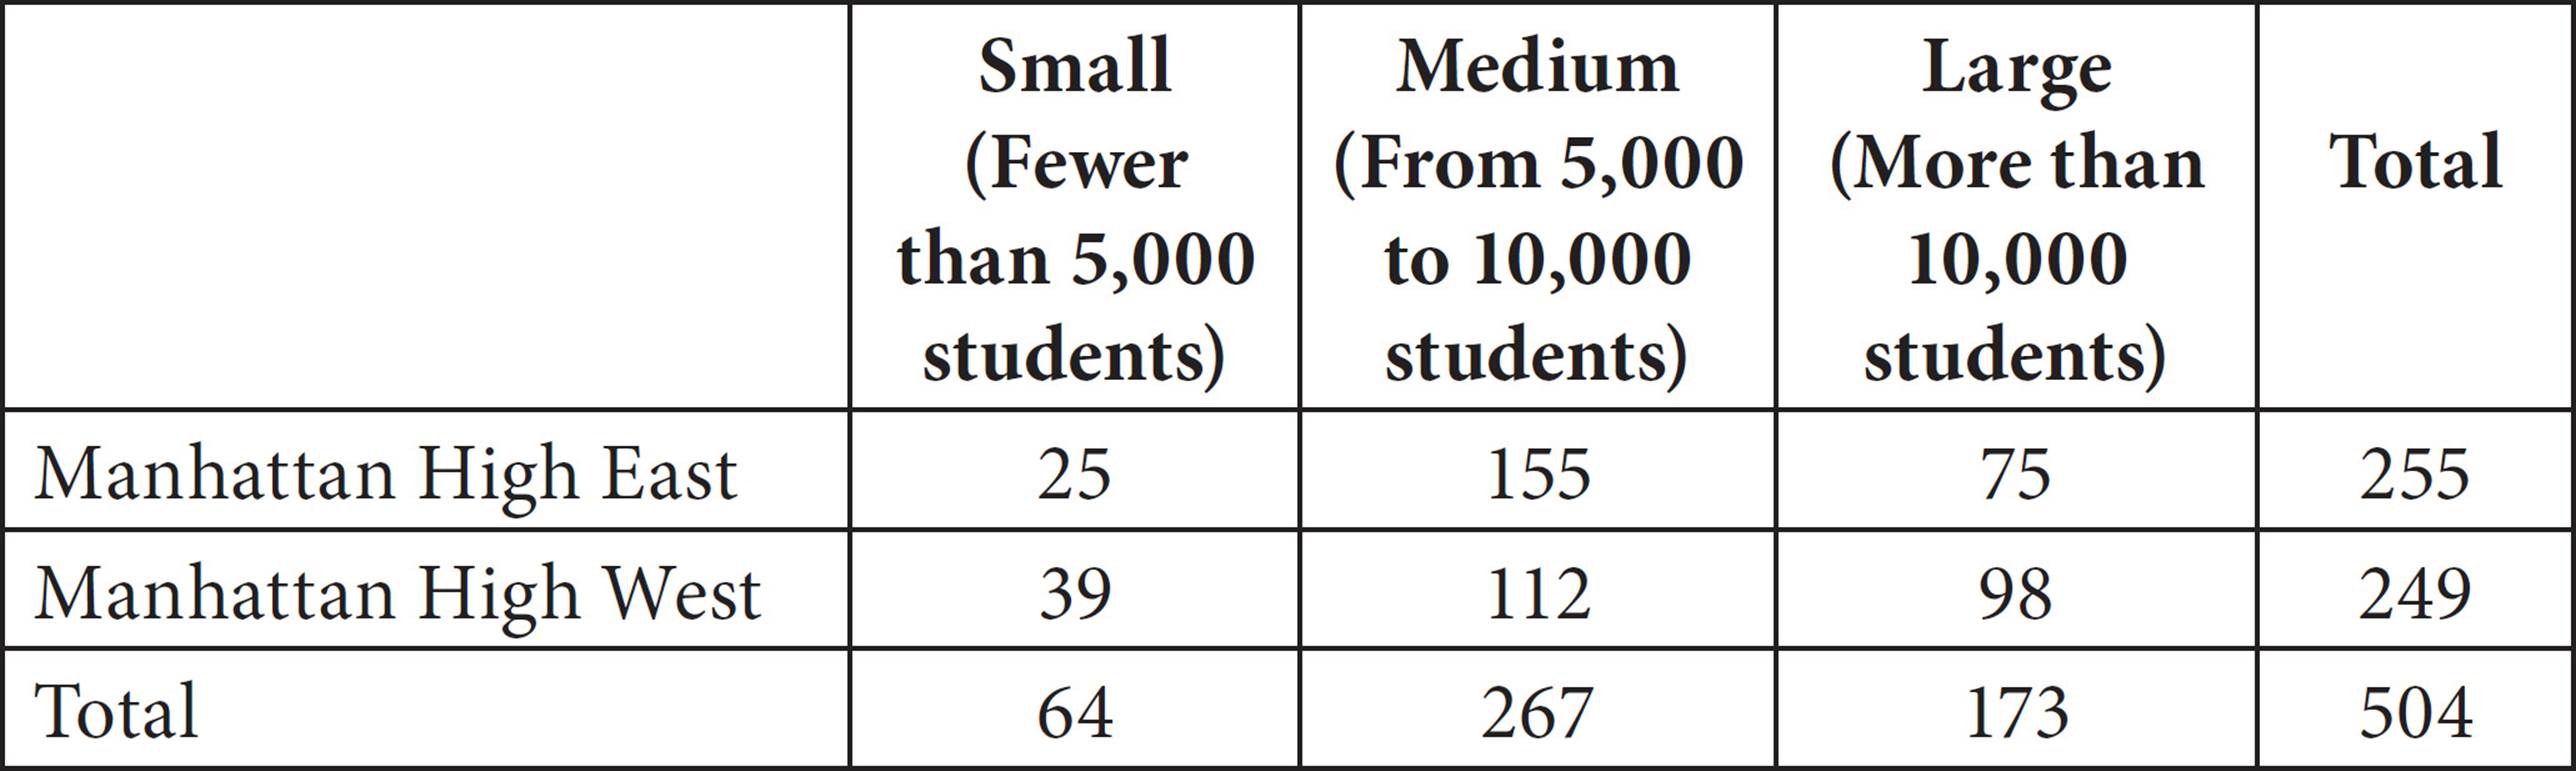
At two high schools, those planning to attend college after graduation were polled. The sizes of the colleges they planned to attend based on student body sizes were tabulated in the table above. The 255 polled students from Manhattan High East had an average SAT score above 1100, and the 249 polled students from Manhattan High West had an average SAT score below 1100. If a poll respondent were chosen at random from those planning to attend a college with at least 5,000 students, what is the probability that the respondent would be enrolled at Manhattan High West?
A)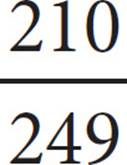
B)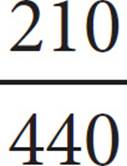
C)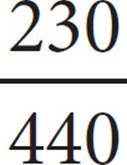
D)
Here’s How to Crack It
Probability is defined as the number of things that fit the requirements divided by the total number of possible outcomes. Read the graph carefully to figure out how many respondents fit into each of these categories. The respondent is chosen from among those planning to attend colleges with “at least 5,000 students.” That means that the total number of possible outcomes includes the 267 respondents who plan to attend medium schools and the 173 who plan to attend large schools, for 440 total. That is the denominator of the probability fraction, and the answer choices aren’t reduced, so the answer must be (B) or (C). To find the number from among these 440 respondents who are enrolled at Manhattan High West, look in that row and add the 112 from the medium column to the 98 from the large column to get 210 for the numerator. The correct answer is (B).
Did the average SAT scores of the students at these two schools affect the answer at all? No! Watch out for extraneous information on the SAT. The test writers may include it to distract you.
![]()
SETS OF QUESTIONS
Sometimes, two questions will refer to the same information. These will usually be found in the calculator-permitted section, where there will be one set in the grid-in part and about three sets in the multiple-choice part of that section. Often, these sets are about arithmetic concepts, but they can also cover things like functions or exponential growth.
Try an arithmetic set on the this page.
![]()
Questions 4 and 5 refer to the following information.
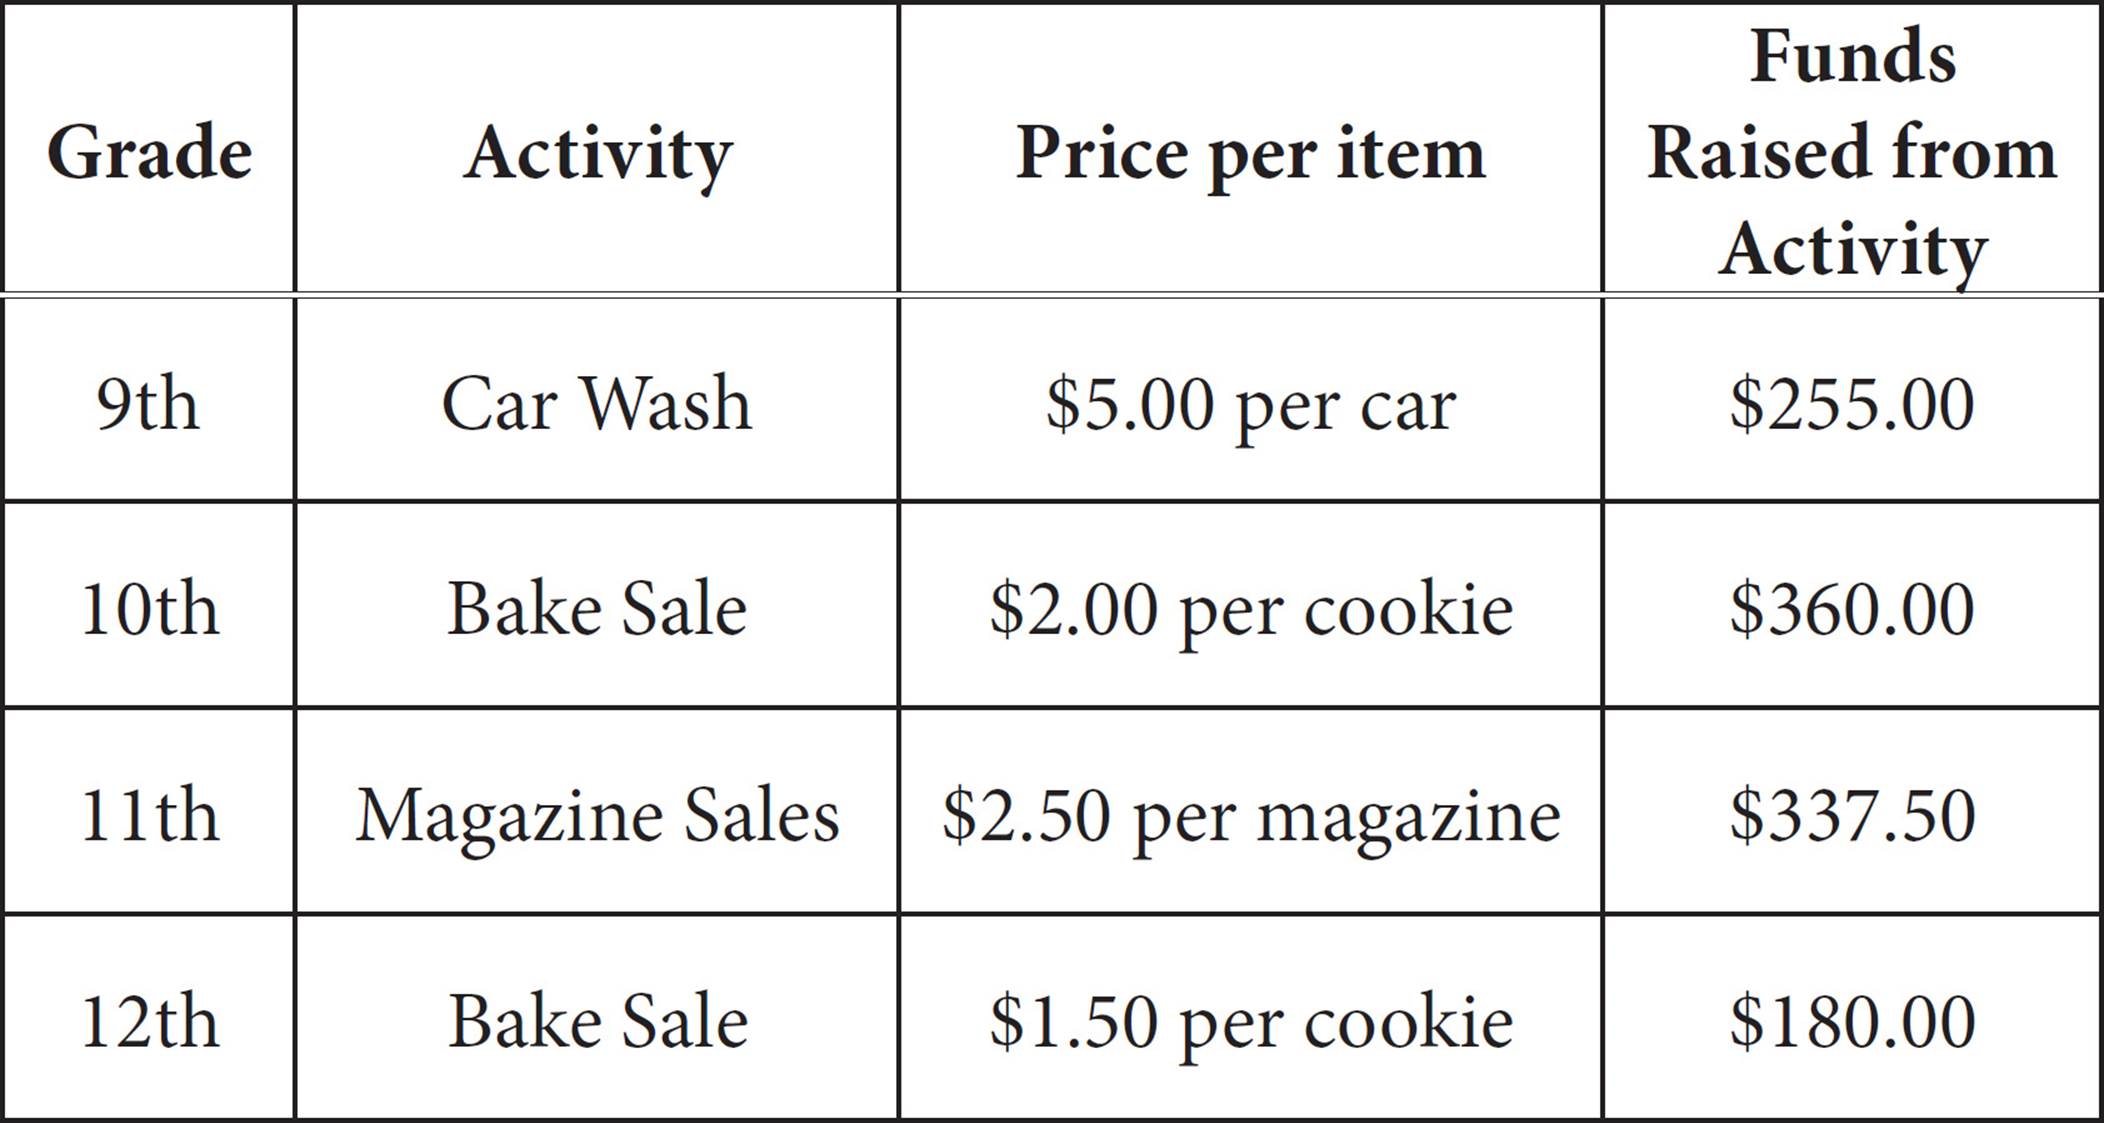
4.How many cars did the 9th grade class wash during the car wash?
A)5
B)51
C)122
D)180
Here’s How to Crack It
Look up the numbers you need on the chart, ignoring all the extraneous information. To find out how many cars the 9th graders washed, take the Funds Raised and divide by the Price per item in the row for the 9th graders.  = 51, which is (B).
5.How many more cookies were sold by the 10th grade than were sold by the 12th grade?
A)60
B)90
C)120
D)150
Here’s How to Crack It
First find the number of cookies sold by 10th graders, again dividing Funds Raised by Price per item.  = 180. Now find the number of cookies sold by 12th graders:
  = 120. Now subtract to find out how many more cookies the 10th graders sold: 180 − 120 = 60, which is (A).
![]()
ANALYSIS IN SCIENCE
If some of these questions are reminding you of science class, you’re not crazy. One of the “Cross-Test scores” the SAT aims to measure is called Analysis in Science. This means that questions on science-based ideas will show up in Reading and Writing passages and also in Math questions. That’s part of the reason for all these charts and graphs. Many times, you will be asked if a conclusion can be reached based on the chart. In those cases, just do as you have been throughout this chapter—carefully look up the numbers in question, do the required calculations, and eliminate answers that aren’t true.
You may also be asked to graph the data presented in a table. Your knowledge of positive and negative relationships from Chapter 11 will help—you can eliminate things with the wrong relationship.
See this page for an example.
![]()
7.
|
Temperature in °F |
Number of Customers |
|
|
10 |
4 |
|
|
20 |
9 |
|
|
30 |
37 |
|
|
40 |
66 |
|
|
50 |
100 |
A coffee shop noticed that the outside temperature affected the number of customers who came to the shop that day, as shown in the table above. Which of the following graphs best represents the relationship between the outside temperature and the number of customers, as indicated by the table?
A)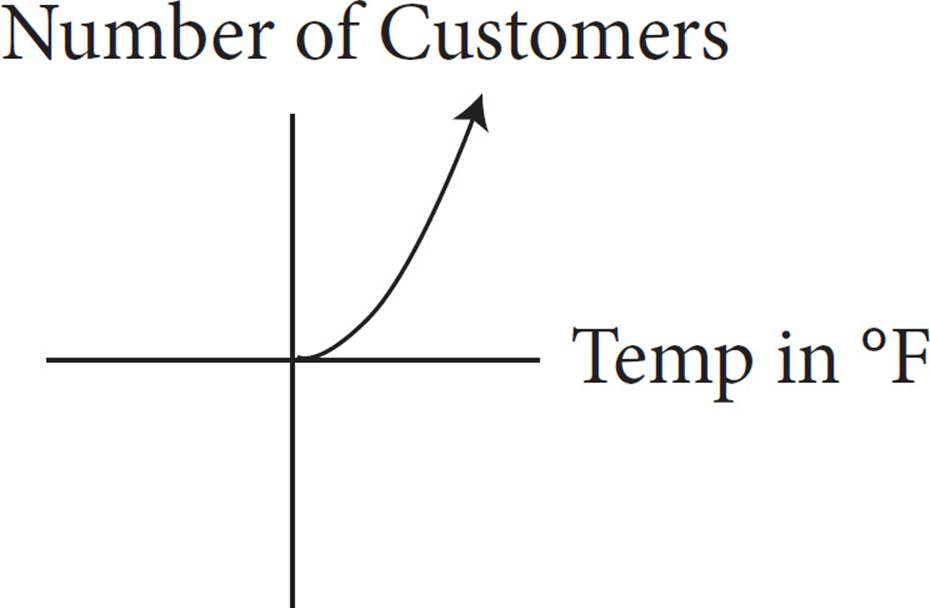
B)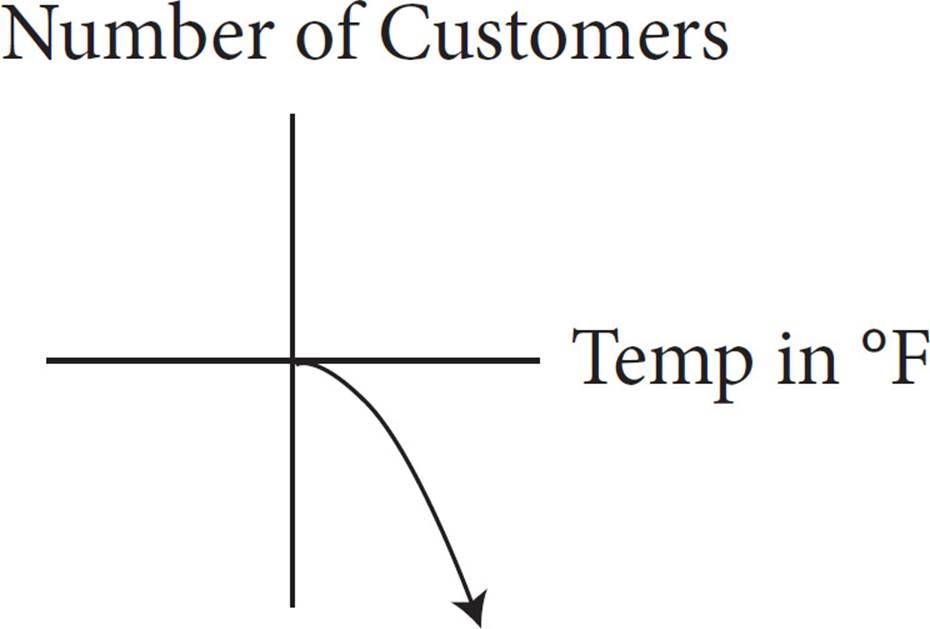
C)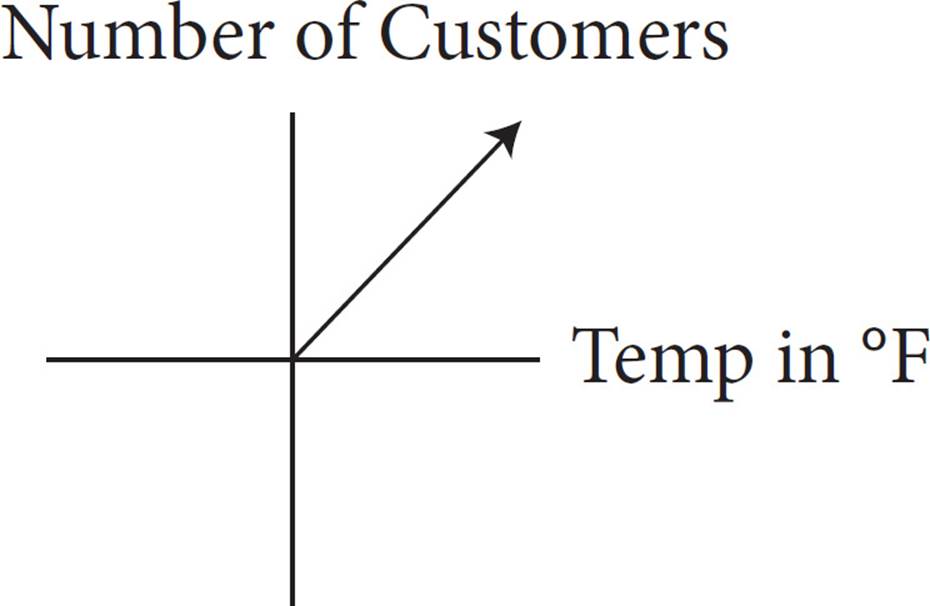
D)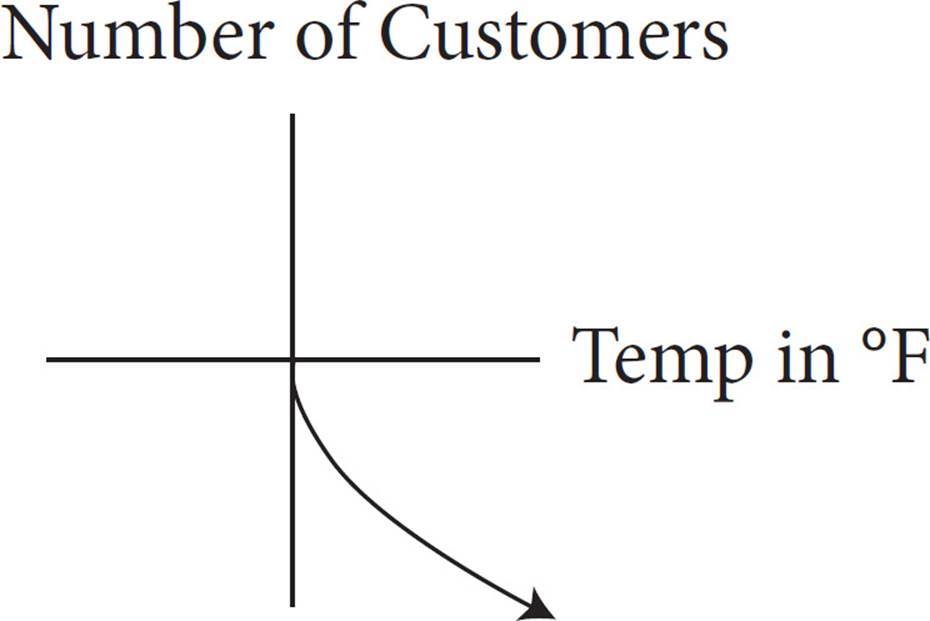
Here’s How to Crack It
Notice that the number of customers increases as the temperature increases. The line of best fit will go up as you follow the graph from left to right, so eliminate (B) and (D). To determine if the correct graph is the one in (A) or in (C), try roughly plotting the data points, and then look at your graph. Notice that the number of customers does not increase by the same number for each 10-degree temperature increase. This is an exponential increase, not a linear increase. So, the graph will be curved. Eliminate (C). Only (A) fits the data in the chart.
![]()
Sometimes you will be asked to draw conclusions without much data at all. The following question from the calculator section has only one number in it, making the calculator pretty useless. Just stick to the facts of the study and make sure not to take a conclusion too far.
![]()
14.When trees become iron deficient, their leaves will turn yellow prematurely. A botanist is testing iron-doped fertilizers on maple trees with iron deficiencies. The botanist has selected 200 maple trees in the state of Wisconsin that have been identified as having an iron deficiency. Half of the trees are randomly chosen to receive the iron-doped fertilizer, while the other half are given a fertilizer without iron. The results from the test show that trees administered the iron-doped fertilizer had fewer premature yellow leaves, indicating an increase in their iron levels. Which of the following statements best describes the results of the test?
A)The iron-doped fertilizer will improve iron levels in any tree.
B)The iron-doped fertilizer reduces premature yellow leaves better than any other fertilizer.
C)The iron-doped fertilizer will cause a significant increase in iron levels.
D)The iron-doped fertilizer will result in fewer premature yellow leaves in maple trees in Wisconsin.
Here’s How to Crack It
For this type of question, underline key words about how the study was conducted and what the study found. In this case, the study was on 200 maples trees with iron deficiencies in Wisconsin, and the conclusion is “The results from the test show that trees administered the iron-doped fertilizer had fewer premature yellow leaves, indicating an increase in their iron levels.” Eliminate answers that don’t hit this mark or go too far. In (A), it says that this treatment will help “any tree.” We are told only about “200 maples trees in the state of Wisconsin,” so we can’t draw conclusions about other trees. Eliminate (A). In (B), the fertilizer used is compared to other fertilizers, which we also don’t know about. Choice (C) sounds good, but it is hard to say what qualifies as “a significant increase in iron levels.” The statement in (D) matches the key words you underlined perfectly without taking any aspect too far.
![]()
Advanced Arithmetic Drill: Calculator-Permitted Section
Work these problems using the advanced arithmetic techniques and tips we’ve covered in this chapter. These would all be found in section 4 of the test, on which calculator use is allowed. Answers and explanations can be found on this page.
5.
20 − 2x
20 − x
20
20 + x
20 + 2x
What is the average (arithmetic mean) of the list of numbers above?
A)20
B)100
C)20 + ![]()
D)
8.
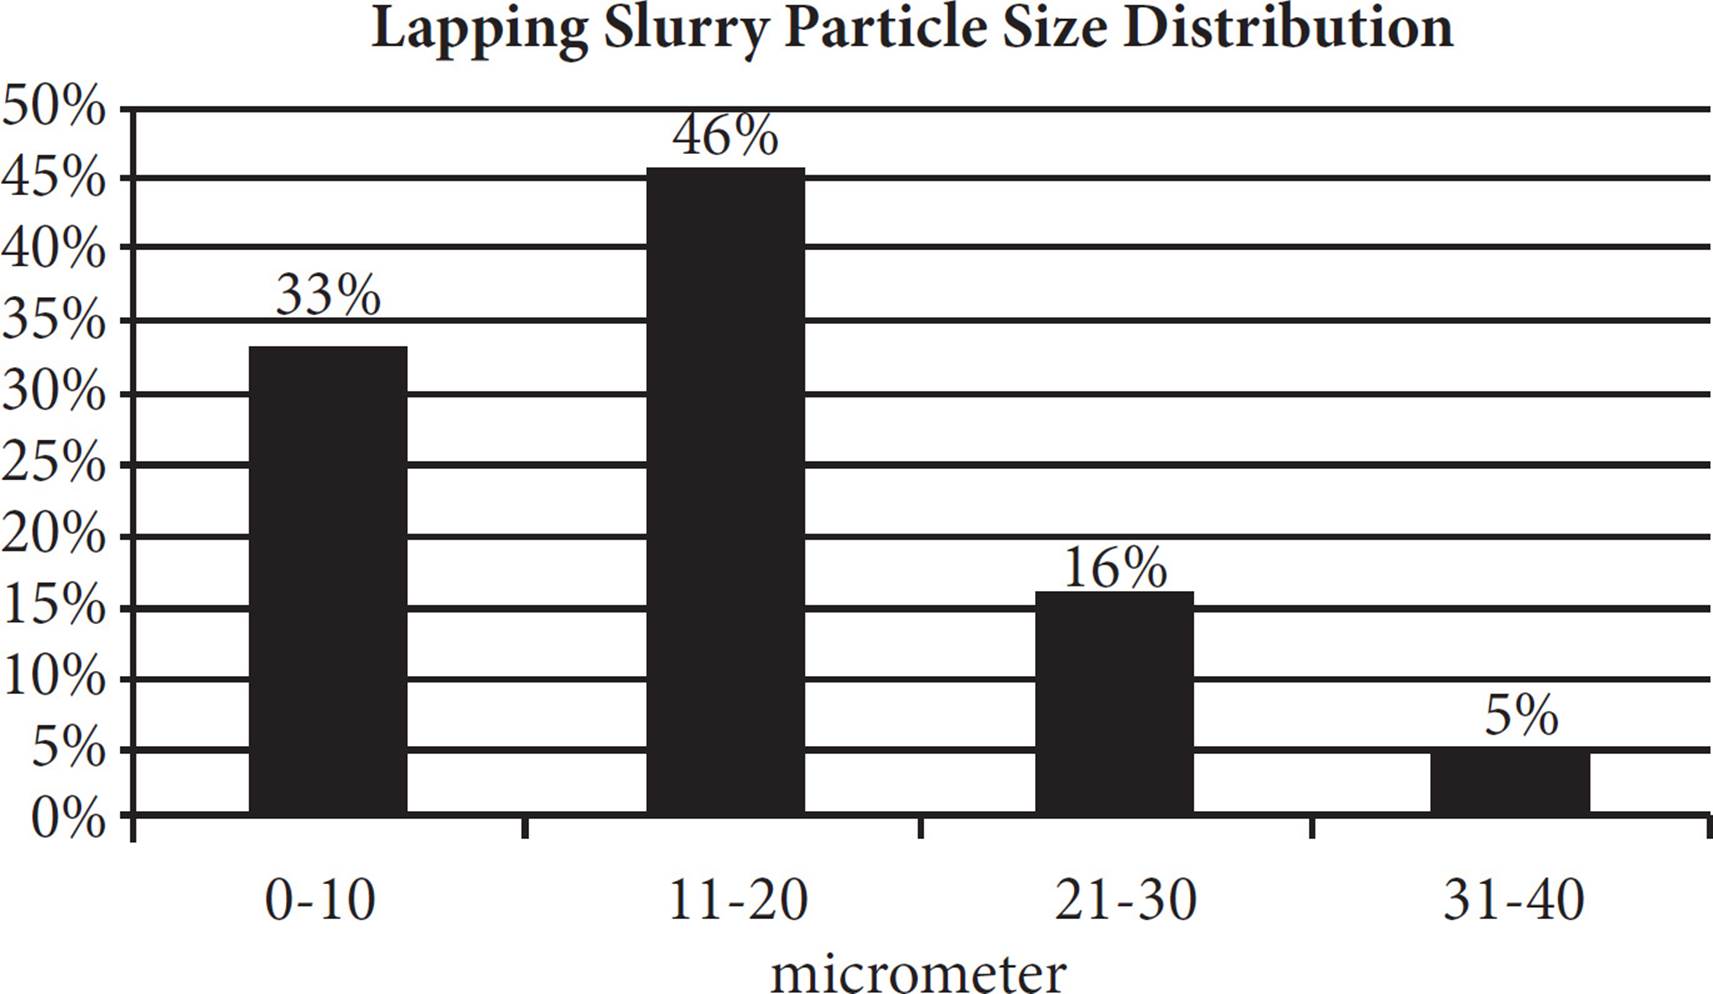
A lapping slurry contains microbeads suspended in a solution and is used to polish a silicon wafer by abrasion of the surface. The distribution of the particle size, in micrometers, is shown above. If the particle size distribution ranges were changed to 0-20 micrometers and 21-40 micrometers, which of the following is the closest to the ratio of the number of 0-20 micrometer microbeads to the number of 21-40 micrometer microbeads?
A)3 : 1
B)4 : 1
C)5 : 2
D)9 : 1
11.Steve ran a 12-mile race at an average speed of 8 miles per hour. If Adam ran the same race at an average speed of 6 miles per hour, how many minutes longer did Adam take to complete the race than did Steve?
A)12
B)16
C)24
D)30
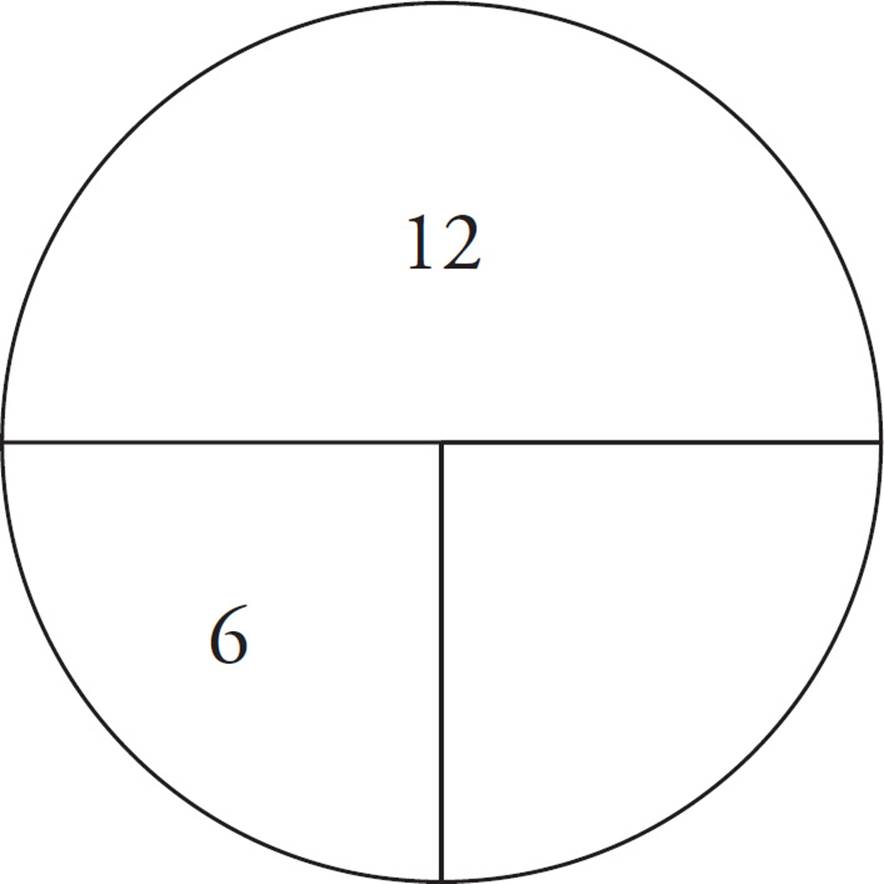
15.
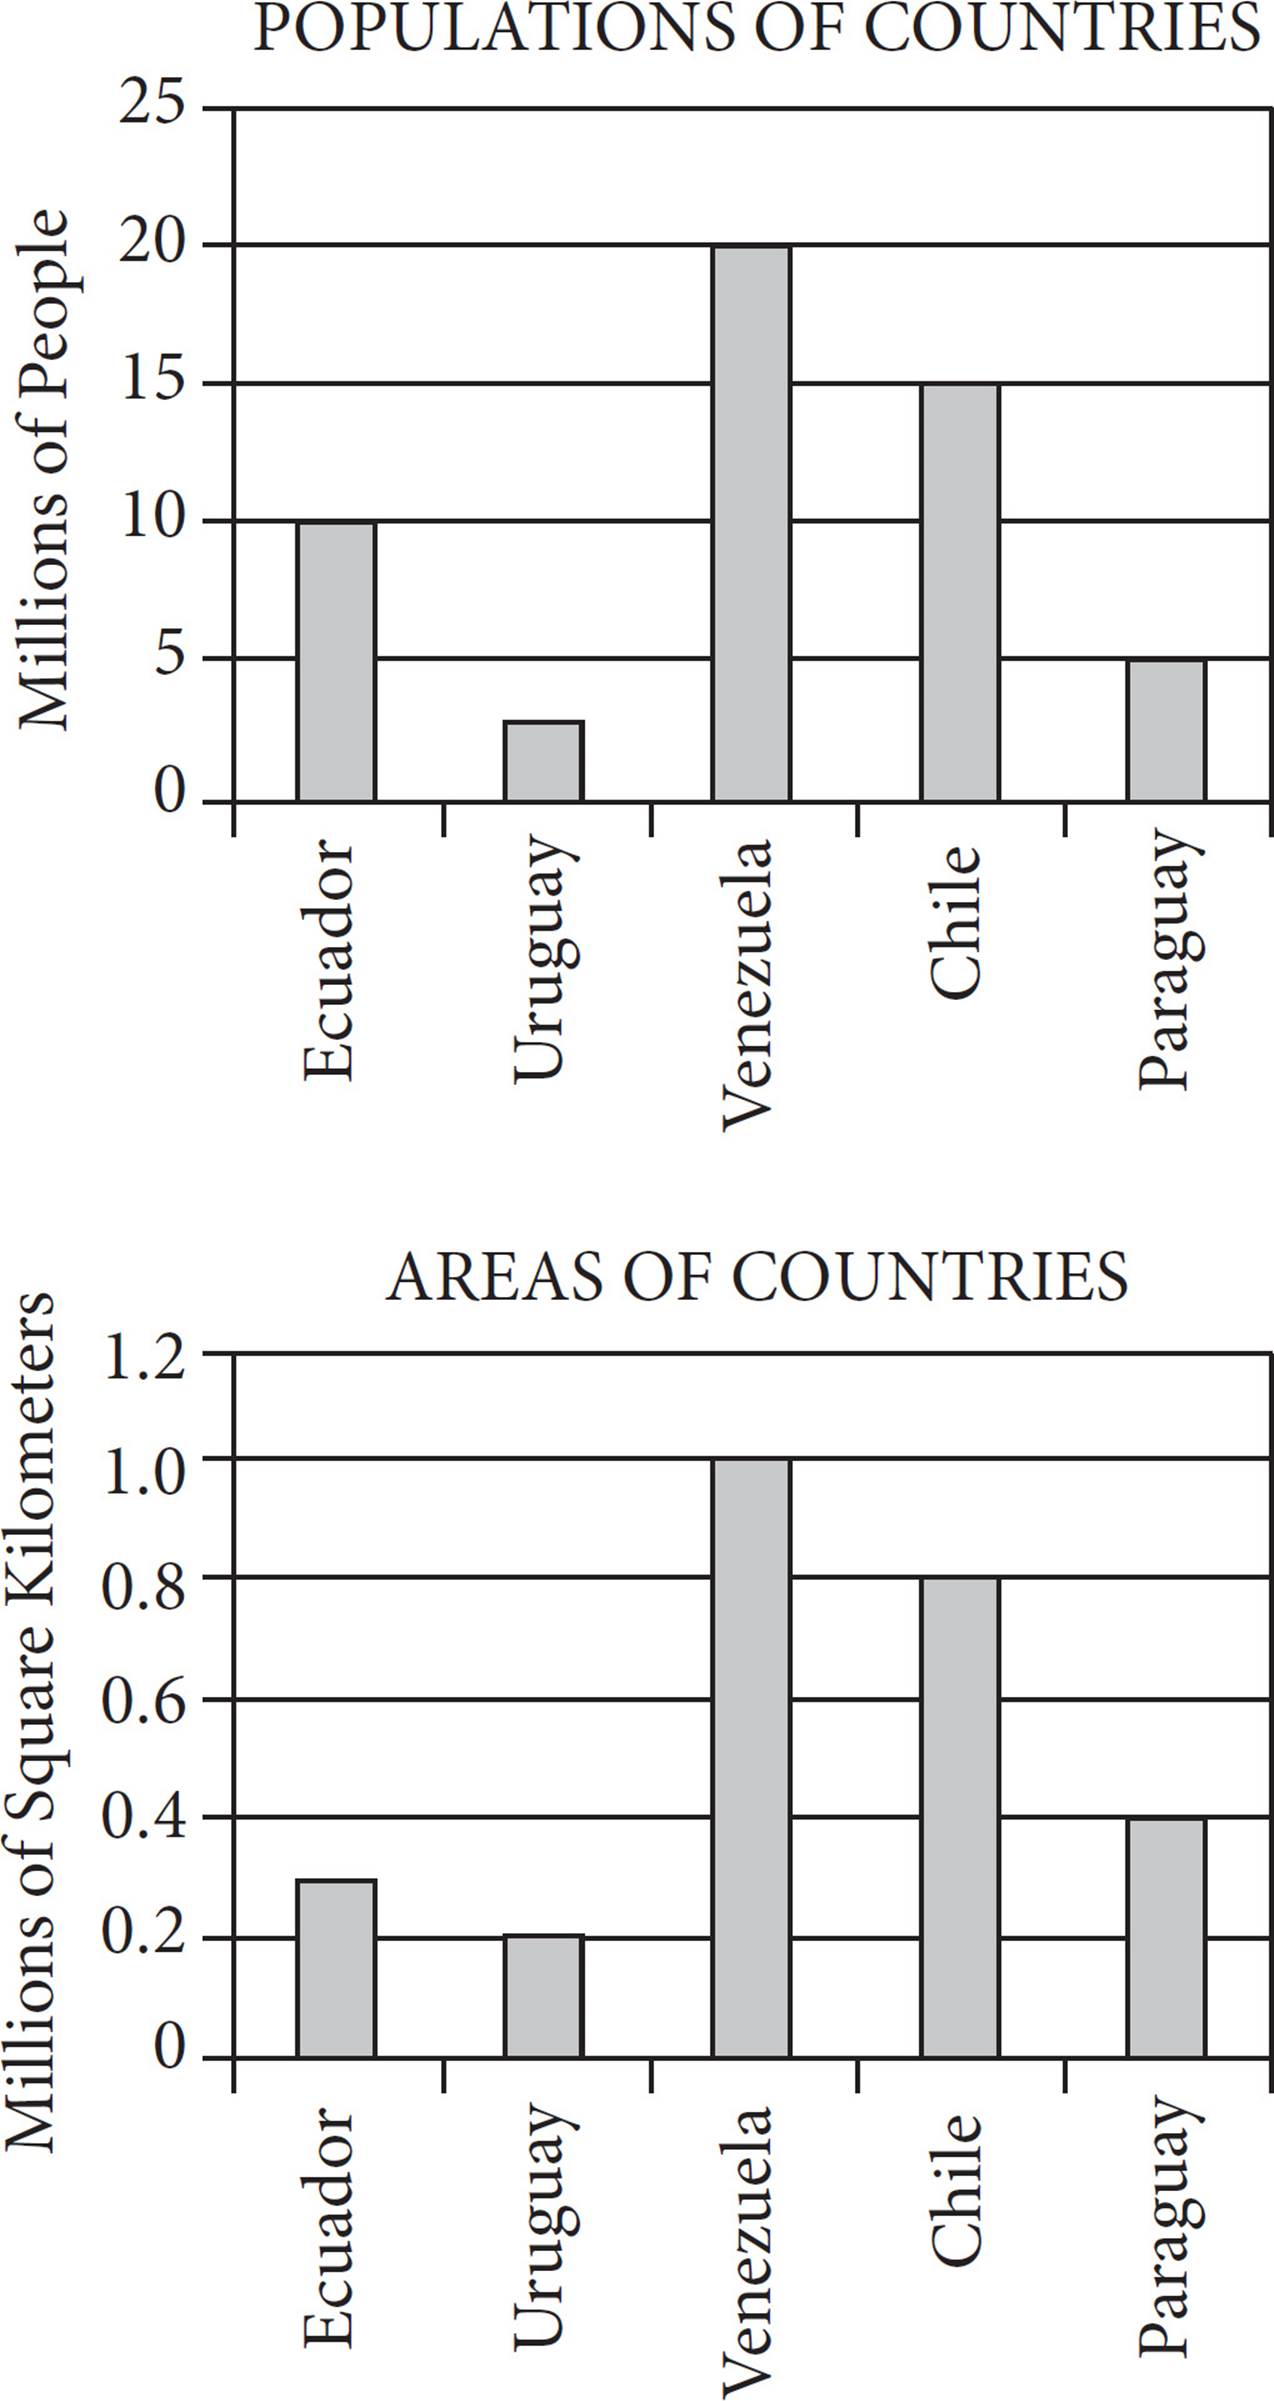
The populations and areas of five countries are shown in the graphs above. If population density is defined as  , which of the five countries has the highest population density?
A)Ecuador
B)Uruguay
C)Venezuela
D)Chile
19.The amount of time that Amy walks is directly proportional to the distance that she walks. If she walks a distance of 2.5 miles in 50 minutes, how many miles will she walk in 2 hours?
A)4.5
B)5
C)6
D)6.5
20.A total of 140,000 votes were cast for two candidates, Skinner and Whitehouse. If Skinner won by a ratio of 4 to 3, how many votes were cast for Whitehouse?
A)30,000
B)40,000
C)60,000
D)80,000
23.
|
SPICE PRICES OF DISTRIBUTOR D |
||
|
Spice |
Price Per Pound |
|
|
Cinnamon |
$8.00 |
|
|
Nutmeg |
$9.00 |
|
|
Ginger |
$7.00 |
|
|
Cloves |
$10.00 |
|
The owner of a spice store buys 3 pounds each of cinnamon, nutmeg, ginger, and cloves from distributor D. She then sells all of the spices at $2.00 per ounce. What is her total profit, in dollars?
(1 pound = 16 ounces)
A)$192
B)$282
C)$384
D)$486
25.
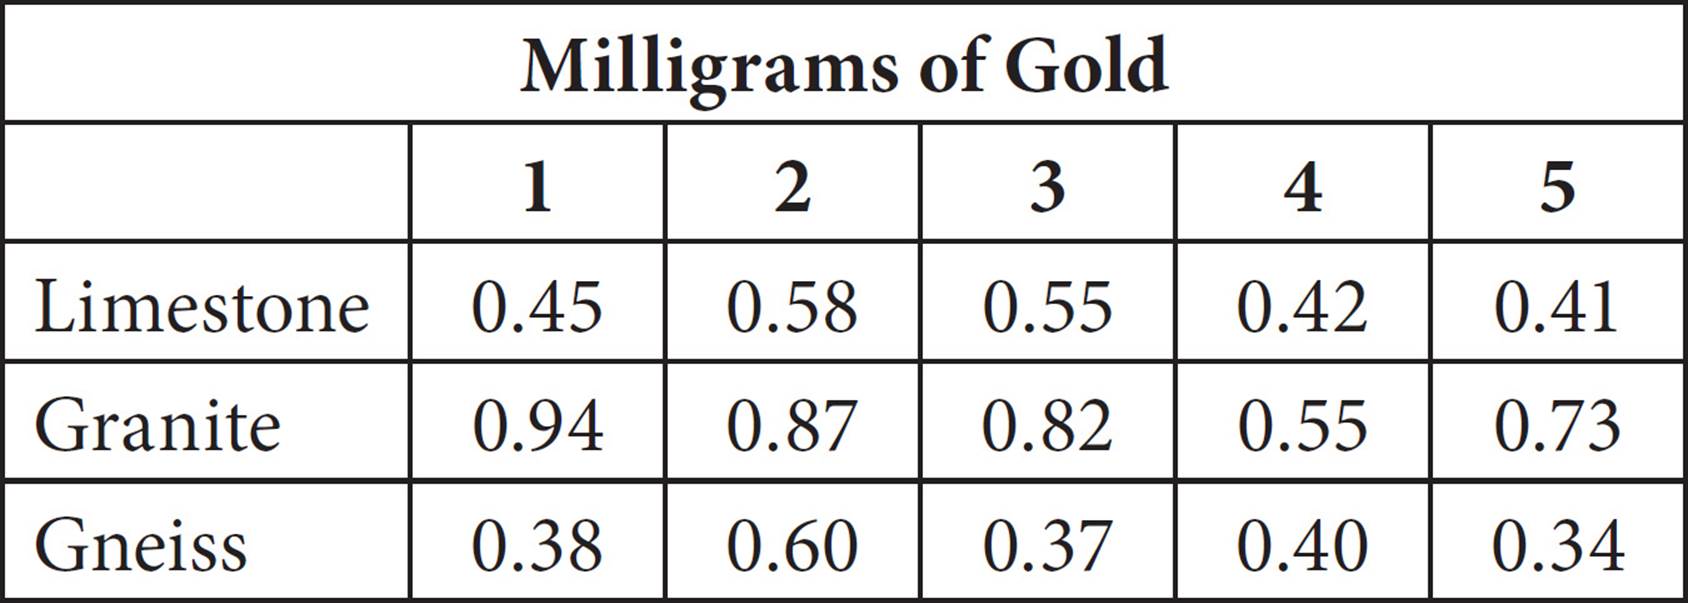
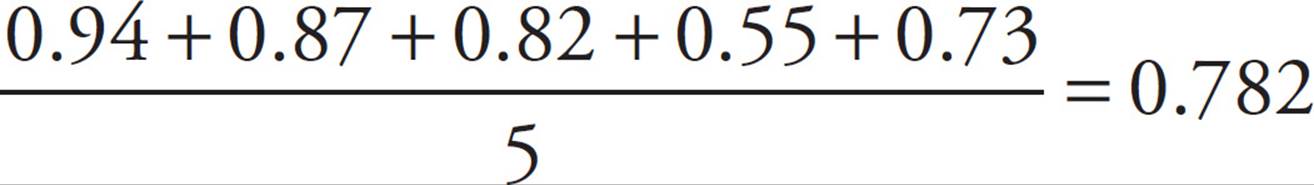
Five samples of each of three different rock types were collected on a hiking trip in Colorado. Each sample was analyzed for its gold content. The milligrams of gold found in each sample are presented in the table above. What is the percent difference of the average gold content in the granite samples when compared to the average gold content of the gneiss samples?
A)The gold content in the gneiss samples is 62% higher than the gold content in the granite samples.
B)The gold content in the granite samples is 62% higher than the gold content in the gneiss samples.
C)The gold content in the gneiss samples is 87% higher than the gold content in the granite samples.
D)The gold content in the granite samples is 87% higher than the gold content in the gneiss samples.
26.Of all the houses in a certain neighborhood, 80% have garages. Of those houses with garages, 60% have two-car garages. If there are 56 houses with garages that are not two-car garages, how many houses are there in the neighborhood?
A)93
B)117
C)156
D)175
28.On Tuesday, a watchmaker made 4 more watches than he made during the previous day. If he made 16% more watches on Tuesday than on Monday, how many watches did he make on Tuesday?
A)20
B)21
C)25
D)29
CHAPTER DRILL ANSWERS AND EXPLANATIONS
Fractions, Decimals, and Percents Drill
1. ![]() 0.5 50
0.5 50
2. ![]() 3.0 300
3.0 300
3.  0.005 0.5
4. ![]()
![]() 33
33![]()
Advanced Arithmetic Drill: Calculator-Permitted Section
5. AVariables in the answers? Plug in! Make up a value for x. Let’s say that x is 3. The list of numbers then becomes 20 − 2(3), 20 − 3, 20, 20 + 3, 20 + 2(3), so the list is 14, 17, 20, 23, and 26. To find the average, make an average pie: We know the number of things (5) and the total (14 + 17 + 20 + 23 + 26 = 100), so the average is 100 ÷ 5 = 20, which is (A).
8. BIn the new groupings, 79% of the particles are in the 0–20 micrometer grouping (33% + 46% = 79%) and 21% of the particles are in the 21–40 micrometer grouping (16% + 5%) = 21%. That is a ratio of 79:21. Because the question is asking for the closest ratio, round the numbers to get a ratio of 80:20, or 4:1. The correct answer is (B).
11. DUse the rate pie to calculate the time for each runner. Steve runs 12 miles at 8 miles per hour, so his pie looks like this:
To find his time, divide his distance by his rate, which means that he runs for 1![]() hours (or 1.5 if you’re using your calculator). Adam runs the same 12 miles at 6 miles per hour, so this is his rate pie:
hours (or 1.5 if you’re using your calculator). Adam runs the same 12 miles at 6 miles per hour, so this is his rate pie:
This means that Adam runs for 2 hours. Adam takes half an hour longer to complete the race, and half an hour is 30 minutes: (D).
15. AThe top graph is of the countries’ populations, and the bottom graph is of the countries’ areas. Find the population density,  , for each country by taking its number from the top graph and dividing that by its number from the bottom graph:
Ecuador =  , which equals 33.33
Uruguay =  , which equals 12.5
Venezuela =  , which equals 20
Chile =  , which equals 18.75
The highest value among the countries is that of Ecuador, which is (A).
19. CSince we know the time that Amy walked and the distance she walked are directly proportional, we can set up a proportion to show her distance ÷ time. We want to know how many miles she’ll walk in two hours, so put 120 (60 × 2) minutes in the second half of the ratio:  =
=  . To solve, cross-multiply, and you’ll get 50x = 2.5 × 120; 50x = 300; x = 6 miles, which is (C).
20. CSince this is a ratio question, let’s draw a Ratio Box. We know the ratio for the votes for Skinner and Whitehouse, and the total number of votes cast. Fill in the total by adding the ratio (4 + 3 = 7), and then find the multiplier by seeing how many times 7 goes into 140,000 (140,000 ÷ 7 = 20,000).
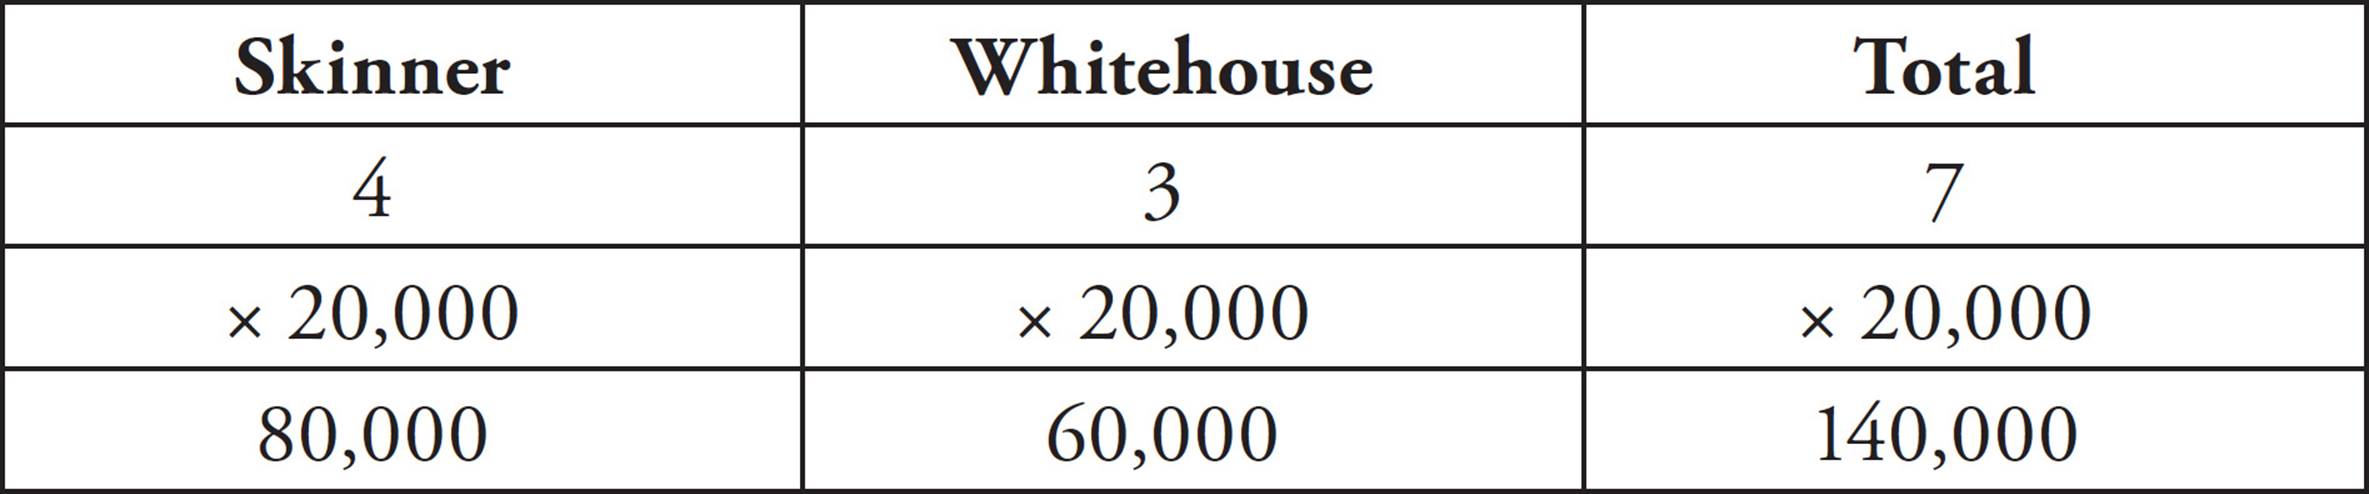
The question wants to know how many votes Whitehouse received, which is 60,000, (C).
23. BThis is a hard question, so you have to stay on your toes. If the owner buys 3 pounds of each spice, that means she pays the following amounts for each spice:
cinnamon: $8 × 3 = $24
nutmeg: $9 × 3 = $27
ginger: $7 × 3 = $21
cloves: $10 × 3 = $30
So she pays a total of 24 + 27 + 21 + 30, or $102 for 12 pounds of spices. She then sells the spices per ounce, so you have to figure out first how many ounces of spices she has. If 1 pound is 16 ounces, then 12 pounds is 12 × 16, or 192 ounces. She sells all the spices at $2 per ounce, so she makes 192 × $2, or $384. To figure out her profit, subtract the amount she paid for the spices from the amount she made selling them: $384 − $102 = $282, (B).
25. DThe average gold content in the granite samples can be calculated as follows:
The average gold content in the gneiss samples can be calculated as
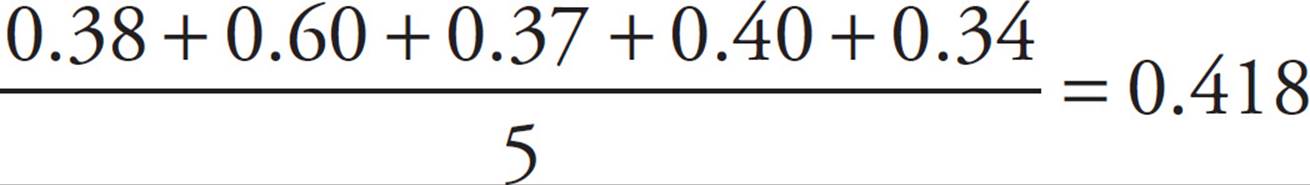
Because the average gold content in the granite samples is higher, you can eliminate (A) and (C). Ballpark to find the right answer. 0.782 is almost twice as much as 0.418. Therefore, granite contains, on average, almost 100% more gold than gneiss does. The correct answer is (D).
26. DStart by figuring out what percent of the houses do not have two-car garages. Since 60% of the houses with garages have two-car garages, 40% of the houses with garages do not have two-car garages. In other words, 40% of 80% of the houses do not have two-car garages. Translate that into math to get  ×
×  = 0.32 or 32% of the houses. The problem tells us that 56 houses do not have two-car garages, which means 32% of the houses equals 56. Translating into math gives us
  × x = 56. Solve for x, and you’ll get 175, which is (D).
28. DLet’s try out the answers and see which one works. Start with (B). If the watchmaker made 21 watches on Tuesday, then he must have made 17 watches on Monday. We know that he should have made 16% more watches on Tuesday than on Monday, so let’s use the percent change formula 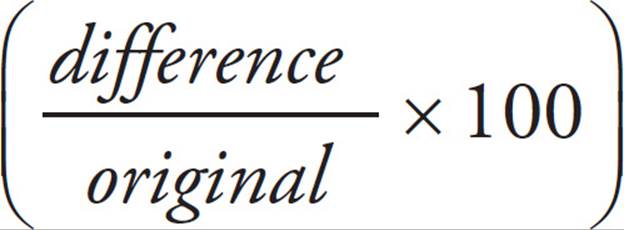 to see if we get 16%:
 ≈ 23.5%, which is too big. Eliminate answer choice (B). We want the 4 watches to be a smaller percent of the total, so we need a bigger total. Try a bigger answer choice, like (D). If he made 29 watches on Tuesday, then he made 25 watches on Monday. Now the percent change is
  = 0.16 = 16%, which is exactly what we wanted. Therefore, (D) is your answer.
Summary
○A ratio can be expressed as a fraction, but ratios are not fractions. A ratio compares parts to parts; a fraction compares a part to the whole.
○You can use a Ratio Box to solve most ratio questions.
○Direct proportion is  =
=  . Indirect proportion is x1y1 = x2 y2.
○A percentage is just a convenient way of expressing a fraction whose bottom is 100.
○To convert a percentage to a fraction, put the percentage over 100 and reduce.
○To convert a fraction to a percentage, use your calculator to divide the top of the fraction by the bottom of the fraction. Then multiply the result by 100.
○To convert a percentage to a decimal, move the decimal point two places to the left. To convert a decimal to a percentage, move the decimal point two places to the right.
○In problems that require you to find a series of percentage increases or decreases, remember that each successive increase or decrease is performed on the result of the previous one.
○If you need to find the percent increase or decrease use % change =  × 100
× 100
○To find the average (arithmetic mean) of several values, add up the values and divide the total by the number of values.
○Use the Average Pie to solve problems involving averages. The key to most average problems is finding the total.
○The median of a group of numbers is the number that is exactly in the middle of the group when the group is arranged from smallest to largest, as on a number line. If there is an even number of numbers, the median is the average of the two middle numbers.
○The mode of a group of numbers is the number in the group that appears most often.
○The range of a group of numbers is the difference between the greatest number in the group and the least number.
○On questions about rates, use the Rate or Work Pie. Be careful with the units—the SAT will often require you to do a unit conversion such as minutes to hours or inches to feet.
○Probability is expressed as a fraction:
Probability of x =