5 Steps to a 5 AP Psychology, 2014-2015 Edition (2013)
STEP 4. Review the Knowledge You Need to Score High
Chapter 6. Research Methods
IN THIS CHAPTER
Summary: In their scientific study of behavior and mental processes, psychologists aim to describe, understand, predict, and explain psychological phenomena. Theories are organized sets of concepts that explain phenomena. Psychologists conduct research to answer behavioral questions. They systematically collect accurate data through a variety of carefully made observations and measurements. Scientific experiments, naturalistic observations, interviews, questionnaires, case studies, and psychological tests are some methods psychologists use to explore our personalities, values, intelligence, talents, and the effects of heredity and environment on our development. The scientific method is a set of general procedures psychologists use for gathering and interpreting data. Other researchers working independently must be able to obtain similar results using the same methods; this is called replication.
This chapter examines research methods and statistics used to make sense of research data.

Key Ideas
![]() Experimental Method
Experimental Method
![]() The Controlled Experiment
The Controlled Experiment
![]() Eliminating Confounding Variables
Eliminating Confounding Variables
![]() Quasi-experimental Research
Quasi-experimental Research
![]() Correlational Research
Correlational Research
![]() Naturalistic Observation
Naturalistic Observation
![]() Survey and Test Methods
Survey and Test Methods
![]() Case Study
Case Study
![]() Elementary Statistics
Elementary Statistics
![]() Descriptive Statistics
Descriptive Statistics
![]() Measures of Central Tendency
Measures of Central Tendency
![]() Measures of Variability
Measures of Variability
![]() Correlation
Correlation
![]() Graphic Representation of Correlation
Graphic Representation of Correlation
![]() Inferential Statistics
Inferential Statistics
![]() Ethical Guidelines
Ethical Guidelines
Experimental Method
Some psychologists conduct experimental research in laboratories designed for carefully controlling conditions and measuring behavior.
“There’s a good probability that one of the essays on the AP exam will focus on research methods, especially experiments.”
—Elliott S., AP Teacher
The Controlled Experiment
The laboratory is one of the places where scientists test hypotheses, predictions of how two or more factors are likely to be related. Variables are factors that can have different values. In a scientific experiment, the researcher systematically manipulates a variable under controlled conditions and observes the response. The factor the researcher manipulates is called the independent variable (IV). The dependent variable (DV) is the behavior or mental process that is being measured, the factor that may change as a result of manipulation of the independent variable. If the dependent variable changes when only the independent variable is changed, the researcher can conclude that the change in the independent variable caused the change in the dependent variable. Thus, the independent variable is the cause, and the dependent variable is the effect. A controlled experiment is the only research method that can establish a cause and effect relationship.

An effective way to determine the independent and dependent variables is to word the hypothesis in the form of an “If …, then …” statement. What follows the “if” is the independent variable (cause), and what follows the “then” is the dependent variable (effect). For example, “If students study for a quiz before going to sleep, rather than in the morning, then they will get higher scores on the quiz.” Studying for a quiz before going to sleep, rather than in the morning, is the independent variable and cause. Getting a higher score on the quiz is the dependent variable and effect.
For example, an experimenter hypothesizes that sleeping after studying for a biology quiz in the evening is more effective than studying for the same amount of time after waking in the morning. The population includes all of the individuals in the group to which the study applies (all of the students enrolled in introductory biology courses at the university for this example). To save time and money, most researchers use a subgroup of the population called a sample in their experimental research. The larger the sample size, the more likely it is to represent the population. The sample must fairly represent the whole group. This is achieved when every member of the population has an equal chance of being selected for the sample, when participants are selected randomly. Random selection can be achieved by putting all of the names in a hat and picking out a specified number of names, by alphabetizing the roster of enrollees and choosing every fifth name, or by using a table of random numbers to choose participants. These are examples. To test the hypothesis, the scientist needs to randomly assign some subjects to an experimental group that receives the treatment and to randomly assign others to a control group that does not receive the treatment. The control group is a comparison group. This is called a between-subjects design because the participants in the experimental and control groups are different individuals. Everything is similar between the experimental group and the control group except for the independent variable. Random assignment of participants to the experimental and control groups minimizes the existence of preexisting differences between the two groups. Differences between the experimental group and the control group other than those resulting from the independent variable are called confounding variables. Confounding variables limit confidence in research conclusions. All participants, also called subjects, attend the same two sessions upon which the quiz is based. The experimental group is permitted to study for the quiz for 1 hour in the evening before going to sleep while the control group watches an unrelated comedy show. The control group studies for the quiz for 1 hour in the morning after awakening. The experimental group watches the comedy show in the morning at the same time. Everyone eats breakfast together, and then they all take the same quiz. If the experimental group scores significantly higher than the control group, the experimenter can say that the results support the hypothesis. How does the experimenter measure effectiveness of studying? The experimenter uses the score on the quiz as the operational definition of effectiveness of studying. An operational definitiondescribes the specific procedure used to determine the presence of a variable.
In order to attribute a particular result to a specific factor, the controlled experiment must limit variables. Confounding variables that could contribute to the effect must be eliminated. Participants in the biology quiz experiment need to share the same environmental factors; they need to eat the same foods, sleep in similar beds in the same rooms, sleep for the same amount of time, etc.
Eliminating Confounding Variables
Experimenter bias (also called the experimenter expectancy effect) is a phenomenon that occurs when a researcher’s expectations or preferences about the outcome of a study influence the results obtained. This is a special kind of confounding variable that can occur when a researcher is unaware that he or she is treating either the experimental group or control group differently from the other. A simple smile when addressing the experimental group that is not also shown to the control group qualifies as experimenter bias and as a confounding variable. The clues participants discover about the purpose of the study, including rumors they hear about the study suggesting how they should respond, are called demand characteristics. To eliminate the effects of demand characteristics, experimenters use the single-blind procedure, a research design in which the participants don’t know which treatment group—experimental or control—they are in. To eliminate the effects of both experimenter bias and demand characteristics, experimenters use the double-blind procedure, a research design in which neither the experimenter nor the participants know who is in the experimental group and who is in the control group. The double-blind is most easily accomplished when a second experimenter or assistant who doesn’t know the hypothesis or group assignments administers the experiment, keeping the principal investigator away from the subjects. When a number of factors might be responsible for an observed effect, to determine which deserves the credit, an experimenter needs to systematically manipulate or vary one or more factors while holding constant all the others that might be important. The effects of these manipulated events on some behavioral reaction are then assessed. It is then possible to demonstrate whether one factor is responsible for the result or whether an interacting package of factors is involved.
In experiments involving drugs, participants in the experimental group usually receive the drug with the active ingredient, while subjects in the control group receive a drug that seems identical, but lacks the active ingredient. The imitation pill, injection, patch, or other treatment is called a placebo. Subjects sometimes believe that the treatment will be effective, and they think they experience an improvement in health or well-being. This is the placebo effect.The placebo effect is now used to describe any cases when experimental participants change their behavior in the absence of any kind of experimental manipulation. The experiments need not involve drugs at all.
A research design that uses each participant as his or her own control is called a within-subjects design. For example, the behavior of an experimental participant before receiving treatment might be compared to his or her behavior after receiving treatment. Two treatments might be tried. If two treatments are used, the order of the treatments could cause an effect. To eliminate the possibility, psychologists use counterbalancing, a procedure that assigns half the subjects to one of the treatments first and the other half of the subjects to the other treatment first.
Quasi-Experimental Research
Quasi-experimental research designs are similar to controlled experiments, but participants are not randomly assigned. Experimental research designs to study differences in behavior between men and women, boys and girls, young and old, or students in one class and students in another class are “sort of” experiments or quasi-experiments. Because of confounding variables—preexisting differences between the experimental group and comparison groups—quasi-experiments do not establish cause and effect relationships, although they can point in the direction of them.
Correlational Research
Although experiments conducted under carefully controlled conditions help establish cause and effect relationships, the time, expense, and artificiality of the environment limit that type of research. Psychologists more often use descriptive and correlational research methods such as survey methods that involve interviews or questionnaires, tests, and naturalistic observation. Correlational methods look at the relationship between two variables without establishing cause and effect relationships. The goal is to determine to what extent one variable predicts the other. Many factors that seem to be causally related are not. Often it’s a third factor that causes the other two.
Naturalistic Observation
Naturalistic observation is carried out in the field where naturally occurring behavior can be observed. Naturalistic observation studies gather descriptive information about typical behavior of people or animals without manipulating any variables. For example, Jane Goodall’s team of scientists has been observing the behavior of chimpanzees in the wild for decades. Such studies have enabled scientists to predict when the chimps will fight each other or when they will mate. Similarly, other scientists have been studying human behavior in the workplace, in schools, in bars, etc. The data can be used for correlational analysis or for generating ideas for other research.
Survey Method
In the survey method, researchers use questionnaires or interviews to ask a large number of people questions about their behaviors, thoughts, and attitudes. In order for the information to be useful, the participants in the study should be representative of a larger population, which can best be achieved by random sampling. Accuracy of data is an issue because people sometimes distort their answers to appear more “politically correct,” or they fail to recall information correctly. The data from surveys can be used for correlational analysis or for generating ideas for other research.
Retrospective or ex post facto studies look at an effect and seek the cause. For example, when researchers found an increase in babies being born with deformed limbs, especially in England but also in the United States and other western countries in the early 1970s, they asked the mothers of the babies many questions and then compared the answers of all of the mothers through correlational analysis. They found the strongest relationship between the mother taking the drug thalidomide during the pregnancy and the appearance of the limb deformities in the babies. Controlled experiments with rodents verified that the drug caused abnormal limb development in the babies of the animals.
Test Method
Tests are procedures used to measure attributes of individuals at a particular time and place. Like surveys, tests can be used to gather huge amounts of information relatively quickly and cheaply. Results of tests can be used for correlational analysis or for generating ideas for other research.
For surveys or tests to be accurate measures of behaviors or mental processes, they must be both reliable and valid. Reliability is consistency or repeatability. Subjects should answer questions the same way on two different occasions. A subject should also get the same score on a test on two different occasions. Validity is the extent to which an instrument measures or predicts what it is supposed to. Questions about frequency of showering would not be valid indicators of cooking ability. Algebra questions would not be valid measures of what you learned in this chapter.
Case Study
Another research method, the case study method, is an in-depth examination of a specific group or single person that typically includes interviews, observations, and test scores. The intensive description and analysis of the small group or individual is especially useful for understanding complex or rare phenomena. For example, case studies done on patients with gunshot wounds to the head enabled scientists to better understand how the loss of brain tissue affected specific aspects of behavior. Case studies have enabled us to better understand a wide range of topics, from how the brain processes information to autism. Clinical psychologists frequently do case studies.
Elementary Statistics
A large amount of data can be collected in research studies. Psychologists need to make sense of the data. Qualitative data are frequently changed to numerical data for ease of handling. Quantitative data already are numerical. Numbers that are used simply to name something are said to be on a nominal scale and can be used to count the number of cases. For example, for a survey, girls can be designated as “1,” whereas boys can be designated as “2.” These numbers have no intrinsic meaning. Numbers that can be ranked are said to be on an ordinal scale, and can be put in order. For example, the highest scorer can be designated as “1,” the second highest as “2,” the third highest as “3,” etc. These numbers cannot be averaged. Number 1 could have scored 50 points higher than 2. Number 2 may have scored 4 points higher than 3. If there is a meaningful difference between each of the numbers, the numbers are said to be on an interval scale. For example, the difference between 32° Fahrenheit (F) and 42°F is 10°F. The difference between 64°F and 74°F is also 10°F. However, 64°F is not twice as hot as 32°F. When a meaningful ratio can be made with two numbers, the numbers are said to be on a ratio scale. The key difference between an interval scale and a ratio scale is that the ratio scale has a real or absolute zero point. For quantities of weight, volume, and distance, zero is a meaningful concept, whereas the meaning of 0°F is arbitrary.
Statistics is a field that involves the analysis of numerical data about representative samples of populations.
Descriptive Statistics
Numbers that summarize a set of research data obtained from a sample are called descriptive statistics. In general, descriptive statistics describe sets of interval or ratio data. After collecting data, psychologists organize the data to create a frequency distribution, an orderly arrangement of scores indicating the frequency of each score or group of scores. The data can be pictured as a histogram—a bar graph from the frequency distribution—or as a frequency polygon—a line graph that replaces the bars with single points and connects the points with a line. With a very large number of data points, the frequency polygon approaches a smooth curve. Frequency polygons are shown in Figure 6.1.
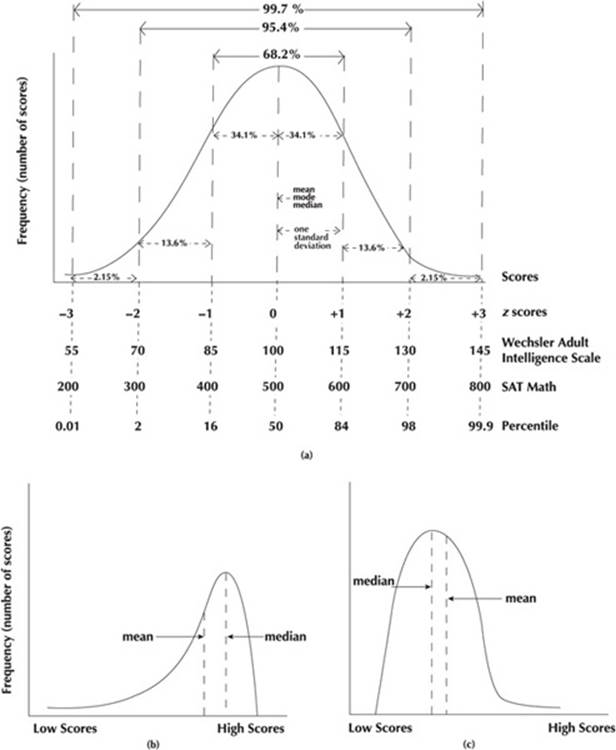
Figure 6.1 (a) The normal distribution or bell curve. (b) Negatively skewed distribution—skewed to the left. (c) Positively skewed distribution—skewed to the right.
Measures of Central Tendency
Measures of central tendency describe the average or most typical scores for a set of research data or distribution. Measures of central tendency include the mode, median, and mean. The mode is the most frequently occurring score in a set of research data. If two scores appear most frequently, the distribution is bimodal; if three or more scores appear most frequently, the distribution is multimodal. The median is the middle score when the set of data is ordered by size. For an odd number of scores, the median is the middle one. For an even number of scores, the median lies halfway between the two middle scores. The mean is the arithmetic average of the set of scores. The mean is determined by adding up all of the scores and then dividing by the number of scores. For the set of quiz scores 5, 6, 7, 7, 7, 8, 8, 9, 9, 10; the mode is 7; the median is 7.5; the mean is 7.6. The mode is the least used measure of central tendency, but can be useful to provide a “quick and dirty” measure of central tendency especially when the set of data has not been ordered. The mean is generally the preferred measure of central tendency because it takes into account the information in all of the data points; however, it is very sensitive to extremes. The mean is pulled in the direction of extreme data points. The advantage of the median is that it is less sensitive to extremes, but it doesn’t take into account all of the information in the data points. The mean, mode, and median turn out to be the same score in symmetrical distributions. The two sides of the frequency polygon are mirror images as shown in Figure 6.1a. The normal distribution or normal curve is a symmetric, bell-shaped curve that represents data about how many human characteristics are dispersed in the population. Distributions where most of the scores are squeezed into one end are skewed. A few of the scores stretch out away from the group like a tail. The skew is named for the direction of the tail. Figure 6.1b pictures a negatively skewed distribution, and Figure 6.1c shows a positively skewed distribution. The mean is pulled in the direction of the tails, so the mean is lower than the median in a negatively skewed distribution, and higher than the median in a positively skewed distribution. In very skewed distributions, the median is a better measure of central tendency than the mean.
Measures of Variability
Variability describes the spread or dispersion of scores for a set of research data or distribution. Measures of variability include the range, variance, and standard deviation. The range is the largest score minus the smallest score. It is a rough measure of dispersion. For the same set of quiz scores (5, 6, 7, 7, 7, 8, 8, 9, 9, 10), the range is 5. Variance and standard deviation (SD) indicate the degree to which scores differ from each other and vary around the mean value for the set. Variance and standard deviation indicate both how much scores group together and how dispersed they are. Variance is determined by computing the difference between each value and the mean, squaring the difference between each value and the mean (to eliminate negative signs), summing the squared differences and then taking the average of the sum of squared differences. The standard deviation of the distribution is the square root of the variance. For a different set of quiz scores (6, 7, 8, 8, 8, 8, 8, 8, 9, 10), the variance is 1 and the SD is 1. Standard deviation must fall between 0 and half the value of the range. If the standard deviation approaches 0, scores are very similar to each other and very close to the mean. If the standard deviation approaches half the value of the range, scores vary greatly from the mean. Frequency polygons with the same mean and the same range, but a different standard deviation, that are plotted on the same axes show a difference in variability by their shapes. The taller and narrower frequency polygon shows less variability and has a lower standard deviation than the short and wider one.
Since you don’t bring a calculator to the exam, you won’t be required to figure out variance or standard deviation.
Correlation
Scores can be reported in different ways. One example is the standard score or z score. Standard scores enable psychologists to compare scores that are initially on different scales. For example, a z score of 1 for an IQ test might equal 115, while a z score of 1 for the SAT in mathematics might equal 600. The mean score of a distribution has a standard score of zero. A score that is one standard deviation above the mean has a z score of 1. A standard score is computed by subtracting the mean raw score of the distribution from the raw score of interest and then dividing the difference by the standard deviation of the distribution of raw scores. Another type of score, the percentile score, indicates the percentage of scores at or below a particular score. Thus, if you score at the 90th percentile, 90% of the scores are the same or below yours. Percentile scores vary from 1 to 99.
A statistical measure of the degree of relatedness or association between two sets of data, X and Y, is called the correlation coefficient. The correlation coefficient (r) varies from –1 to +1. One indicates a perfect relationship between the two sets of data. If the correlation coefficient is –1, that perfect relationship is indirect or inverse; as one variable increases, the other variable decreases. If the correlation coefficient (r) is +1, that perfect relationship is direct; as one variable increases the other variable increases, and as one variable decreases, the other variable decreases. A correlation coefficient (r) of 0 indicates no relationship at all between the two variables. As the correlation coefficient approaches +1 or –1, the relationship between variables gets stronger. Correlation coefficients are useful because they enable psychologists to make predictions about Y when they know the value of X and the correlation coefficient. For example, if r = .9 for scores of students in an AP Biology class and for the same students in AP Psychology class, a student who earns an A in biology probably earns an A in psychology, whereas a student who earns a D in biology probably earns a D in psychology. If r = .1 for scores of students in an English class and scores of the same students in AP Calculus class, knowing the English grade doesn’t help predict the AP Calculus grade.
Correlation does not imply causation. Correlation indicates only that there is a relationship between variables, not how the relationship came about.
The strength and direction of correlations can be illustrated graphically in scattergrams or scatterplots in which paired X and Y scores for each subject are plotted as single points on a graph. The slope of a line that best fits the pattern of points suggests the degree and direction of the relationship between the two variables. The slope of the line for a perfect positive correlation is r = +1, as shown in Figure 6.2a. The slope of the line for a perfect negative correlation is r = –1, as shown in Figure 6.2b. Where dots are scattered all over the plot and no appropriate line can be drawn, r = 0 as shown in Figure 6.2c, which indicates no relationship between the two sets of data.
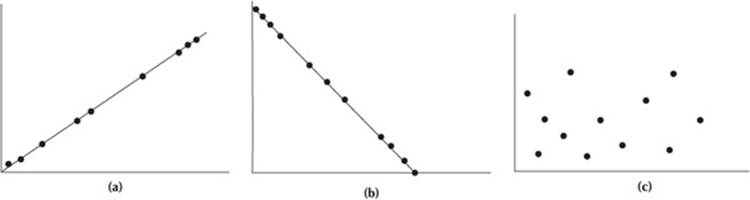
Figure 6.2 (a) Scattergram for perfect positive correlation (r = +1.0). (b) Scattergram for perfect negative correlation (r = –1.0). (c) Scattergram for no relationship between two sets of data (r = 0).
Inferential Statistics
Inferential statistics are used to interpret data and draw conclusions. They tell psychologists whether or not they can generalize from the chosen sample to the whole population, if the sample actually represents the population. Inferential statistics use rules to evaluate the probability that a correlation or a difference between groups reflects a real relationship and not just the operation of chance factors on the particular sample that was chosen for study. Statistical significance (p) is a measure of the likelihood that the difference between groups results from a real difference between the two groups rather than from chance alone. Results are likely to be statistically significant when there is a large difference between the means of the two frequency distributions, when their standard deviations (SD) are small, and when the samples are large. Some psychologists consider that results are significantly different only if the results have less than a 1 in 20 probability of being caused by chance (p < .05). Others consider that results are significantly different only if the results have less than a 1 in 100 probability of being caused by chance (p < .01). The lower the p value, the less likely the results were due to chance. Results of research that are statistically significant may be practically important or trivial. Statistical significance does not imply that findings are really important. Meta-analysis provides a way of statistically combining the results of individual research studies to reach an overall conclusion. Scientific conclusions are always tentative and open to change should better data come along. Good psychological research gives us an opportunity to learn the truth.
Ethical Guidelines
Whether involved in research or practice, psychologists need to act responsibly and morally. Studies conducted by Harry Harlow involving rhesus monkeys separated from their mothers and subjected to frightening conditions, studies by Phil Zimbardo involving students role-playing prisoners and guards, and studies conducted by Stanley Milgram in which participants believed they were delivering painful electric shocks to another person were highly publicized in the 1960s and 1970s. Following Milgram’s experiments, members of the American Psychological Association strengthened their ethical guidelines regarding research design, implementation, and practice; and other groups adopted similar guidelines. The guidelines prevent unnecessary deception and pain to humans and other animals, and they protect confidentiality.
All public and most private institutions have Institutional Review Boards (IRB) that must approve of all research conducted within their institutions. Boards specifically protect participants by requiring researchers to obtain signed informed consent agreements from all participants. These statements describe procedures, risks, benefits, and the right of the participant not to participate or to withdraw from the research study without penalty at any time. Research participants cannot be deceived about significant aspects that would affect their willingness to participate. After the participant finishes his or her part or research is completed, participants are debriefed about the research (i.e., the nature, results, and conclusions of the research are revealed).
Psychologists who conduct research involving other animals must treat them humanely; acquire, care for, use, and dispose of animals properly; and they must make efforts to minimize their discomfort, infection, illness, and pain.
![]() Review Questions
Review Questions
Directions: For each question, choose the letter of the choice that best completes the statement or answers the question.
1. Organized sets of concepts that explain phenomena are
(A) independent variables
(B) dependent variables
(C) hypotheses
(D) theories
(E) statistics
Refer to the following and your knowledge of psychology to answer questions 2 and 3:
Students will be able to read a statement printed in the Comic Sans font faster than the same statement written in the Lucida Calligraphy font.
2. This statement is a(n)
(A) hypothesis
(B) theory
(C) replication
(D) operational definition
(E) correlation
3. The dependent variable in an experiment based on the statement would be
(A) the statement written in the Comic Sans font
(B) the statement written in the Lucida Calligraphy font
(C) the length of time it takes students to read the statements
(D) the students who read the statements written in the Comic Sans font
(E) the number of students who participate in the experiment
4. A quasi-experiment cannot be considered a controlled experiment because
(A) subjects cannot be randomly selected
(B) subjects cannot be randomly assigned
(C) experimenter bias is unavoidable
(D) demand characteristics are unavoidable
(E) too few subjects participate in the procedure
Refer to the following and your knowledge of psychology to answer questions 5 and 6:
When subjects in the experimental group put a puzzle piece in the wrong place, the experimenter unconsciously winced. The experimenter did not wince when subjects in the control group put a piece in the wrong place.
5. The wincing of the experimenter must be eliminated because it is
(A) fraudulent
(B) a demand characteristic
(C) a placebo effect
(D) a confabulation
(E) a confounding variable
6. One method to eliminate the wincing of the experimenter is by instituting
(A) the experimenter expectancy effect
(B) the single-blind procedure
(C) the double-blind procedure
(D) the placebo effect
(E) counterbalancing
7. Of the following, which research method is most effective for studying unusually complex or rare phenomena?
(A) controlled experiment
(B) quasi-experiment
(C) test
(D) survey
(E) case study
8. Of the following, which research method would be most appropriate for investigating the relationship between political party membership and attitude toward the death penalty?
(A) controlled experiment
(B) quasi-experiment
(C) test
(D) survey
(E) case study
9. Of the following, the strongest positive correlation would most likely be shown between
(A) an adult’s weight and running speed
(B) close friendships and happiness
(C) sense of humor and years of education
(D) poverty and good health
(E) visual acuity and salary
10. John wants to study the effects of alcohol on the behavior of college students. For his study, he spends 5 hours every night for 2 weeks at a bar near a college watching how the patrons act before and after drinking alcoholic beverages. The research method John is employing is a
(A) controlled experiment
(B) quasi-experiment
(C) test
(D) naturalistic observation
(E) case study
11. Of the following, which can establish a cause and effect relationship?
I. controlled experiment
II. quasi-experiment
III. correlational research
(A) I only
(B) II only
(C) I and II only
(D) I and III only
(E) I, II, and III
Refer to the following and your knowledge of psychology to answer questions 12–14:
Ms. Costas owns a business with nine other employees. Ms. Costas’s annual salary is $90,000. Her manager’s salary is $60,000. Of her other employees, three earn $25,000 each and five earn $15,000 each.
12. The range of this distribution is
(A) $ 75,000
(B) $ 50,000
(C) $ 25,000
(D) $ 20,000
(E) $ 15,000
13. For this distribution, the mean is
(A) lower than both the median and the mode
(B) lower than the median, but higher than the mode
(C) lower than the mode, but higher than the median
(D) higher than both the median and the mode
(E) the same as the median
14. The frequency polygon for this distribution resembles a
(A) normal curve
(B) positively skewed line graph
(C) negatively skewed line graph
(D) bar graph
(E) scatterplot
![]() Answers and Explanations
Answers and Explanations
1. D—This is the definition of theory.
2. A—A hypothesis predicts how two or more factors are related. This statement relates the appearance of a font with the speed at which it can be read.
3. C—The dependent variable in an experiment is the factor that is measured. In this experiment, the type of font is the factor the experimenter is manipulating or the independent variable. The speed at which it is read is the factor that is measured or the dependent variable.
4. B—Quasi-experiments deal with groups that have preexisting differences, such as males and females, young and old, etc. Since the study is examining differences associated with those preexisting differences, participants are assigned on the basis of sex, age, etc. Thus, random assignment is not possible.
5. E—The wincing behavior of the experimenter is an unintentional difference between the treatment of the experimental group and the treatment of the control group. An additional difference between the experimental and control groups is a confounding variable. If the wincing is deliberate, then it is considered dishonest, possibly even fraudulent.
6. C—The double-blind procedure, in which neither the experimenter nor the subjects know who is in the experimental group and who is in the control group, would probably eliminate the wincing behavior. A single-blind procedure in which only the subjects do not know in which treatment group they have been placed would not affect the experimenter’s behavior.
7. E—An in-depth examination, usually over an extended period of time, characterizes the case study method.
8. D—Correlational research examines the relationship between two variables. Questionnaires or interviews that ask questions about political party membership and attitude toward the death penalty distributed to a large representative sample of the population could gather appropriate data for the study. Questionnaires and interviews are kinds of surveys.
9. B—People who have close friendships tend to be happy. Lonely people tend to be unhappy. The presence of close friendships predicts happiness. An adult’s weight and running speed (A), sense of humor and years of education (C), and visual acuity and salary (E) are unrelated pairs of factors. Impoverished people are less likely to be healthy than people who have more money, so (D) indicates an inverse relationship or negative correlation.
10. D—He is gathering information in the field about typical behavior of people without manipulating any variables, which characterizes naturalistic observation.
11. A—Only controlled experiments can establish cause and effect relationships.
12. A—The range is $90,000 to $15,000, or $75,000. To find the range, deduct the lowest score from the highest score.
13. D—The mean is determined by adding all of the scores and then dividing by the number of scores. $300,000 ÷ 10 = $30,000. The median is the middle score in the ordered distribution. Since there is an even number of scores in the distribution, the median is halfway between the 5th and 6th scores, or $20,000. The most frequent score or mode is $15,000, so the mean is higher than both the median and the mode.
14. B—A frequency polygon is a line graph. A positively skewed distribution has scores clustered toward the low end of the range and a small number of unusually high scores. If you draw the graph with the value of scores on the Xaxis and the frequency of scores on the Y axis, you can see that the tail is on the right or more positive side of the graph.
![]() Rapid Review
Rapid Review
Theories—organized sets of concepts that explain phenomena.
Hypothesis—prediction of how two or more factors are likely to be related.
Replication—repetition of the methods used in a previous experiment to see whether the same methods will yield the same results.
Independent variable (IV)—the factor the researcher manipulates in a controlled experiment (the cause).
Dependent variable (DV)—the behavior or mental process that is measured in an experiment or quasi-experiment (the effect).
Population—all of the individuals in the group to which the study applies.
Sample—the subgroup of the population that participates in the study.
Random selection—choosing of members of a population so that every individual has an equal chance of being chosen to participate in a study.
Experimental group—the subgroup of the sample that receives the treatment or independent variable.
Control group—the comparison group; the subgroup of the sample that is similar to the experimental group in every way except for the presence of the independent variable.
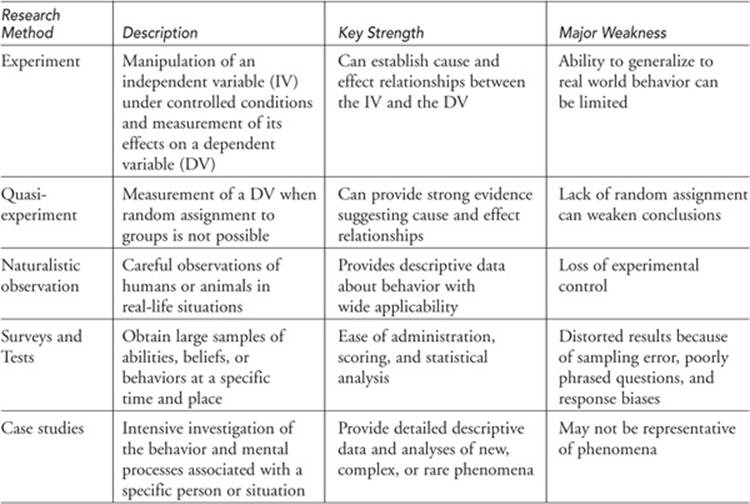
Table 6.1 Overview of Research Methods
Random assignment—division of the sample into groups so that every individual has an equal chance of being put in any group or condition.
Confounding variables—factors that cause differences between the experimental group and the control group other than the independent variable.
Operational definition—a description of the specific procedure used to determine the presence of a variable.
Experimenter bias—a phenomenon that occurs when a researcher’s expectations or preferences about the outcome of a study influence the results obtained.
Demand characteristics—clues participants discover about the purpose of the study that suggest how they should respond.
Single-blind procedure—research design in which participants don’t know whether they are in the experimental or control group.
Double-blind procedure—research design in which neither the experimenter nor the participants know who is in the experimental group and who is in the control group.
Placebo—a physical or psychological treatment given to the control group that resembles the treatment given to the experimental group, but that contains no active ingredient.
Placebo effect—a response to the belief that the independent variable will have an effect, rather than the actual effect of the independent variable, which can be a confounding variable.
Reliability—consistency or repeatability of results.
Validity—the extent to which an instrument measures or predicts what it is supposed to measure or predict.
Statistics—a field that involves the analysis of numerical data about representative samples of populations.
Descriptive statistics—numbers that summarize a set of research data obtained from a sample. Key concepts of descriptive statistics include:
• Frequency distribution—an orderly arrangement of scores indicating the frequency of each score or group of scores.
• Central tendency—average or most typical scores of a set of research data or distribution. mode—most frequently occurring score in a set of research data (“quick and dirty”). median—the middle score when a set of data is ordered by size. mean—the arithmetic average of a set of scores.
• Variability—the spread or dispersion of a set of research data or distribution. Range—the difference between the largest score and the smallest score (“quick and dirty”).
• Standard deviation (SD)—measures the average difference between each score and the mean of the data set.
• Normal distribution—bell-shaped curve that represents data about how lots of human characteristics are dispersed in the population.
• Percentile score—the percentage of scores at or below a particular score (from 1 to 99).
• Correlation coefficient (r)—a statistical measure of the degree of relatedness or association between two sets of data that ranges from –1 to +1.
Inferential statistics—statistics that are used to interpret data and draw conclusions.
Statistical significance (p)—the condition that exists when the probability that the observed findings are due to chance is less than 1 in 20 (p < .05) according to some psychologists, or less than 1 in 100 (p < .01) according to those with more stringent standards.
Ethical guidelines—suggested rules for acting responsibly and morally when conducting research or in clinical practice.