1,296 ACT Practice Questions, 3rd Edition (2013)
ACT Practice Test 3
4. SCIENCE REASONING TEST
35 Minutes—40 Questions
DIRECTIONS: There are seven passages in the following section. Each passage is followed by several questions. After reading a passage, choose the best answer to each question and blacken the corresponding oval on your answer document. You may refer to the passages as often as necessary.
You are NOT permitted to use a calculator on this test.
Passage I
In the solar system, solid planets and moons are made up of different layers, which have different compositions. The Earth’s moon is surrounded by an outer crust, which is visible to observers on Earth. Beneath this crust is a solid lithosphere. Beneath the lithosphere is another layer called the asthenosphere. This layer is thought to have high temperatures, so the structure of this layer is said to be plastic, or easily changed. The innermost region of the moon is called the core, and it is thought to contain iron.
A solar eclipse occurs when the moon travels directly between the Earth and the Sun, temporarily blocking the transmission of sunlight to the Earth and creating a shadow. Most solar eclipses are partial, because the moon does not always travel entirely within the path of the sunlight. However, complete solar eclipses are possible because the moon and the Sun have approximately the same diameter from the perspective of a viewer on the Earth. An observer on the Earth would view the sky as occupying 180 degrees. Of this entire distance, the moon takes up 0.54 degrees while the Sun takes up 0.52 degrees. Since the Sun appears to take up a smaller section of the sky, the Sun’s rays can be blocked from traveling to the Earth during a complete solar eclipse (see Figure 1).
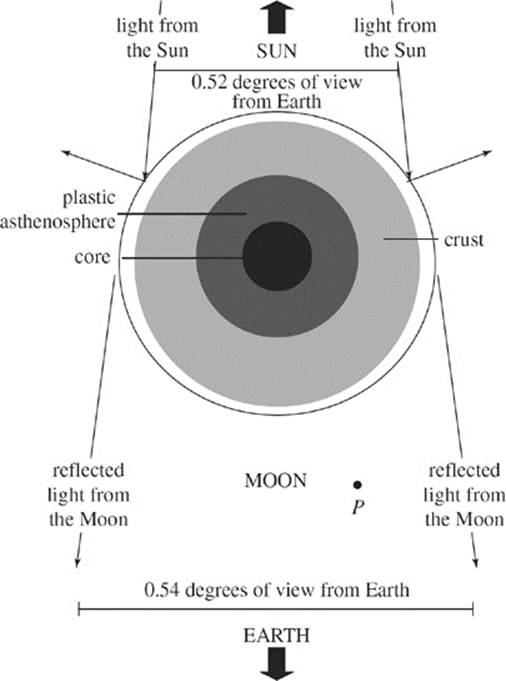
Figure 1
The gravitational force exerted on the Earth by the moon, and by the Sun to a lesser extent, results in water tides, which are the changes in the level of the Earth’s ocean surface. Figure 2 shows data collected by a tidal station on the western coast of the United States, showing the change in the ocean water level over a 60-hour period. During this period, the highest water level was 6 feet above mean sea level, while the lowest water level was 1 foot below mean sea level (represented by “−1” feet).
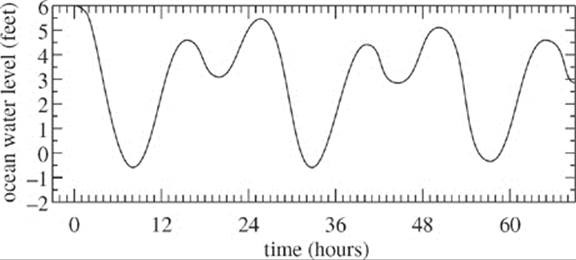
Figure 2
The highest and lowest ocean surface levels change over the course of a year. Figure 3 shows the change in the highest and lowest water levels measured by the same tidal station over a year.
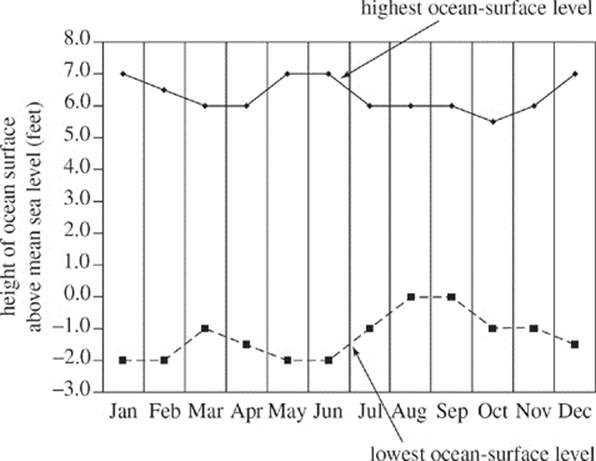
Figure 3
1. Figure 1 shows that a lunar orbiter at point P would be able to view which of the following?
A. The moon only
B. The Sun only
C. The moon and the Earth only
D. The moon, the Sun, and the Earth
2. According to Figure 1, when the Sun’s rays encounter the surface of the moon during a solar eclipse, the rays most likely:
F. stop transmitting forward and do not continue to the Earth’s surface.
G. enter the plastic asthenosphere and are absorbed.
H. reflect off the surface of the moon, and then continue to the Earth.
J. transmit unobstructed to the Earth’s surface.
3. Based on Figure 2, for a given set of consecutive days, the time elapsed between the maximum values of the highest ocean-surface levels would most nearly be:
A. 12 hours.
B. 24 hours.
C. 48 hours.
D. 60 hours.
4. Based on the information provided in Figure 3, during what month was the data in Figure 2 most likely collected?
F. January
G. March
H. June
J. December
5. According to Figure 2, which of the following statements best describes the ocean surface level between t = 0 hours and t = 12 hours?
A. The ocean surface level rises continuously during that entire time.
B. The ocean surface level falls continuously during that entire time.
C. The ocean surface level rises and then falls during that time.
D. The ocean surface level falls and then rises during that time.
Passage II
Approximately 45,000 to 35,000 years ago, Lake Brussia straddled the boundary between modern Smith and Union counties. The lake was believed to have been formed as a result of seismic activity in the region. As seen in Figure 1, the cities of Middleton, West Union, and Basalt Valley rest over the sediment of the ancient lake. In order to test this hypothesis, a study examining the strata of the region was conducted using radioactive dating. Inconsistencies in the age of the rock layers indicate the presence of a fault in the region.
Radioactive dating is a technique which utilizes the amount of radiation exhibited by a distinct isotope within a sample to approximate its age. Uranium-235 is an isotope commonly found in varying types of strata with a half-life of approximately 700 million years. The half-life of an isotope is the time it takes for half of the isotope to decompose. 1,000-m core samples were acquired from three sites between the modern cities of Middleton and West Union as seen in Figure 2. Figure 3 shows the results of the Uranium-235 assays for each of the three sites. The age of the rock is determined using a ratio of the Uranium content in the sample to that of newly formed rock.
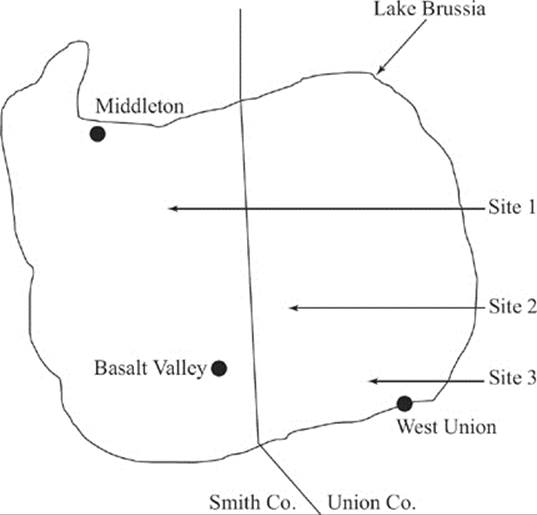
Figure 1
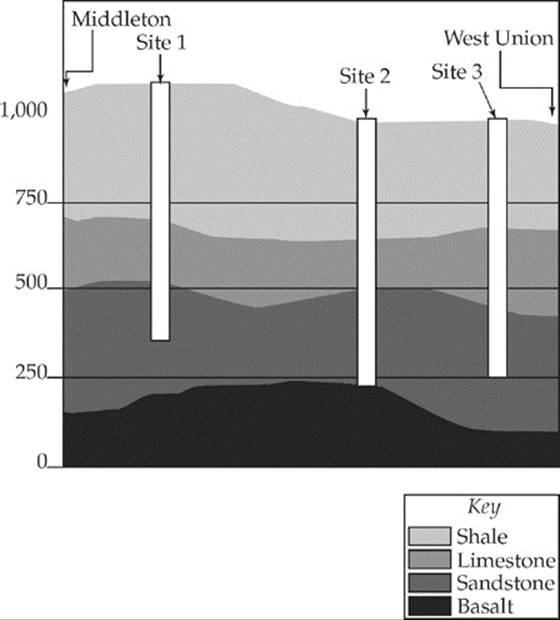
Figure 2
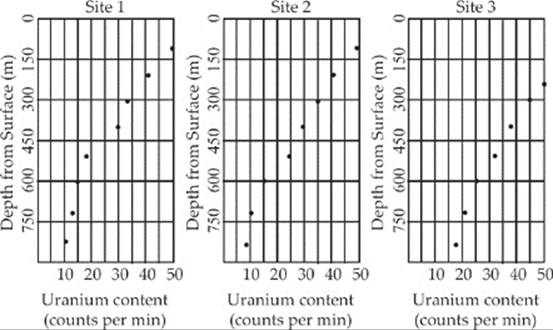
Figure 3
![]()
6. According to Figure 2, the shale layer was thickest at which of the following cities or sites?
F. Middleton
G. Site 1
H. Site 3
J. West Union
7. According to Figure 2, as the thickness of shale decreases between Sites 2 and 3, the thickness of limestone residing below:
A. increases.
B. decreases.
C. first decreases then increases.
D. remains constant.
8. Based on Figure 2, which of the following graphs best displays the thickness of the shale layer at Sites 1, 2, and 3?
F. 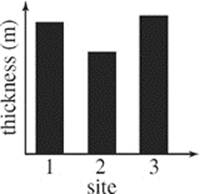
H. 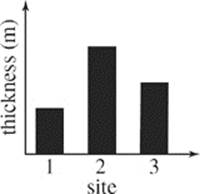
G. 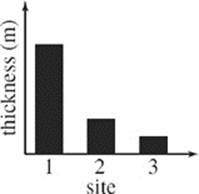
J. 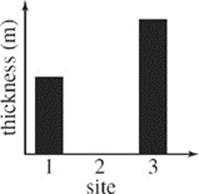
9. According to Figure 3, at Sites 1, 2, and 3 the highest number of counts of Uranium-235 detected were recorded at a depth of:
A. less than 300 m below the surface.
B. between 300 and 450 m below the surface.
C. between 450 and 600 m below the surface.
D. greater than 600 m below the surface.
10. The uranium recorded in Sites 1, 2, and 3 is reduced by ½ roughly every 0.7 billion years. Based on Figure 3, and assuming no alteration of this uranium decay, the age of the rock with the greatest depth surveyed at Site 2 is closest to:
F. 2.8 billion years old.
G. 5.6 billion years old.
H. 280 million years old.
J. 560 million years old.
Passage III
For a science fair, a middle school student tested the hypothesis that bubbles in liquids would affect how far a water gun could shoot. To do this, she set up a holding device so that the water gun would always shoot at the same angle (the angle of inclination) and from the same place. She then measured the horizontal distance from the holding device to the furthest observable trace of liquid (see Figure 1).

Figure 1
The angle of inclination was 30° in all experiments. The same metal water gun was used in Experiments 1 and 2.
Experiment 1
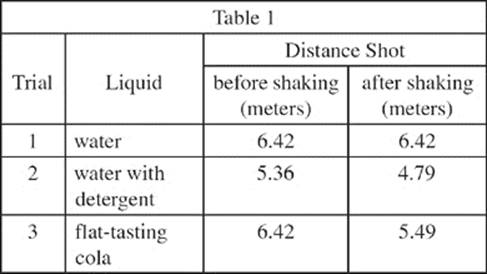
The student filled the metallic water canister of a water gun to 80% of its capacity with water from her tap (water with no bubbles in it) and measured how far from the holding device the water gun shot. Then, she again filled the canister to 80% of its capacity with tap water, shook the water gun, and immediately measured how far it shot. She repeated these tests with water mixed with laundry detergent, which contained many bubbles, and a flat-tasting cola beverage that showed no visible bubbles. Table 1 shows the results of these trials.
Experiment 2
Next, the student filled the water gun canister to 80% of its capacity with the flat-tasting cola, shook it to create bubbles and then let it sit, undisturbed. When 10 minutes had elapsed, she tested how far the water gun shot the cola, before and after shaking it (Trial 4). She then let it sit undisturbed for an hour before again testing how far it shot before and after shaking it (Trial 5). Table 2 shows the results of these trials.

Experiment 3
For the third experiment, the student used an old-fashioned, plastic water gun, with transparent walls and the water container in the handle of the water gun. The student added the flat-tasting cola to fill the water container to 80% of its capacity, shot the water gun, and observed that no bubbles formed upon shooting. She then shook the water gun, which caused bubbles to form. After 10 minutes, there were still some visible bubbles in the cola; however, after an hour had passed, there were no visible bubbles.
11. In Experiment 3, what is the most likely reason the student chose to use an old-fashioned plastic water gun rather than a metal water gun? Compared to the metal water gun, the plastic water gun:
A. exhibited different effects of bubbles on shooting distance.
B. did not shoot as far as the metal gun.
C. allowed the student to view the bubbles in the liquid.
D. was easier to fit into the holding device.
12. Based on the results of Experiments 1 and 2, in which of the following two trials, before shaking the water gun, were the distances shot the same?
F. Trials 1 and 4
G. Trials 2 and 3
H. Trials 3 and 4
J. Trials 3 and 5
13. In Experiment 2, a result of shaking the water gun containing the flat-tasting cola was that the:
A. density of the liquid increased.
B. bubbles in the liquid disappeared.
C. distance the liquid was shot increased.
D. distance the liquid was shot decreased.
14. In Trial 5, is it likely that bubbles were present in large numbers in the cola immediately before the can was shaken?
F. Yes; based on the results of Experiment 1, the bubbles generated in Trial 4 probably lasted for less than 10 minutes.
G. Yes; based on the results of Experiment 1, the bubbles generated in Trial 4 probably lasted for more than 1 hour.
H. No; based on the results of Experiment 3, the bubbles generated in Trial 4 probably lasted for less than 1 hour.
J. No; based on the results of Experiment 3, the bubbles generated in Trial 4 probably lasted for more than 2 hours.
15. Suppose that in Experiment 2, the student had decided to measure the distance the water gun shot the cola one hour after finishing Trial 5 without shaking the water gun again. Based on the observations made in Trials 4 and 5, the horizontal distance the cola was shot would most likely have been:
A. less than 5.49 meters.
B. between 5.49 and 5.51 meters.
C. between 5.52 and 5.98 meters.
D. greater than 5.98 meters.
16. Based on the results of Trials 3−5, if the student filled the metal water gun to 80% of its capacity with the flat-tasting cola and shook it, the time it would take for the bubbles in the cola to disappear to the point that they would have no effect on the distance of the shot would most likely have been:
F. greater than 1 hour.
G. between 10 minutes and 1 hour.
H. between 3 minutes and 9 minutes.
J. less than 3 minutes.
Passage IV
An ecological study measured the reflection of light by different algae types and water samples. The study found that a water sample’s reflectance of light is determined by the density of algae in it. As the density of algae in a water sample increases, the water sample’s reflectance of light became more similar to the pure algae’s reflectance of light.
Table 1 lists the wavelength range of the visible spectrum and the wavelength ranges of the colors of the visible spectrum.
|
Table 1 |
|
|
Color |
Wavelength (nm) |
|
Violet |
380−430 |
|
Blue |
430−500 |
|
Green |
500−565 |
|
Yellow |
565−585 |
|
Orange |
585−630 |
|
Red |
630−750 |
Figure 1 shows the relative reflectance of light by pure samples of water and three types of algae versus the wavelength of light from 350 nm to 750 nm.
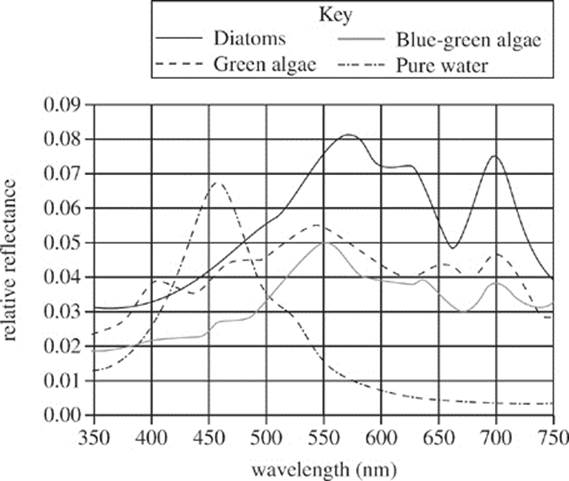
Figure 2 shows the relative reflectance light of a sample of lake water versus the wavelength of light from 350 nm to 750 nm.
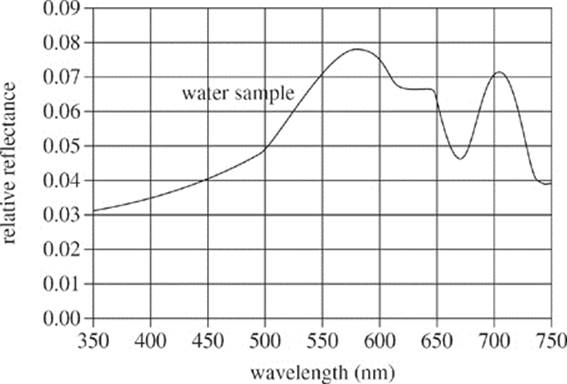
Figure 2
17. Based on Table 1 and Figure 1, which color of light is most reflected by blue-green algae?
A. Violet
B. Yellow
C. Red
D. Green
18. Autotrophic organisms, such as blue-green algae, absorb wavelengths using the molecule chlorophyll. Chlorophyll is typically associated with which of the following chemical reactions?
F. Binary fission
G. Condensation
H. Photosynthesis
J. Respiration
19. According to Figure 1, at which of the following wavelengths does the amount of light reflected by green algae exceed the amount of light reflected by diatoms?
A. 400 nm
B. 520 nm
C. 670 nm
D. 710 nm
20. Green algae is classified in which kingdom of organisms?
F. Animalia
G. Plantae
H. Fungi
J. Protista
21. Based on Figures 1 and 2, what type of algae has the greatest density in the lake water sample?
A. Blue-green algae
B. Diatoms
C. Green algae
D. No algae are in the water sample.
Passage V
Oceanographers conducted a series of experiments with water to explore the relationship between temperature, salinity (% salt by mass), and density (mass per unit volume).
Experiment 1
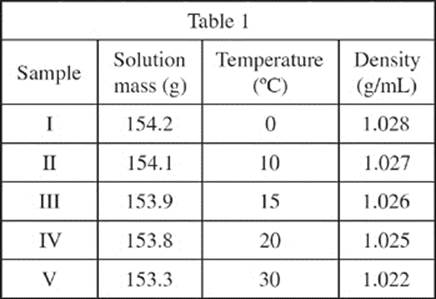
In a beaker, 35 g of NaCl and 965 g of distilled H2O were mixed, and the solution was brought to a specific temperature. A graduated cylinder was then used to measure 150 mL of the solution. The mass of this 150-mL sample was measured with an electronic balance and the density (g/mL) was calculated. This procedure was repeated for 5 different temperatures with the results recorded in Table 1.
Experiment 2
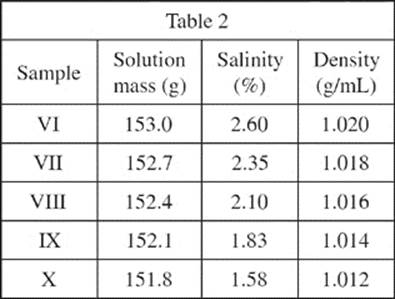
A graduated cylinder was placed on an electronic balance and a certain mass of NaCl was added. Distilled water at 10°C was added to make a 150 mL solution, and the total mass of this was noted. The density (g/mL) and salinity (%) of the solution were calculated. This procedure was repeated for 5 different quantities of NaCl with the results recorded in Table 2.
Experiment 3
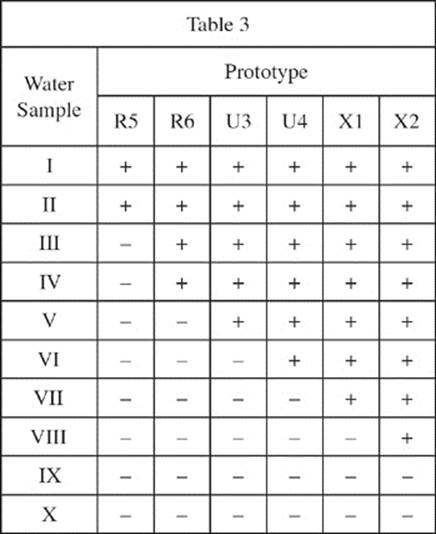
Water samples from Experiments 1 and 2 were used individually to fill a test pool. For each sample, multiple prototypes of a newly designed instrument were placed in the pool. If a prototype stayed afloat, it was marked with a (+). If a protoype sank, it was marked with a (–). These data were then collected and recorded in Table 3.
22. In Experiment 1, if an additional sample were brought to 40°C and a density of 1.018 g/mL, what would its expected mass be in the graduated cylinder?
F. 150.9 g
G. 151.8 g
H. 152.7 g
J. 153.6 g
23. Based on Table 2, what is the most likely density of water at 10°C and 2.50% salinity?
A. 1.019
B. 1.017
C. 1.013
D. 1.010
24. An engineer states that prototype U3 is better suited than X2 for water surface data collection in a 10°C and 2.35% salinity environment. Do the results of the experiments support this claim?
F. Yes, because prototype U3 will sink and X2 will float in these water conditions.
G. Yes, because prototype U3 will float and X2 will sink in these water conditions.
H. No, because prototype U3 will sink and X2 will float in these water conditions.
J. No, because prototype U3 will float and X2 will sink in these water conditions.
25. A new prototype is tested in water samples IV through VII in a manner similar to Experiment 3. Which of the following results would NOT be possible?
|
Water Sample |
||||
|
IV |
V |
VI |
VII |
|
|
A. |
– |
– |
– |
– |
|
B. |
+ |
+ |
+ |
+ |
|
C. |
+ |
+ |
– |
– |
|
D. |
– |
– |
+ |
+ |
26. In Experiment 1, samples were transferred to a graduated cylinder to obtain a more accurate and precise measurement of the:
F. mass of the NaCl added to the H2O.
G. salinity after it reached the designated temperature.
H. volume used to calculate the density.
J. temperature used to determine the final salinity.
27. In a later analysis, the density of prototype U3 is manually determined. Which of the following values would be consistent with the results of Experiments 1 through 3?
A. 1.021 g/mL
B. 1.023 g/mL
C. 1.026 g/mL
D. 1.028 g/mL
Passage VI
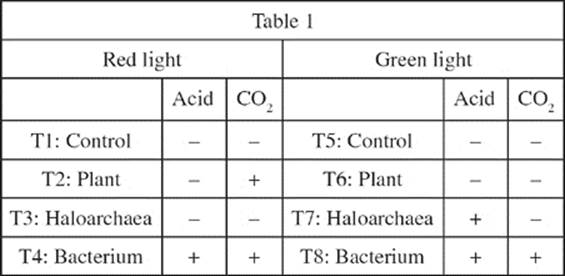
Haloarchaea are single-celled microorganisms that can use light to generate energy, through a unique form of photosynthesis. To compare haloarchaeal photosynthesis with plant photosynthesis and bacterial fermentation, researchers performed two experiments in which they exposed plant haloarchaeal and bacterial cells to either red or green light. The researchers measured the growth of these cells by measuring how much acid and CO2 were produced; more production of these indicated more growth.
Experiment 1
Water containing salt and sucrose was added to eight large test tubes. Next, phenolphthalein (a pH indicator that is colorless in the presence of acid and has a pink color in its absence) was added to each large test tube. A smaller test tube was then added, inverted, into each large test tube to collect CO2; if CO2 had been produced, a gas bubble would appear in this smaller tube (see Figure 1).
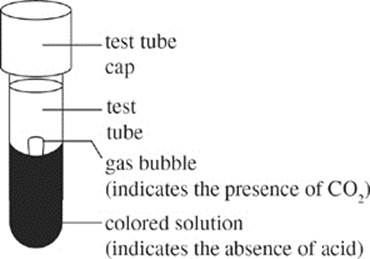
Figure 1
The large test tubes were capped, heated until the solutions were sterile, and then cooled. Nothing was added to the first test tube (T1). Cells of the plant Rosa carolina were added to the second test tube (T2), cells of the haloarchaea NRC-1 were added to the third test tube (T3), and cells of the bacterium Bacillus anthracis were added to the fourth test tube (T4). These four test tubes were exposed to red light, and incubated at 37°C for 48 hr. Then, the procedure was repeated with exposure to green light, using the four remaining test tubes: T5 (no cells), T6 (plant cells), T7 (haloarchaeal cells), and T8 (bacterial cells). In Table 1, + means presence and – means absence.
Experiment 2
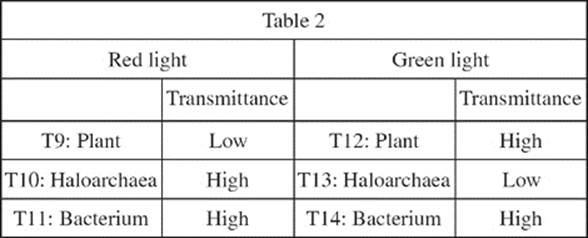
Some of the cells tested in Experiment 1 are thought to contain pigments that help them absorb light. To determine whether these cells absorbed light to generate energy, cells of the same species are exposed to red and green light in new test tubes. The researchers measure the transmittance, or the amount of light that transmits through the test tube. If the transmittance is low, then the cells in the test tube are assumed to contain pigments that absorb most of the light to generate energy. If the transmittance is high, then the cells are assumed to contain no pigment that could absorb light and generate energy. Instead, most of the light passes through the test tube.
28. In Experiment 1, which cell types grew in the presence of green light?
F. Plant cells only
G. Plant and bacterial cells only
H. Plant and haloarchaeal cells only
J. Haloarchaeal and bacterial cells only
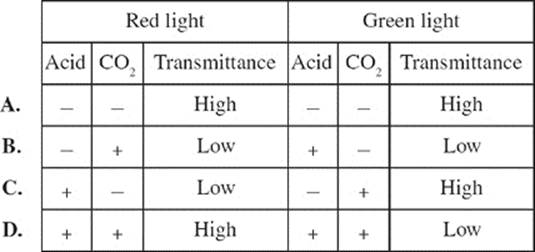
29. Suppose that plant cells and haloarchaeal cells that are situated close to each other do not interfere with each other’s absorption of light and generation of energy. If a new test tube containing both plant and haloarchaeal cells were prepared, what would be the most likely results for Experiments 1 and 2?
30. Suppose that a scientist isolates a cell type that is one of the four cell types used in Experiment 1. She finds that this cell type produces CO2 in the presence of red light. She then tests the cell type in the presence of green light and finds that neither CO2 nor acid is produced. Based on the results of Experiment 1, the cell type is most likely the:
F. control with nothing added.
G. plant Rosa carolina.
H. haloarchea NRC-1.
J. bacterium Bacillus anthracis.
31. What is the evidence from Experiments 1 and 2 that haloarchaea require green light to generate energy?
A. In the presence of red light, haloarchaea show low transmittance of light and produce acid.
B. In the presence of red light, haloarchaea show high transmittance of light and produce no acid.
C. In the presence of green light, haloarchaea show low transmittance of light and produce acid.
D. In the presence of green light, haloarchaea show high transmittance of light and produce no acid.
32. Which of the following best illustrates the results of Experiment 1 for the plant Rosa carolina in red light?
F. 
H. 
G. 
J. 
33. Do the results of Experiment 1 support the hypothesis that haloarchaea and bacteria use similar processes to generate energy?
A. Yes, because both haloarchaea and bacteria produce CO2 in the presence of green light.
B. Yes, because both haloarchaea and bacteria produce CO2 in the presence of red light.
C. No, because haloarchaea produce only acid in the presence of green light, while bacteria produce acid and CO2 in both red and green light.
D. No, because neither haloarchaea nor bacteria produce CO2 in the presence of either red or green light.
Passage VII
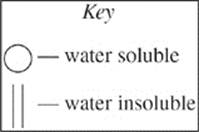
For most of the 20th century, scientists recognized two basic domains of living organisms, prokaryotes and eukaryotes. The presence of nuclei and other membrane-bound organelles within the cell primarily distinguished eukaryotes from prokaryotes. The possibility of revising this dichotomy resulted from the discovery of the Archaea, organisms with unique cell membrane and ribosomal RNA (rRNA) structure. Cell membranes are composed of phospholipids that have both water-insoluble and water-soluble subunits. Ribosomes are made of protein and rRNA and build new proteins within the cell.
Two scientists in the 1990s debate whether organisms should be classified into two or three domains.
2-Domain Hypothesis
The Archaea are prokaryotes because they lack intracellular membrane-bound organelles. Although they are found in extreme and unusual environments, the gross structure and life cycle of the Archaea are similar to prokaryotic bacteria. Like bacteria, their cells are usually surrounded by a cell wall, and they reproduce asexually through binary fission.
The structural and metabolic characteristics that are unique to the Archaea are not significantly different from other prokaryotes to warrant their separation into a third domain. Although the Archaea were distinguished very early on in the diversification of life, today they remain appropriately defined by the original definition of prokaryote.
3-Domain Hypothesis
The Archaea are a distinct form of life requiring a revision of the previously held dichotomy of prokaryote and eukaryote. Eukaryota should remain the same, but prokaryotes should be split into Archaea and Bacteria because of significant differences in genetics, structure, and metabolism.
Archaea as a domain is justified by detailed analysis. The genetic sequence of rRNA in the Archaea is so distinct from prokaryotes and eukaryotes that these groups of organisms likely diverged over 3 billion years ago. Archaea cell membranes contain more rigid ether linkages instead of the ester linkages found in eukaryotes and bacteria. This contributes to their survival in harsh environments. Finally, the Archaea are capable of exploiting a wider range of energy sources compared to eukaryotes and bacteria.
34. Which of the following statements is most consistent with the 3-Domain Hypothesis? The time, in millions of years ago, when two groups of organisms diverge on the evolutionary tree increases as the:
F. similarities between rRNA gene sequences increases.
G. differences between rRNA gene sequences increases.
H. number of ester linkages in the cell membrane increases.
J. number of ether linkages in the cell membrane decreases.
35. By referring to the observation that the newly discovered organisms do not have membrane-bound organelles, the scientist supporting the 2-Domain Hypothesis implies that these new organisms do not have which of the following structures?
A. Phospholipids
B. Ribosomes
C. rRNA
D. Nuclei
36. According to the passage, a similarity between eukaryotes and prokaryotes is that both groups of organisms:
F. have ester linkages in their membranes.
G. contain membrane-bound organelles.
H. reproduce sexually.
J. are composed of cells.
37. According to the scientist who supports the 2-Domain Hypothesis, which of the following is the strongest argument against using a 3-Domain classification?
A. rRNA does not exist in prokaryotes.
B. Ether linkages are found in the cell membranes of the Archaea.
C. The Archaea meet the primary definition of prokaryotic.
D. The Archaea synthesize proteins in the cell cytoplasm.
38. It is shown that the Archaea have protein synthesis structures and mechanisms more like eukaryotes than prokaryotes. This observation contradicts arguments stated in which hypothesis?
F. The 2-Domain Hypothesis, because the discovery would show that the new organisms and bacteria fundamentally differ in cellular metabolism.
G. The 2-Domain Hypothesis, because the discovery would show that the new organisms and eukaryotes fundamentally differ in cellular metabolism.
H. The 3-Domain Hypothesis, because the discovery would show that the new organisms and bacteria fundamentally differ in cellular metabolism.
J. The 3-Domain Hypothesis, because the discovery would show that the new organisms and eukaryotes fundamentally differ in cellular metabolism.
39. The scientist who supports the 3-Domain Hypothesis implies that the 2-Domain Hypothesis is weakened by which observation?
A. The Archaea have membrane-bound organelles.
B. Microscopes cannot accurately describe organisms.
C. The Archaea lack ester linkages in their cell membranes.
D. Eukaryotes are not related to the Archaea.
40. Which of the following illustrations of a portion of a phospholipid cell membrane is consistent with the description in the passage?
F. 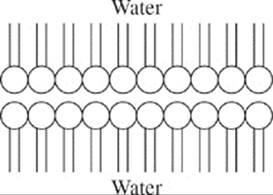
G. 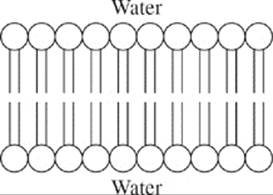
H. 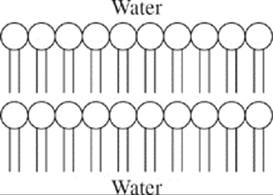
J. 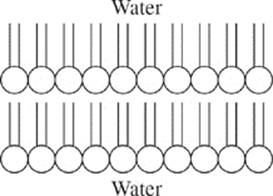
END OF TEST 4
STOP! DO NOT RETURN TO ANY OTHER TEST.