1,296 ACT Practice Questions, 3rd Edition (2013)
ACT Practice Test 1
4. SCIENCE REASONING TEST
35 Minutes—40 Questions
DIRECTIONS: There are seven passages in the following section. Each passage is followed by several questions. After reading a passage, choose the best answer to each question and blacken the corresponding oval on your answer sheet. You may refer to the passages as often as necessary.
You are NOT permitted to use a calculator on this test.
Passage I
A group of students studied the frictional forces involved on stationary objects.
In a series of experiments, the students used rectangular shaped objects of various materials that all had identical masses. One end of a plastic board coated with a polymer film was fastened to a table surface by a hinge so the angle θ between the board and table could be changed, as shown in Figure 1.
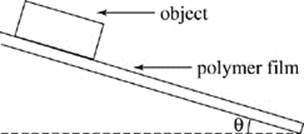
Objects were placed on the opposite end of the board, and the angle θ at which the object started to slide was recorded. The tangent of this angle represents the coefficient of static friction between the object and the polymer surface. This coefficient is proportional to the force required to move a stationary object. Higher coefficients mean that greater forces of friction must be overcome to initiate movement.
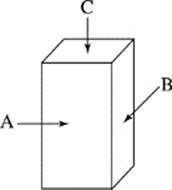
The dimensions of the objects gave them 3 distinct faces of unequal area as shown in Figure 2. Unless otherwise stated, the objects were placed on the ramp with Face A down.
Experiment 1
Four objects made of different materials were placed on the ramp at a temperature of 25°C. The ramp was gradually raised and as soon as the object started to move, the angle θ of the ramp was recorded in Table 1.
|
Table 1 |
|
|
Object material |
θ (degrees) |
|
Granite |
12.1 |
|
Copper |
16.8 |
|
Wood |
22.0 |
|
Brick |
31.1 |
Experiment 2
The procedure for Experiment 1 was repeated with the wooden object, varying which face was placed down on the ramp. Results were recorded in Table 2.
|
Table 2 |
|
|
Face |
θ (degrees) |
|
A |
22.0 |
|
B |
22.0 |
|
C |
22.0 |
Experiment 3
The procedure for Experiment 1 was repeated with the wooden object, varying the temperature of the polymer ramp. Results for 5 temperatures were recorded in Table 3.
|
Table 3 |
|
|
Temperature (°C) |
θ (degrees) |
|
0 |
18.5 |
|
25 |
22.0 |
|
50 |
25.4 |
|
75 |
29.0 |
|
100 |
32.5 |
Experiment 4
The procedure for Experiment 1 was repeated with multiple wooden objects. For each trial, the objects were stacked on top of each other before raising the ramp. The angle θ where the stack started to slide was recorded in Table 4.
|
Table 4 |
|
|
Number of objects |
θ (degrees) |
|
2 |
22.0 |
|
3 |
22.0 |
|
4 |
22.0 |
1. If the procedure used in Experiment 3 had been repeated at a temperature of 62.5°C, the angle required for the object to start moving down the ramp most likely would have been closest to which of the following?
A. 27.2 degrees
B. 29.2 degrees
C. 30.3 degrees
D. 31.4 degrees
2. Suppose the students had placed the 4 objects used in Experiment 1 on the ramp when it was flat and pushed each of the objects, such that the amount of force applied to each object gradually increased until it moved. Based on the results of Experiment 1, the object made of which material would most likely have taken the greatest amount of force to start moving?
F. Brick
G. Wood
H. Copper
J. Granite
3. Based on the results of Experiments 1 and 4, what was the effect, if any, of the weight of the object on the coefficient of static friction?
A. The coefficient of static friction always increased as the object’s weight increased.
B. The coefficient of static friction always decreased as the object’s weight increased.
C. The coefficient of static friction increased and then decreased as the object’s weight increased.
D. The coefficient of static friction was not affected by the weight of the object.
4. In Experiment 1, the reason the students used objects made of different materials was most likely to vary the amount of frictional force between the:
F. plastic board and the polymer surface.
G. various objects and the polymer surface.
H. objects made of different materials when brought into contact with each other.
J. stacked objects, so that the objects would not fall over when the angle of the ramp was raised high enough to cause motion.
5. Which of the following ranks the different types of objects used, in order, from the material that presented the greatest resistance to movement to the material that presented the least resistance to movement?
A. Granite, copper, wood, brick
B. Copper, wood, granite, brick
C. Granite, wood, brick, copper
D. Brick, wood, copper, granite
6. The main purpose of Experiment 3 was to determine the effects of temperature on which of the following variables?
F. Coefficient of static friction between wood and wood
G. Coefficient of static friction between wood and polymer
H. Mass of the wooden object
J. Total frictional force of the polymer on all objects placed on the ramp
Passage II
Despite a global campaign since 1988 to eradicate poliomyelitis (polio), the virus that causes this disease continues to be endemic in four countries. This polio virus, which can exist as Type 1, Type 2, or Type 3, is most often transmitted through water that is contaminated by human waste. People can be immunized from this virus with a highly effective vaccine, which can be administered orally or by injection. Recent analyses of polio virus transmission have focused on the four polio-endemic countries India, Pakistan, Afghanistan, and Nigeria.
Study 1
In 2004, a temporary ban on polio vaccines was instituted in Nigeria in response to concerns that they were contaminated. Researchers reviewed World Health Organization (WHO) records to determine the number of Type 1 polio virus infections that were reported in Nigeria in 2004 and tallied their findings by month (see Figure 1). The World Health Organization has noted that in polio-endemic countries, official records underestimate the number of people actually infected, because numerous infected individuals do not report their symptoms to clinics or rely on local therapists who are not surveyed. In a polio-endemic country, for every person who has reported an infection, as many as ten people may actually be infected in the local population.
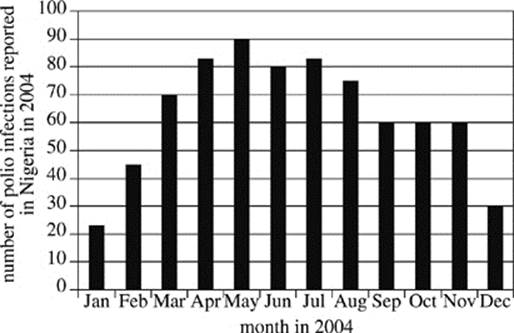
Figure 1
Study 2
Although polio eradication efforts have been most consistent in the urban areas of polio-endemic countries, these areas also have a high risk for a reemergence of polio, especially when the large urban populations are exposed to water contaminated with wastes that harbor the polio virus. In 2007, researchers analyzed the number of people who reported infections with Type 3 polio virus in the five largest cities in India. These cities were Mumbai in western India, New Delhi and Kolkata in northern India, and Chennai and Hyderabad in southern India. The analysis was undertaken in the months of June and August. June 2007 was chosen as a representative month for the dry summer season in India, during which there was minimal rainfall. August 2007 was chosen as a representative month for the wet monsoon season in India, during which there was daily rainfall. The results of the findings are shown in Figure 2.
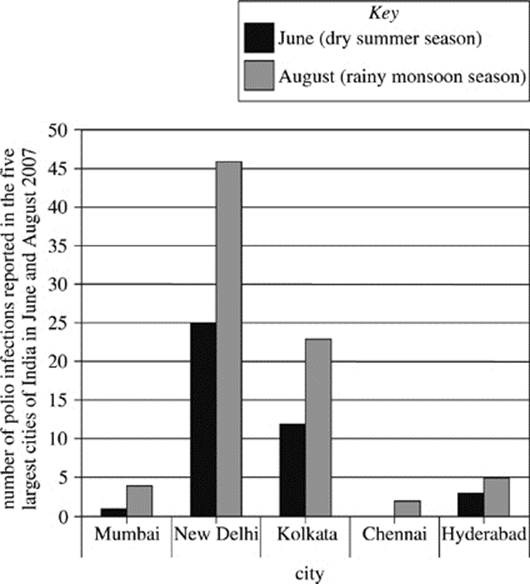
Figure 2
7. According to Figure 1, the greatest increase in the number of reported polio infections in Nigeria occurred between which two months?
A. January and February
B. February and March
C. April and May
D. November and December
8. It is estimated that for every person infected with the polio virus in an endemic country, there are 200 people at risk for contracting the virus. Given the results of Study 1, how many people would have been at risk for becoming infected with the polio virus in Nigeria in June 2004?
F. 80
G. 200
H. 800
J. 16,000
9. Given the information in Figure 2, which of the following might explain the difference in reported cases of polio in major Indian cities between June and August of 2007?
A. Water is more likely to become contaminated with polio-infected human waste in periods of high rainfall.
B. Water is less likely to become contaminated with polio-infected human waste in periods of high rainfall.
C. The polio virus infects more people in India during the summer and monsoon seasons than during the autumn and winter seasons.
D. Those diagnosed with the polio virus in June are able to recover by August.
10. Which of the following hypotheses was most likely tested in Study 2?
F. The number of reported cases of polio infections varies significantly between Nigeria and India.
G. Most cases of polio infections are not reported to medical authorities in India.
H. Poliomyelitis infections affect more people in certain regions in India than in other regions.
J. The number of reported cases of polio infections in India is greatest during the summer and least during the winter.
11. Polio-endemic countries are located in warm climates that harbor many mosquitoes. Would the presence of mosquitoes directly affect the transmission of the polio virus?
A. Yes, because the polio virus is primarily transmitted through mosquitoes.
B. Yes, because the polio virus is primarily transmitted through human waste.
C. No, because the polio virus is primarily transmitted through mosquitoes.
D. No, because the polio virus is primarily transmitted through human waste.
12. The comparison of reported polio infections in India in 2007, as shown in Figure 2, indicates that relative to the number of people in Kolkata infected with polio in June, the number of people infected with polio in Kolkata in August was approximately:
F. half as much.
G. the same.
H. twice as much.
J. ten times as much.
Passage III
Osmotic pressure (Π) is the amount of pressure, in atm, required to maintain equilibrium of a solvent across a semipermeable membrane. At a constant temperature, osmotic pressure is dependent only on a solute’s ability to dissociate or ionize in the solvent (van ’t Hoff factor, i) and the concentration of solute particles. The osmotic pressure is determined by the equation:
![]()
M represents the concentration (in molarity, M), R is the ideal gas constant (0.0821 L atm mol−1 K−1), and T (300 K) is the temperature in Kelvin (K). The value of R is assumed to be a constant for all osmotic pressure calculations.
The dissociation of a solute depends on its unique chemical properties. The van ’t Hoff factors for some common substances are displayed in Table 1. Higher van ’t Hoff factors correlate with greater dissociation or ionization. The effect of the van ’t Hoff factor on the osmotic pressure may be seen in Figure 1.
|
Table 1 |
|
|
Substance |
van ’t Hoff factor * |
|
sucrose |
1.0 |
|
NaCl |
1.9 |
|
MgCl2 |
2.7 |
|
FeCl3 |
3.4 |
|
*Values at 300 K |
|
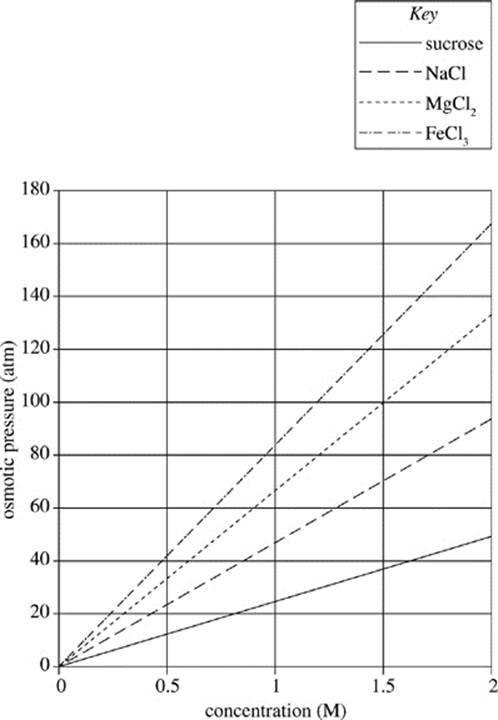
Figure 1
13. According to Figure 1, which of the following solutions would exhibit the least osmotic pressure?
A. 1.0 M FeCl3 solution
B. 1.0 M MgCl2 solution
C. 2.0 M NaCl solution
D. 2.0 M sucrose solution
14. If 1.0 M solutions of various solutes were prepared, which of the following solutions would have the highest level of ionization?
F. Sucrose
G. NaCl
H. MgCl2
J. FeCl3
15. Which of the following solutions would exhibit the closest osmotic pressure to that of a 1.5 M NaCl solution at 300 K, if the gas constant is 0.0821 L atm/ mol−1 K−1?
A. 1.0 M NaCl solution (i = 1.9)
B. 2.0 M NaCl solution (i = 1.9)
C. 2.9 M Sucrose solution (i = 1.0)
D. 3.5 M Sucrose solution (i = 1.0)
16. Based on Figure 1, as the concentration of solute decreases, the pressure required to hold solvent concentration across a membrane at equilibrium will:
F. increase only.
G. decrease only.
H. remain constant.
J. increase, then remain constant.
17. A scientist recently discovered a compound that ionizes readily in solution (i = 3.8) and results in low osmotic pressures. Are the findings of this scientist consistent with Figure 1?
A. Yes, because FeCl3 causes higher osmotic pressure than sucrose.
B. No, because sucrose causes higher osmotic pressure than FeCl3.
C. Yes, because FeCl3 causes lower osmotic pressure than sucrose.
D. No, because sucrose causes lower osmotic pressure than FeCl3.
Passage IV
Soil salinity is the concentration of potentially harmful salts dissolved in the groundwater that fills soil pores. Salinity is determined by measuring a soil’s electrical conductivity (EC) and exchangeable sodium percentage (ESP). High EC indicates a high concentration of dissolved salt particles; ESP indicates the proportion of electrical conductivity that is due to dissolved sodium ions.
Soil samples were collected from five different distances west of a particular river. Figure 1 shows the electrical conductivity of the soil samples at four different depth ranges measured in milli-Siemens per centimeter (mS/cm).
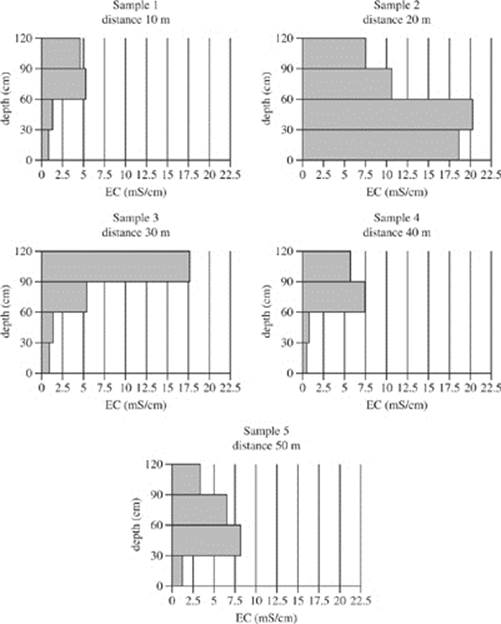
Figure 1
Figure 2 shows the exchangeable sodium percentage of the five sites at different depths.
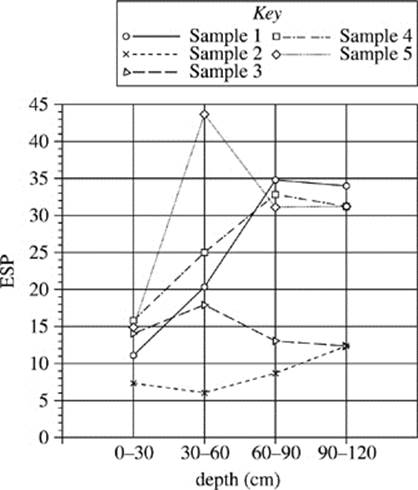
Figure 2
18. Figure 2 indicates that, compared with the soil tested in Sample 1, the soil tested in Sample 4 contains:
F. a higher percentage of sodium ions throughout.
G. a lower percentage of sodium ions throughout.
H. a higher percentage of sodium ions at shallower depths only.
J. a lower percentage of sodium ions at shallower depths only.
19. According to Figure 2, in the soil collected in Sample 3 at a depth of 30−60 cm, approximately what percent of the soil conductivity is due to sodium ions?
A. 14%
B. 17%
C. 24%
D. 44%
20. Based on Figures 1 and 2, the electrical conductivity due to sodium ions in the sample collected 40 m west of the river was:
F. greatest at a depth of 90−120 cm.
G. greatest at a depth of 0−30 cm.
H. least at a depth of 30−60 cm.
J. least at a depth of 0−30 cm.
21. Based on Figure 2, which of the following figures best represents the exchangeable sodium percentage for the five soil samples collected at a depth of 90−120 cm?
A. 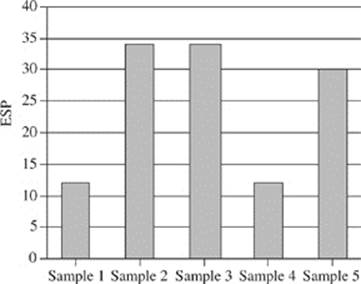
B. 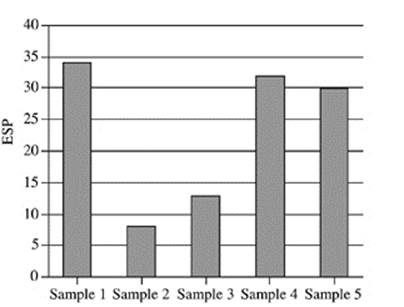
C. 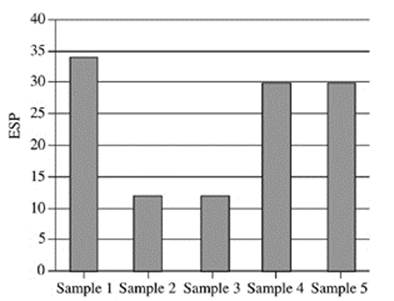
D. 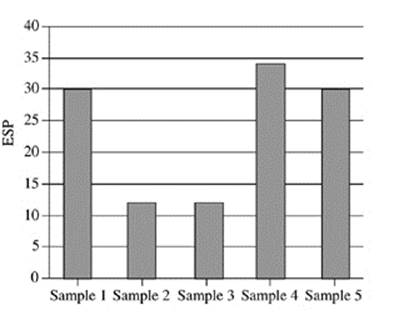
22. A student claimed that as soil moves away from a major water source, such as a river, the salinity of the soil increases. Is this claim supported by Figures 1 and 2?
F. No; the electrical conductivity and exchangeable sodium percentage both decreased from Sample 1 to Sample 5.
G. No; there was no consistent trend for electrical conductivity and exchangeable sodium percentage.
H. Yes; the electrical conductivity and exchangeable sodium percentage both increased from Sample 1 to Sample 5.
J. Yes; the electrical conductivity increased and exchangeable sodium percentage decreased from Sample 1 to Sample 5.
Passage V
A group of researchers performed the following study in order to investigate declines in primarily carnivorous polar bear populations in the Arctic over a 10-year period.
Study
The researchers obtained previously collected data from several areas previously identified as polar bear habitats. From this data, the researchers selected sixty 5 km × 5 km blocks that do not overlap with one another. The blocks were selected to fall into six groups, each with a different set of conditions selected in order to conform to criteria for listing animals as threatened species. Previous research has indicated that Arctic sea ice and available food are among the factors which may affect polar bear populations.
Table 1 identifies each of the groups utilized in the study. Conditions other than the ones listed were considered to be normal.
|
Table 1 |
|
|
Group |
Conditions |
|
1 |
These areas had significantly decreased populations of marine mammals consumed by polar bears. |
|
2 |
These areas had significantly increased populations of seaweed commonly consumed by marine mammals. |
|
3 |
These areas had been subject to excess thawing of Arctic sea ice. |
|
4 |
These areas were subject to the same conditions as Groups 1 and 3. |
|
5 |
These areas were subject to the same conditions as Groups 2 and 3. |
|
6 |
Unaffected polar bear habitat. |
Data for each of the plots was collected, and the population density of polar bears was calculated in terms of adult polar bears/km2. Table 2 shows the population density of the blocks in Group 6.
|
Table 2 |
|
|
Area Label |
Population density of Group 6 areas (polar bears/km2) |
|
A |
0.93 |
|
B |
2.10 |
|
C |
0.21 |
|
D |
0.72 |
|
E |
0.88 |
|
F |
0.72 |
|
G |
0.91 |
|
H |
0.53 |
|
I |
1.12 |
|
J |
0.74 |
The data collected was analyzed to find the average population density ratio for each group. The researchers defined the average population density ratio of a given group as being equal to the result of the following expression:
![]()
Figure 1 shows the average population density ratio of Groups 1−5.
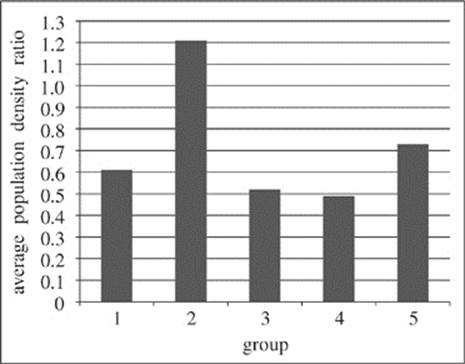
Figure 1
23. Which of the following statements provides the best explanation for why the researchers collected data for Group 6 in their study?
A. Group 6 provided data indicating the types of predators which most threaten polar bears in their natural habitat.
B. Group 6 provided a standard by which the other groups could be compared in order to determine how each set of conditions affected polar bear populations.
C. Group 6 provided a means by which the researchers could carefully identify and select the conditions for the remaining five groups.
D. Group 6 provided a means of determining the greatest number of polar bears that would be likely to survive in an area of 25 km2.
24. Which one of the following is a question that most likely explains why Group 2 areas were included in the study?
F. Does an increase in the food source of their prey affect the population density of polar bears?
G. If additional masses of seaweed were to be introduced to the Arctic, would polar bears be increasingly omnivorous?
H. If additional masses of seaweed were to be introduced to the Arctic, would prey population density increase?
J. Does an increase in the number of prey animals living in the same area as polar bears affect the amount of Arctic ice?
25. Which of the following correctly ranks Groups 1−5 from the group where the conditions are most conducive to polar bear population density in the study to the group where the conditions are least conducive?
A. Group 1, Group 2, Group 3, Group 4, Group 5
B. Group 4, Group 3, Group 1, Group 5, Group 2
C. Group 2, Group 5, Group 1, Group 3, Group 4
D. Group 2, Group 1, Group 5, Group 3, Group 4
26. Which of the following is most likely an organism that the researchers identified as exhibiting a significantly decreased population when defining Group 1?
F. Snowy owl
G. Seal
H. Salmon
J. Polar bear
27. Synergy between two effects is said to exist when their combined effect is greater than the sum of each effect considered separately. The study appears to be designed such that the researchers can investigate possible synergy in which of the following two groups?
A. Groups 1 and 2
B. Groups 1 and 4
C. Groups 4 and 5
D. Groups 1 and 3
28. Before performing their analysis of the data, the researchers developed four different hypotheses. Each one of the four hypotheses below is supported by the results of the study EXCEPT:
F. Declining prey populations have had some effect on polar bear populations.
G. The melting of Arctic sea ice has a greater effect on polar bear populations than declining prey populations.
H. Declining prey populations have a greater effect on polar bear populations than the melting of Arctic sea ice.
J. The melting of Arctic sea ice has had some effect on polar bear populations.
Passage VI
Methane (CH4) is an important energy source and a powerful greenhouse gas. CH4 levels in the atmosphere are increasing, largely as a result of increasing livestock populations and energy emissions. Two scientists debate possible consequences of rising levels of atmospheric methane.
Scientist 1
Increasing CH4 levels are a serious concern because, in the atmosphere, CH4 can be converted into formaldehyde (H2CO). H2CO is a dangerous chemical, banned in some countries and used as an embalming fluid in others.
When ozone (O3) is struck by solar radiation (light) in the presence of water, hydroxyl radicals (·OH) are created (Reaction 1):
light + O3 + H2O → 2·OH + O2
When OH comes into contact with CH4, another radical, ·CH3, is formed (Reaction 2):
OH + CH4 → ·CH3 + H2O
In the presence of oxygen (O2) and nitric oxide (NO), the highly reactive ·CH3 is converted into H2CO (Reaction 3):
·CH3 + NO + 2O2 → H2CO + NO2 + HO2
The product HO2 is unstable and reacts with NO, yielding more ·OH (Reaction 4):
HO2 + NO → NO2 + ·OH
Together, Reactions 2−4 are called a chain reaction because the OH formed in Reaction 4 can react with another CH4 molecule in Reaction 2:
·OH + CH4 → ·CH3 + H2O
·CH3 + NO + 2O2 → H2CO + NO2 + HO2
HO2 + NO → NO2 + ·OH
As a result, one ·OH can convert a great deal of CH4. At current CH4 levels, this chain reaction is the primary fate of atmospheric ·OH, making the formation of H2CO an urgent concern.
Scientist 2
H2CO is a dangerous chemical, but atmospheric formaldehyde levels will not increase dramatically due to methane emissions. Carbon monoxide (CO) generation may be the greater concern. Hydroxyl radicals can break down methane, leading to the formation of H2CO and nitric oxide, as in Reactions 1−4; in the presence of light, however, H2CO quickly decomposes to CO and hydrogen, H2 (Reaction 5):
H2CO → H2 + CO
Furthermore, the OH generated by Reactions 1 and 4 will react rapidly with any H2CO in the atmosphere to produce CO and water: (Reaction 6)
H2CO + 2·OH → CO + 2H2O
In addition to reducing the amount of H2CO by breaking down the H2CO molecule, this reaction removes OH from the atmosphere, inhibiting the chain reaction of Reactions 2−4.
29. Which of the following substances do the two scientists agree must be present in order for ·CH3 to be generated by atmospheric methane?
A. H3O+
B. NO2
C. HNO3
D. O3
30. Which of the following graphs reflects Scientist 1’s hypothesis of how levels of H2CO in the atmosphere will change as more CH4 is released into the atmosphere?
F. 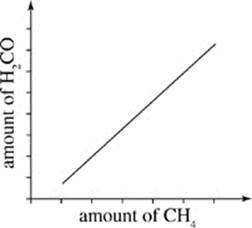
G. 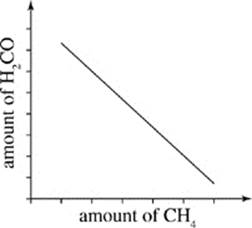
H. 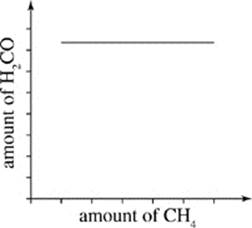
J. 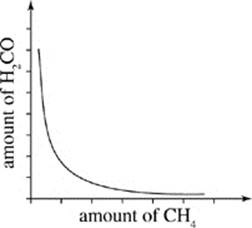
31. A student suggested that the molecular mass of either product in Reaction 5 would be greater than the molecular mass of the reactant in Reaction 5. Is he correct?
A. No; H2CO is composed not of molecules, but of atoms.
B. Yes; the mass of a molecule of H2CO is greater than the mass of either reactant.
C. No; the mass of a molecule of H2CO is greater than the mass of either product.
D. Yes; the mass of a molecule of CO is greater than the mass of a molecule of H2.
32. In certain parts of the atmosphere, the amount of O3 is decreasing. As O3 levels decrease, which of the following would Scientist 1 most strongly agree with regarding the levels of ·CH3 and H2CO in the atmosphere?
F. The amount of ·CH3 would increase and the amount of H2CO would decrease.
G. The amount of ·CH3 would decrease and the level of H2CO would remain constant.
H. The amounts of ·CH3 and H2CO would both decrease.
J. The amounts of ·CH3 and H2CO would both increase.
33. Of the following statements, with which would Scientist 2 most strongly disagree?
A. O3 is involved in the generation of H2CO in the atmosphere.
B. ·OH is contributing to the formation of carbon monoxide in the atmosphere.
C. Solar radiation contributes to the break down of CH4.
D. As CH4 emissions increase, levels of H2CO will rise dramatically.
34. After examining Scientist 1’s hypothesis, Scientist 2 claimed that Reaction 3 would lead to increased levels of carbon monoxide. By which of the following explanations would Scientist 2 most likely support this argument?
F. Reaction 3 reduces the amount of NO present, inhibiting Reaction 4.
G. Reaction 3 produces H2CO, which can react in Reaction 5 and Reaction 6.
H. Reaction 3 produces HO2, which can react with H2CO to produce CO.
J. Reaction 3 reduces the amount of O2 present, making it more difficult for CO to form.
35. Further investigation has shown that Reaction 6 occurs on a large scale. Which of the following statements explains how the new evidence most weakens the argument of Scientist 1?
A. The OH produced in Reaction 4 reacts with CH4.
B. The OH produced in Reaction 4 reacts with H2CO.
C. The H2O produced in Reaction 6 reacts with light and O3.
D. The OH produced in Reaction 6 reacts with H2CO.
Passage VII
A Carnot heat engine is an engine which runs by compressing and expanding a gas and transferring heat.
Figures 1 and 2 show the changes in pressure, P, and volume, V, that occur as two Carnot heat engines, A and B, run. For every gas, PV = ΩT, where Ω is a constant and T represents the time.
The cycle begins as the gas is at its highest temperature and pressure. First, the gas expands, so volume increases while pressure decreases. As the gas expands, it can do work, such as pushing a piston. After the gas has run out of thermal energy and can no longer do work it is at its lowest temperature and pressure and the gas begins to be compressed, for instance a piston falling back down on the gas. As the gas is compressed, pressure increases while volume decreases and temperature begins to rise. In every Carnot heat engine, the gas ends at the same pressure, temperature, and volume as it began, thus completing a cycle.
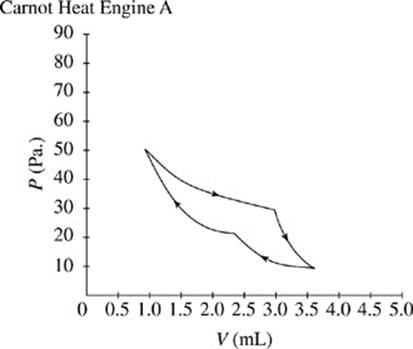
Figure 1
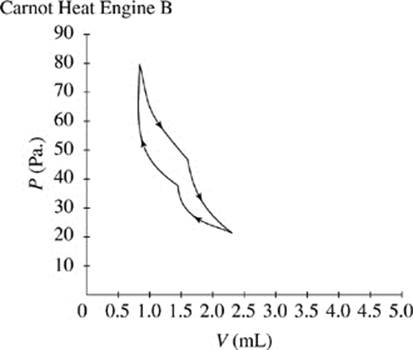
Figure 2
36. According to Figure 2, for Carnot heat engine B, when V was decreasing from its largest value and had a value of 1.5 mL, P had a value closest to:
F. 10 Pa.
G. 30 Pa.
H. 50 Pa.
J. 70 Pa.
37. For a new Carnot heat engine, F, a partial graph of V versus P is obtained.
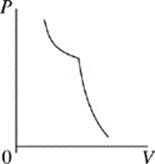
If Carnot heat engine F behaves like Carnot heat engines A and B, the remainder of the graph of V versus P for Carnot heat engine F will look most like which of the following?
A. 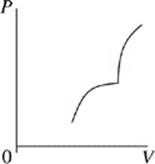
B. 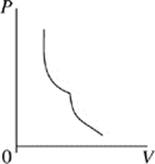
C. 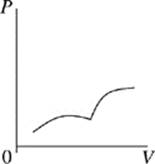
D. 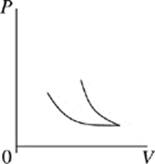
38. For Carnot heat engine A, the minimum value of P was obtained at a V closest to:
F. 0.5 mL.
G. 2.0 mL.
H. 3.5 mL.
J. 5.0 mL.
39. Consider the largest value of V and the smallest value of V on the graph in Figure 2. How are these values related?
A. The smallest value of V is −1 times the largest value of V.
B. The smallest value of V is 1/3 times the largest value of V.
C. The smallest value of V is 1 times the largest value of V.
D. The smallest value of V is 2 times the largest value of V.
40. The reversible isothermal expansion step of a Carnot heat engine cycle takes place when P is decreased from its highest value and V is increased from its lowest value. According to Figure 1, the reversible isothermal expansion step for Carnot heat engine A begins when V is closest to:
F. 1.0 mL.
G. 2.25 mL.
H. 3.0 mL.
J. 3.5 mL.
END OF TEST 4
STOP! DO NOT RETURN TO ANY OTHER TEST.