Biology Premium, 2024: 5 Practice Tests + Comprehensive Review + Online Practice - Wuerth M. 2023
UNIT 7 Natural Selection
20 Population Genetics
Learning Objectives
In this chapter, you will learn:
➜Population Genetics and Genetic Drift
➜Hardy-Weinberg Equilibrium
Overview
Evolution is driven by both random and nonrandom events. Mutations are random, but natural selection, which acts upon the phenotypes that result from those mutations, is not a random process. This chapter will review some of the processes that cause populations to evolve and some of the equations that can be used to describe changes in populations.
Population Genetics and Genetic Drift
Population genetics is the study of genetic variation within populations and the processes that can cause changes in allele frequencies within a population. The three major processes that drive changes in allele frequencies in a population are natural selection (which was discussed in Chapter 19), gene flow, and genetic drift.
Gene flow is the transfer of alleles from one population to another. Gene flow can be caused by the migration of individuals into a population. If these individuals carry different alleles than the receiving population, the allele frequency in the receiving population will change. In plants, gene flow can occur through the transfer of pollen (by wind or animals) into new plant populations.
Genetic drift is the random loss of alleles in a population. Genetic drift is more likely to occur in smaller populations. For example, assume an allele is found in 10% of a population. If there are 1,000 individuals in the population, 100 of those individuals would have that allele. It would be likely that at least one of those 100 individuals would survive and reproduce to pass on that allele to the next generation. Now consider a population of 10 individuals. In that small population, only one individual would have that allele. If that one individual failed to reproduce, that allele would not be passed on to the next generation and would be lost, thereby decreasing the genetic diversity of the population. Considerations around genetic drift are especially important to conservation biologists, who are trying to preserve the genetic diversity of endangered species.
Bottleneck Effect
One possible cause of genetic drift is the bottleneck effect. A population bottleneck occurs when the size of a population is greatly reduced for one or more generations. Natural disasters, like fires, floods, or volcanic eruptions, can cause population bottlenecks. Human-made events, such as overhunting or rapid habitat destruction, can also cause population bottlenecks. Because the population size is smaller after these bottlenecks, the surviving population is much less likely to possess all of the alleles the larger population had before the bottleneck and thus will likely have less genetic diversity. A model of the bottleneck effect is shown in Figure 20.1.
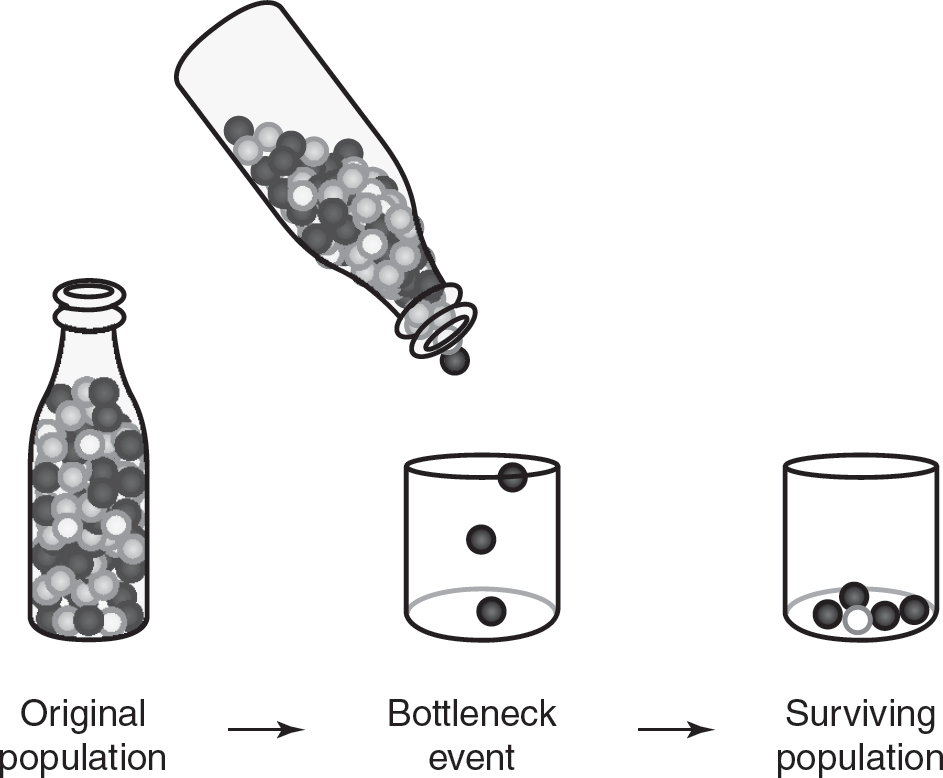
Figure 20.1 Model of the Bottleneck Effect
In Figure 20.1, each ball represents an allele in the population. In the original population, there are three different types of alleles, represented as black, gray, and white balls. When the population experienced a bottleneck event, none of the individuals that possessed the allele represented by the gray ball survived. Only two alleles, black and white, survived the bottleneck, reducing the genetic diversity of the surviving population.
The northern elephant seal population experienced a population bottleneck during the 1800s. By the 1890s, hunting had reduced the number of northern elephant seals to less than 30 individuals. Protection of this species in the 20th century resulted in an increase in their numbers, but they are not as diverse as the southern elephant seals, which were not subjected to intense hunting in the 1800s.
Founder Effect
Another cause of genetic drift is the founder effect. The founder effect occurs when a few members of a larger population start a new population. These few members of the larger population often have less genetic diversity compared to the larger population or may be a nonrandom sample of the larger population. A model of the founder effect is shown in Figure 20.2.
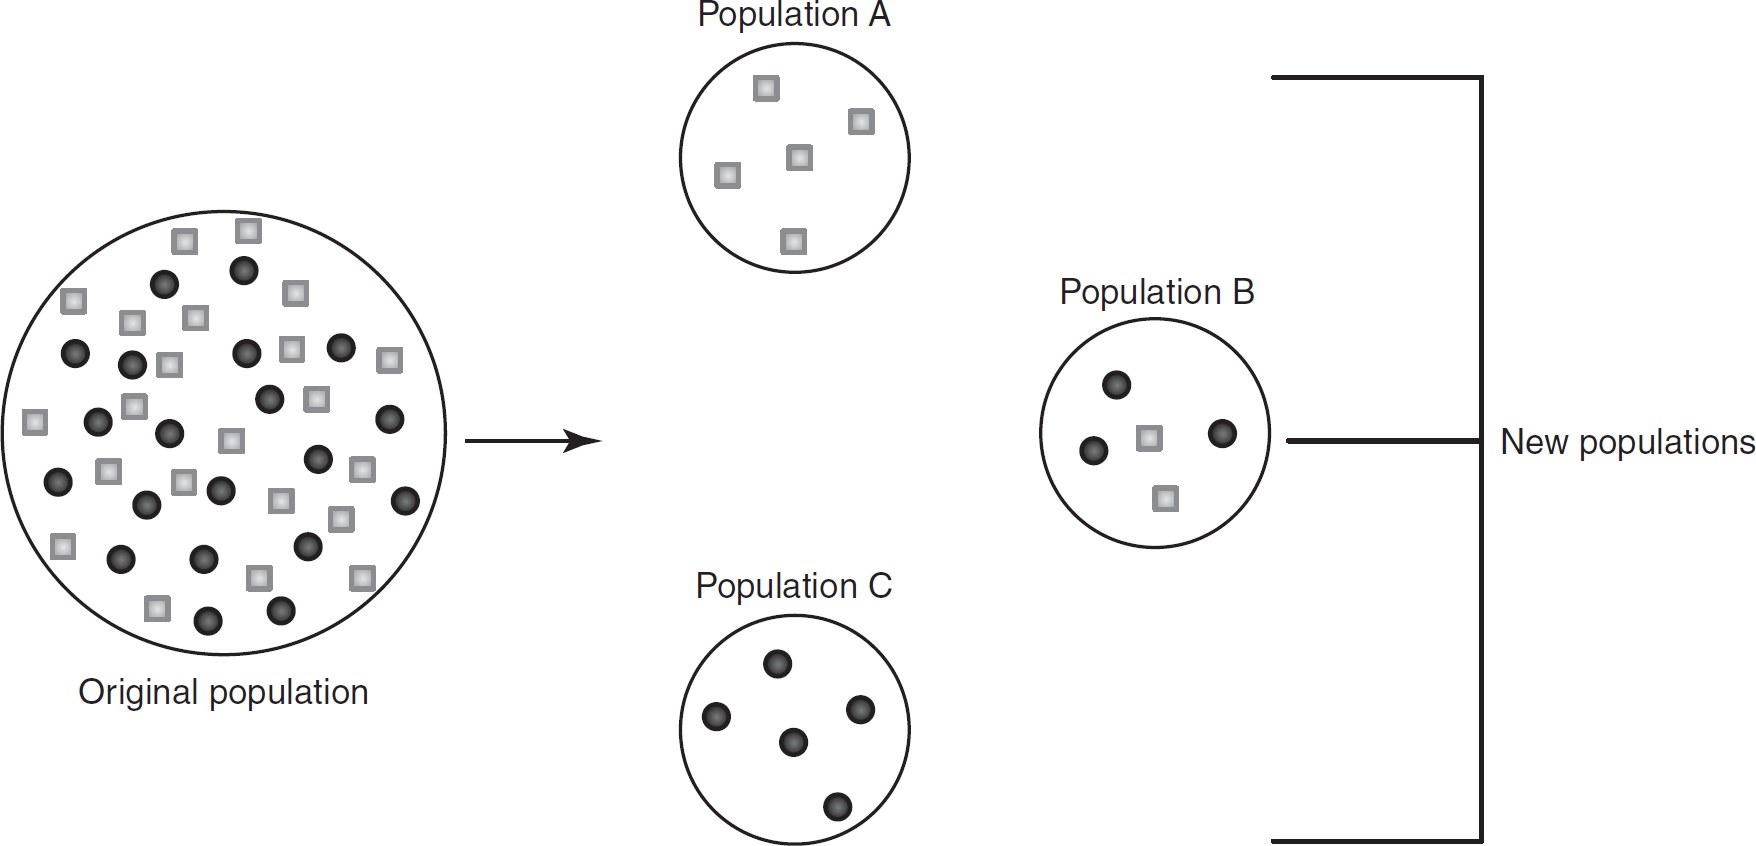
Figure 20.2 Model of the Founder Effect
In Figure 20.2, there are two different alleles present (represented by black circles and gray squares) in roughly equal frequencies in the original population. Only individuals who possess the allele represented by gray squares founded population A, leading to less genetic diversity in population A than existed in the original population. Similarly, the founding members of population C only possessed the allele represented by black circles, again leading to less genetic diversity in population C than existed in the original population; this is also a very different allele frequency than that seen in population A.
An example of the founder effect can be seen in the Amish population in Pennsylvania. The founding members of this population came from Europe in the mid-1700s. The approximately 200 founding members of this population had a higher frequency of the allele that causes a rare form of skeletal dysplasia, Ellis-Van Creveld syndrome. This has led to the frequency of this allele being relatively high in this population.
Hardy-Weinberg Equilibrium
Some populations have stable allele frequencies and are not evolving. Populations in an unchanging environment may not experience the selective pressures that lead to evolution. Scientists Godfrey Hardy and Wilhelm Weinberg each developed equations that describe these stable populations. For a population to have stable allele frequencies, five conditions must be met:
1.Large population size—A large population size reduces the chances of genetic drift occurring. In small populations, a change in allele frequencies (caused by genetic drift) is much more likely.
2.Random mating—Random mating eliminates the possibility of changing allele frequencies caused by sexual selection.
3.No gene flow—For allele frequencies to be stable, individuals must not be entering or leaving the population. The introduction of new individuals, or the movement of individuals out of a population, could change the allele frequencies.
4.No selection—All phenotypes in the population need to have equal reproductive success in order to keep allele frequencies stable. If one phenotype has a survival advantage, the alleles in that phenotype will become more prevalent in the population.
5.No mutations—Mutations are very rare and random occurrences. A mutation would change the allele frequencies in the population.
TIP
Remember, if a question asks for an allele frequency, you need to find p or q. If a question asks for a genotype frequency or the number of individuals, you need to find p2, 2pq, or q2.
Populations that meet all five of these conditions are said to be in Hardy-Weinberg equilibrium. If a population is in Hardy-Weinberg equilibrium, the following equations apply:
![]()
where p represents the frequency of the dominant allele (A) and q represents the frequency of the recessive allele (a)—note that this equation is used to describe allele frequencies—and
![]()
where p2 represents the frequency of the homozygous dominant genotype (AA), 2pq represents the frequency of the heterozygous genotype (Aa), and q2 represents the frequency of the homozygous recessive genotype (aa)—note that this equation is used to describe genotype frequencies.
It is useful to review some laws of probability here. If you flip one coin, the probability of getting heads is ![]() . If you flip two coins at the same time, the probability of both coins coming up heads is the product of their individual probabilities:
. If you flip two coins at the same time, the probability of both coins coming up heads is the product of their individual probabilities: ![]() . Similarly, if p is the probability of inheriting one copy of the dominant allele (A), then the probability of inheriting two copies of the dominant allele is p × p = p2.
. Similarly, if p is the probability of inheriting one copy of the dominant allele (A), then the probability of inheriting two copies of the dominant allele is p × p = p2.
The probability of inheriting two copies of the recessive allele (a) is q × q = q2. The probability of inheriting one dominant allele and one recessive allele is p × q = pq. However, there are two ways to create a heterozygous individual. The dominant allele could come from the father and the recessive from the mother, or the dominant allele could come from the mother and the recessive from the father. If there is more than one way that an event can occur, the probability of the event is the sum of the individual probabilities. So the frequency of heterozygotes would be the sum of these two events pq + pq = 2pq.
Practice with Hardy-Weinberg Equilibrium
Now try some practice problems.
1.In cats, long hair is recessive to short hair. A large, randomly mating population of cats is in Hardy-Weinberg equilibrium. In this population, 32% of the cats have long hair. What percentage of the population are heterozygous for short hair?
Start with the recessive phenotype, long hair, whose frequency is equal to q2: q2 = 0.32. Taking the square root of both sides of the equation gives you q = 0.57. Since the sum of p and q equals 1, p = 1 — q = 1 — 0.57 = 0.43. The frequency of heterozygotes equals 2pq, so the heterozygotes = 2(0.43)(0.57) = 0.49 = 49%.
2.In pigs, erect ears are dominant to drooping ears. In a pig population that is in Hardy-Weinberg equilibrium, 82% of the individuals have erect ears. What is the frequency of heterozygotes in this population?
Since there are two genotypes that can produce the dominant phenotype, the frequency of the dominant phenotype is equal to p2 + 2pq, which would give you an equation with two unknowns and is not solvable. In this situation, subtract the frequency of the dominant phenotype from 1 to obtain the frequency of the recessive phenotype. Since only one genotype can produce the recessive phenotype, the frequency of the recessive phenotype equals q2, which gives you an equation with just one unknown and is solvable.
Since 82% of the population has erect ears, 100 — 82 = 18% of the population must have drooping ears (the recessive phenotype). Therefore, q2 = 0.18, and q = 0.42. Subtracting q from 1 gives the value of p: p = 1 — 0.42 = 0.58. The frequency of heterozygotes then becomes 2pq = 2(0.58)(0.42) = 0.49, or 49%.
3.In dogs, black fur is dominant to brown fur. In a population of dogs that is in Hardy-Weinberg equilibrium, 10% of the individuals have brown fur. What is the frequency of the allele for black fur, and what percentage of the population possesses at least one copy of the allele for black fur?
In this problem, you are asked to find the frequency of an allele (p). First, start with the recessive phenotype, brown fur: q2 = 0.10, so q = 0.32. Since p + q = 1, p = 1 — q = 1 — 0.32 = 0.68. So the frequency of the allele for black fur (p) is 0.68. The second part of the question asks for the percentage of the population that possesses at least one copy of the allele for black fur. Since black fur is a dominant trait, alleles for black fur will be found in both homozygous dominant individuals (p2) and heterozygous individuals (2pq). The frequency of homozygous dominant individuals is p2 = (0.68)2 = 0.46. The frequency of heterozygous individuals is 2pq = 2(0.68)(0.32) = 0.44. Adding the frequency of homozygous dominant individuals and heterozygous individuals gives you 0.46 + 0.44 = 0.90, or 90% of the population has at least one copy of the dominant allele.
4.What do you do if a population is not in Hardy-Weinberg equilibrium? In these cases, you need to know the number of individuals with each genotype to find the allele frequencies. You cannot use the Hardy-Weinberg equations in these situations, but you can add up the alleles contributed by each genotype to the gene pool of the population. Here is an example.
In a nonrandomly mating population of 80 individuals, 10 have the homozygous dominant genotype, 46 are heterozygous, and 24 have the homozygous recessive genotype for a particular trait. What are the allele frequencies for this trait in this population?
Since there are 80 individuals in the population and each individual contributes two alleles for the trait to the population, there are a total of 80 × 2 = 160 alleles for the trait in this population. Each homozygous dominant individual contributes two copies of the dominant allele to the population for a total of 10 × 2 = 20 dominant alleles. Each heterozygous individual contributes one copy of the dominant allele for a total of 46 × 1 = 46 dominant alleles from the heterozygotes. The homozygous recessive individuals do not contribute any dominant alleles to the population. So the frequency of the dominant allele is ![]() . Each of the homozygous recessive individuals contributes two copies of the recessive allele to the population for a total of 24 × 2 = 48 recessive alleles. The heterozygous individuals each contribute one copy of the recessive allele to the population for a total of 46 × 1 = 46 recessive alleles. The frequency of the recessive allele is then
. Each of the homozygous recessive individuals contributes two copies of the recessive allele to the population for a total of 24 × 2 = 48 recessive alleles. The heterozygous individuals each contribute one copy of the recessive allele to the population for a total of 46 × 1 = 46 recessive alleles. The frequency of the recessive allele is then ![]() .
.
TIP
When solving Hardy-Weinberg problems, it is especially important to read the question carefully to understand what you are being asked to solve for. Pay attention to words like individuals versus allele.
Practice Questions
Multiple-Choice
1.In which populations is genetic drift more likely to occur?
(A)large populations
(B)small populations
(C)populations with great diversity
(D)populations with a high degree of gene flow
2.A group of birds is flying south during their yearly migration when a hurricane with extremely strong winds occurs. Only 10% of the group survive the storm, reaching their winter nesting site and reproducing the next spring. This type of event is an example of
(A)the bottleneck effect because only the fittest members of the population survived.
(B)the bottleneck effect because the population size was rapidly reduced.
(C)the founder effect because the group of birds from before the storm were not genetically diverse.
(D)the founder effect because the birds colonized a new habitat and never migrated again back to their original habitat.
3.Which of the following best explains the conditions under which the founder effect occurs?
(A)Random evolutionary change happens over multiple generations, causing a large population to separate into two smaller, genetically different populations.
(B)A population’s size is rapidly reduced, and the genetic diversity of the surviving population is not representative of the original, larger population.
(C)A small group of individuals from a larger population colonizes a new habitat. The small group that colonizes the new habitat does not possess the genetic diversity of the original, larger population.
(D)Environmental pressures select for the individuals with the adaptations that give them a greater likelihood of surviving and reproducing.
4.An isolated population in the United States are descendants of approximately 200 immigrants who arrived in the 1700s. Some individuals in this group of immigrants carried the allele for Ellis-Van Creveld syndrome. Today, this allele occurs at a much higher frequency in the descendants of this group than in the general population in the United States. This difference in the frequency of the Ellis-Van Creveld allele is an example of
(A)the bottleneck effect.
(B)the founder effect.
(C)natural selection.
(D)random mutations over multiple generations.
5.A scientist is studying the allele frequencies for a particular gene in a population of wild prairie dogs over a five-year period. The allele frequencies are shown in the table.
|
Year |
Frequency of Allele A1 |
Frequency of Allele A2 |
1 |
0.00 |
1.00 |
2 |
0.00 |
1.00 |
3 |
0.10 |
0.90 |
4 |
0.13 |
0.87 |
5 |
0.15 |
0.85 |
Which of the following is the most likely cause of the observed change in allele frequencies?
(A)artificial selection
(B)natural selection
(C)genetic drift
(D)gene flow
6.The following table shows the frequency of three genotypes (AA, Aa, and aa) in a population.
|
Genotype |
Frequency |
AA |
0.44 |
Aa |
0.14 |
aa |
0.42 |
The environment of the population changes so that individuals with the Aa genotype are more likely to survive and reproduce. Predict what would most likely happen to the frequencies of the AA and aa genotypes after 10 generations in this environment.
(A)The frequencies of both the AA and aa genotypes would increase.
(B)The frequencies of both the AA and aa genotypes would decrease.
(C)The frequency of the AA genotype would increase, and the frequency of the aa genotype would decrease.
(D)The frequency of the AA genotype would increase, and the frequency of the aa genotype would be 0.
7.Which of the following is a characteristic of a population that is in Hardy-Weinberg equilibrium?
(A)small population size
(B)gene flow
(C)sexual selection
(D)no mutations
8.Ebony body color is an autosomal recessive trait in fruit flies. In a large, randomly mating population of fruit flies that is in Hardy-Weinberg equilibrium, the frequency of ebony body color is 21%. What is the percentage of the population with the homozygous dominant genotype?
(A)29%
(B)45%
(C)54%
(D)79%
Questions 9 and 10
For a genetic disease that appears in homozygous recessive (aa) individuals, individuals who are heterozygous (Aa) for the disease are resistant to infections by certain parasites.
9.If 19% of the individuals in a population have the genetic disease, what is the frequency of individuals who are resistant to the parasites? Assume the population is in Hardy-Weinberg equilibrium.
(A)0.436
(B)0.492
(C)0.564
(D)0.810
10.Over half of the individuals living in a population where a particular parasite is prevalent are heterozygous for a recessive allele (Aa). Further studies reveal that individuals who are heterozygous for the recessive allele are resistant to the parasite, while individuals who are homozygous dominant or homozygous recessive are susceptible to the parasite. If the parasite was totally eliminated from this area, predict what would happen to the frequencies of the AA, Aa, and aa genotypes.
(A)The frequencies of the AA and aa genotypes would increase, and the frequency of the Aa genotype would decrease.
(B)The frequency of the AA genotype would decrease, and the frequencies of the Aa and aa genotypes would increase.
(C)The frequency of the Aa genotype would increase, and the frequencies of the AA and aa genotypes would decrease.
(D)The frequency of the aa would increase, and the frequencies of the AA and Aa genotypes would decrease.
Short Free-Response
11.A scientist is studying the allele frequencies in a population over several generations to help determine if the population is undergoing evolution. The data are shown in the table.
|
Generation Number |
Frequency of Allele A1 |
Frequency of Allele A2 |
1 |
0.81 |
0.19 |
2 |
0.74 |
0.26 |
3 |
0.62 |
0.38 |
4 |
0.49 |
0.51 |
(a)Describe why looking at allele frequencies over several generations could be used to determine if a population is undergoing evolution.
(b)Describe the changes in alleles A1 and A2 from generation 1 to generation 4.
(c)Evaluate the scientist’s hypothesis that this population is undergoing evolution based on the data available.
(d)Explain how the data would differ if individuals with the genotype A1A2 were more likely to survive than individuals with the genotype A1A1 or individuals with the genotype A2A2.
12.Wildfires in the western United States have drastically reduced the size of some animal populations and destroyed the habitats of other animal populations.
(a)Describe how wildfires can create the bottleneck effect in a population.
(b)90% of the habitat of a spotted owl colony was destroyed by a wildfire. A small percentage of the surviving owl population migrated to a new habitat. Explain the type of genetic drift this illustrates.
(c)The banana slug, Ariolimax columbianus, lives in the redwood forest in the mountains near Santa Cruz, California. A wildfire in these mountains in the summer of 2019 divided the slug’s habitat with a large area of dry ash that the slugs cannot cross. Predict the effect this had on the genetic diversity of the banana slug population.
(d)Justify your prediction from part (c).
Long Free-Response
13.The California kangaroo rat, Dipodomys ingens, is considered an ecosystem engineer for its role in creating extensive burrowing systems that can change soil characteristics and provide habitats for other species. Fur color in D. ingens ranges from white to sandy to brown. Ecologists counted the number of D. ingens in an area before and five years after a large mudslide killed the majority of the kangaroo rats in the area. Data are shown in the table.
|
Fur Color |
Number Before Mudslide |
Number Five Years After Mudslide |
White |
75 |
0 |
Sandy |
165 |
140 |
Brown |
60 |
160 |
(a)Describe the probable cause of the change in frequency of fur color phenotypes in D. ingens after the mudslide event.
(b)Identify an appropriate control group for this study.
(c)Analyze the data with regard to how the mudslide affected the frequencies of fur color phenotypes in D. ingens.
(d)The burrows created by D. ingens provide habitats for many lizard species. In order to prevent future mudslides, retaining walls were constructed on the hillsides in the area, and the number of D. ingens in the area decreased by over 85%. Predict the effect of this on the lizard species diversity in the area, and justify your prediction.
Answer Explanations
Multiple-Choice
1.(B)Genetic drift, the random loss of alleles, is more likely in small populations because in small populations, fewer individuals would have the opportunity to pass on a rare allele to the next generation than in a large population. Choice (A) is incorrect because it is the opposite of the correct answer. Greater diversity does not influence the chances of genetic drift, so choice (C) is incorrect. Choice (D) is incorrect because gene flow, or migration, does not necessarily cause genetic drift.
2.(B)The bottleneck effect occurs when the majority of a population dies and the surviving individuals do not possess all of the alleles from the original population. Choice (A) is incorrect because survival after bottleneck events may be random and is not dependent on an organism’s fitness. The founder effect occurs when a small group of individuals leaves a larger population to colonize a new area. Since this scenario does not describe the founder effect, choices (C) and (D) are incorrect. Also, nothing in the question provides any information on the genetic diversity of the population before the hurricane, which further rules out choice (C). Choice (D) can be further ruled out because nothing in the question suggests that the birds never migrated back to their original habitat.
3.(C)The founder effect occurs when a small group of individuals from a large population leaves the larger group to colonize a new area and the small group does not possess the same allele frequencies as the larger group. Choice (A) is incorrect because the founder effect is not caused by random evolutionary change. The rapid reduction of a population’s size, leading to a group of survivors that is not representative of the original, larger population, is the bottleneck effect. Thus, choice (B) is incorrect. Choice (D) is incorrect because it describes the process of natural selection, not the founder effect.
4.(B)This scenario is an example of the founder effect. Choice (A) is incorrect because the original population did not undergo a rapid decrease in population size. There is no evidence in the question that Ellis-Van Creveld syndrome leads to decreased survival, so choice (C) is incorrect. Choice (D) is incorrect because it would be extremely unlikely that random mutations over several generations would lead to the appearance of the allele that causes Ellis-Van Creveld syndrome.
5.(D)Initially, the population of wild prairie dogs did not possess the A1 allele, so it is likely that it arrived in an individual prairie dog that migrated into the population sometime between years 2 and 3. Therefore, gene flow is the correct answer. Choice (A) is incorrect because these are wild prairie dogs, and there is no evidence of selective breeding of prairie dogs by humans. No information is given in the question about whether or not alleles A1 or A2 confer a survival advantage, so choice (B) is incorrect. No allele was lost in the population, so choice (C) is incorrect.
6.(B)If individuals with the Aa genotype are more likely to survive and reproduce (heterozygote advantage), the frequency of the Aa genotype would increase over time and the frequencies of the AA and aa genotypes would both decrease.
7.(D)The five conditions that are necessary for Hardy-Weinberg equilibrium are large population size, random mating, no selection of any kind, no gene flow, and no mutations. Choice (A) is incorrect because large populations, not small populations, are necessary for Hardy-Weinberg equilibrium. Migration (or gene flow) also violates one of the conditions necessary for Hardy-Weinberg equilibrium, so choice (B) is incorrect. Choice (C) is incorrect because in order for a population to be in Hardy-Weinberg equilibrium, no selection can occur.
8.(A)If 21% of the population has the recessive phenotype, q2 = 0.21 and q = 0.458. Since p + q = 1, p = 1 — 0.458 = 0.542. The frequency of homozygous dominant individuals is p2 = (0.542)2 = 0.29, or 29%. Choice (B) is the frequency of the recessive allele and is incorrect. Choice (C) is incorrect because 54% is the frequency of the dominant allele, not the homozygous dominant genotype. The frequency of the dominant phenotype is 79%, so choice (D) is also incorrect.
9.(B)If 19% of the individuals have the recessive genetic disease, q2 = 0.19 and q = 0.436. Then since p + q = 1, p = 0.564. The heterozygous individuals are resistant to the parasites and have a frequency of 2pq = 2 × 0.564 × 0.436 = 0.492. Choice (A) is the frequency of the recessive allele and is incorrect. Choice (C) is the frequency of the dominant allele and is incorrect. The frequency of individuals who do not have the recessive disease (some of whom may be heterozygous and others who may be homozygous dominant) is 81%, so choice (D) is incorrect.
10.(A)If the parasite was totally eliminated from this environment, there would no longer be any advantage to being heterozygous for the recessive allele. So over time, natural selection would increase the frequencies of the AA and aa genotypes and the frequency of the Aa genotype would decrease. Choice (B) is incorrect because the frequency of the AA genotype would increase (not decrease) and the frequency of the Aa genotype would decrease (not increase). If the parasite was eliminated, there would be no advantage to having the Aa genotype. So the frequency of the Aa genotype would no longer be favored and would be expected to decrease, not increase, and the frequencies of the AA and aa genotypes would increase. Thus, choice (C) is incorrect. While the frequency of the aa genotype would be expected to increase, the frequency of the AA genotype would also be expected to increase. So choice (D) is incorrect.
Short Free-Response
11.(a)If the allele frequencies in a population are changing, the population is evolving. So looking at allele frequencies in a population over time can help determine if the population is evolving.
(b)The frequency of the A1 allele decreased from generation 1 to generation 4, and the frequency of the A2 allele increased from generation 1 to generation 4.
(c)The scientist’s hypothesis that this population in undergoing evolution is supported by the data because the allele frequencies are changing.
(d)If individuals with the A1A2 genotype were more likely to survive than individuals with the A1A1 or A2A2 genotypes, over time, it would be expected that eventually the frequencies of the A1 and A2 alleles would approach 0.50.
12.(a)Wildfires could create a bottleneck effect by drastically reducing the population size so that all the individuals who carry rare alleles (that were present in the original population) might not survive. Those rare alleles would then be eliminated from the population.
(b)This scenario illustrates the founder effect since a very small percentage of the spotted owl population is colonizing a new habitat and that small group might not have the same allele frequencies as that of the original population.
(c)The genetic diversity of the banana slug population in this area likely decreased.
(d)Since the population of banana slugs was randomly separated into two smaller groups that could not interbreed, each of the subgroups would have less genetic diversity.
Long Free-Response
13.(a)The mudslide changed the environment of the area so that darker-colored kangaroo rats had a survival advantage after the mudslide and the lighter-colored kangaroo rats had a survival disadvantage after the mudslide.
(b)An appropriate control group would be a similar habitat with a similar species in which a mudslide did not occur.
(c)Five years after the mudslide, there were more brown-colored kangaroo rats in this area and no kangaroo rats with white fur. After the mudslide, brown-colored kangaroo rats had a survival advantage over the white-colored kangaroo rats. (The brown-colored kangaroo rats had fur color that was similar to the color of the surrounding habitat, so it was more difficult for predators to see the brown-colored kangaroo rats.) Therefore, the relative numbers of brown-colored kangaroo rats increased over time.
(d)If there are far fewer D. ingens in this area, there will be fewer burrows for the lizard species to occupy and the diversity of the lizard species in the area will decrease.