Biology Premium, 2024: 5 Practice Tests + Comprehensive Review + Online Practice - Wuerth M. 2023
UNIT 8 Ecology
23 Population Ecology, Community Ecology, and Biodiversity
Learning Objectives
In this chapter, you will learn:
➜Population Ecology
➜K-Selected vs. r-Selected Populations
➜Community Ecology and Simpson’s Diversity Index
➜Biodiversity
Overview
Populations are made of individual organisms that interact with one another and with their environment in complex ways. This chapter reviews the factors that affect the rate of growth of populations and the biodiversity of the communities in which they live.
Population Ecology
How organisms get the energy and matter they need to survive affects their population sizes and the rate of population growth. Population growth depends on a number of factors including:
§ Population size (N)
§ Birth rate (B)
§ Death rate (D)
TIP
You do not need to memorize the equations presented in this chapter. These equations are included on the AP Biology Equations and Formulas sheet that you will have access to during the AP Biology exam. Spend your time applying your knowledge by answering as many practice problems as possible using these formulas.
Population growth rates are calculated as the change in the population size over change in time: ![]() . One way to calculate the rate of population growth is to simply compare the birth rate and the death rate in the population, as in the following equation:
. One way to calculate the rate of population growth is to simply compare the birth rate and the death rate in the population, as in the following equation:
![]()
If the birth rate exceeds the death rate in a population, the population size will increase. If the birth rate is less than the death rate in a population, the population size will decrease.
If there are no limiting factors on the growth of a population (there is abundant food and habitat, no predators are present, etc.), a population will experience exponential growth and can be described with the following equation:
![]()
In this equation, N represents the population size, and rmax is the maximum per capita growth rate of the population. Note that the larger the population size, the higher the growth rate and the faster the population will grow. Exponential growth curves are usually J-shaped, as shown in Figure 23.1.
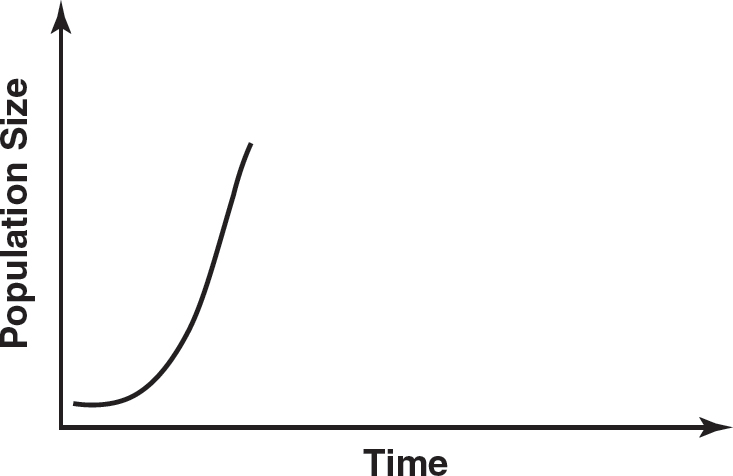
Figure 23.1 Exponential Growth Curve
Some populations will eventually exceed the resources available in their environment, and their growth will be limited by resource availability. Factors that limit the growth of these populations can be either density-dependent factors or density-independent factors. Some examples of density-dependent factors that limit population growth are disease, predation, and competition for food, habitat, or mates. Density-independent factors include temperature, precipitation, and natural disasters (such as forest fires or volcanic eruptions). These limitations result in logistic growth of a population. Logistic growth can be described by the following equation:
![]()
In this equation, N still represents the population size, and rmax again is the maximum per capita growth rate of the population. K represents the carrying capacity of the environment. Carrying capacity is defined as the maximum population that can be supported by the available resources in an environment. Notice that as the population size increases (N becomes closer to K), the rate of growth of the population will decrease. Smaller population sizes that are far below the carrying capacity of an environment will experience higher growth rates.
Logistic growth curves are S-shaped, as shown in Figure 23.2. Logistic growth curves start with a relatively flat lag phase, followed by a period of exponential growth (also called the log phase), which slows as the population reaches the carrying capacity of the environment. Logistic growth curves stabilize at or near the carrying capacity of the environment.
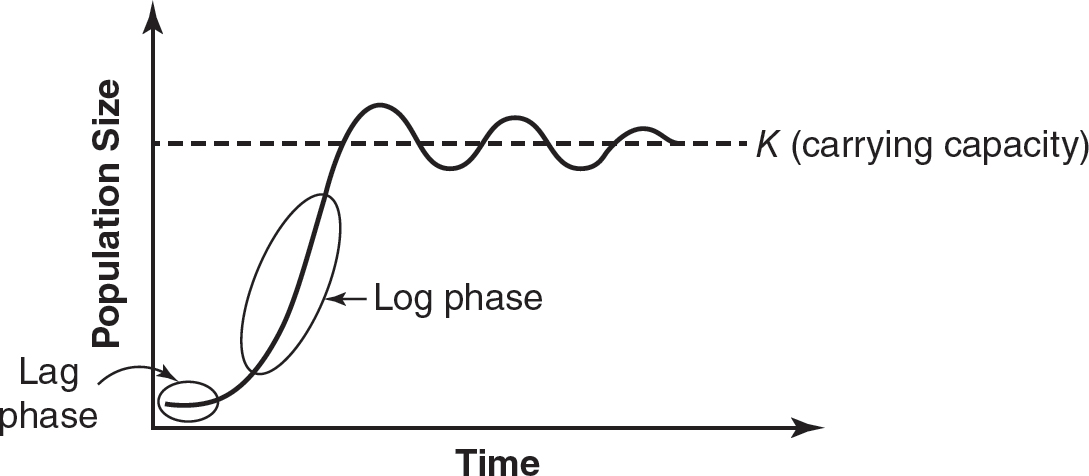
Figure 23.2 Logistic Growth Curve
K-Selected vs. r-Selected Populations
As discussed in Chapter 22, energy availability affects the reproductive strategies of populations. Populations that live in more stable environments and have more energy available tend to have K-selected reproductive strategies. K-selected populations possess relatively stable population sizes at or near the carrying capacity of their environment. K-selected populations usually reproduce more than once per lifetime, with few offspring per reproductive cycle. K-selected populations invest greater levels of parental care in their offspring, resulting in higher survival rates in their offspring. K-selected populations experience logistic growth and are sensitive to density-dependent factors. Most mammal and bird species are K-selected populations.
Populations that live in unstable environments and have less energy available have r-selected reproductive strategies. These populations reproduce at a younger age, often only once in their lifetime. Each reproductive cycle produces large numbers of offspring. However, r-selected populations invest little or no parental care in their offspring, leading to much lower survival rates in the offspring. r-selected populations experience “boom or bust” cycles, with periods of exponential growth leading to populations that far exceed the carrying capacity of an environment (“booms”), followed by rapid decreases in the population size (“busts”). The size of r-selected populations is usually not sensitive to population densities. Many fish and amphibian species have r-selected reproductive strategies.
Community Ecology and Simpson’s Diversity Index
A community is a group of interacting populations living in the same habitat. Communities can be described by their species composition and species diversity. Species composition is the number of species that live in an area. Species diversity reflects the number of species in an area and the number of members of each of those species in the area. Species diversity gives a more accurate assessment of the variety of organisms found in an area. One way of representing species diversity is the equation for Simpson’s Diversity Index:
![]()
where n = the total number of organisms of a particular species and N = the total number of organisms of all the species. The higher Simpson’s Diversity Index, the more diverse the community.
Practice with Simpson’s Diversity Index
The equation for Simpson’s Diversity Index can be used to compare the diversity of two communities, as in the following example.
Community A is in a suburban backyard, and Community B is in a forest. The species composition and the number of organisms of each species in each community are shown in the following tables.
|
Community A |
|
Species |
Number of Organisms |
Grass |
11,000 |
Camellia Shrubs |
4 |
Elm Tree |
1 |
Total Number of Organisms |
11,005 |
|
Community B |
|
Species |
Number of Organisms |
Oak Trees |
2 |
Earthworms |
500 |
Ferns |
15 |
Chipmunks |
2 |
Ants |
1,000 |
Mesquite Bush |
5 |
Total Number of Organisms |
1,524 |
Simpson’s Diversity Index for Community A is:
![]()
Simpson’s Diversity Index for Community B is:
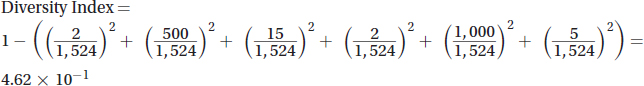
Community B has a diversity index more than 500 times larger than the diversity index of Community A.
Relationships Within Communities
Interactions and relationships among members of a community are important for the survival of organisms. The interactions among populations within a community can change over time. These changing interactions can influence how members of the community access the matter and energy they need to survive.
There are many different types of relationships among interacting members of a community:
§ Competition: Organisms compete for resources, such as food, habitats, and mates. Competition can occur between two different species (interspecies competition) or between members of the same species (intraspecies competition). Competition can lead to the demise of organisms in an ecosystem.
§ Predator/Prey: Predator species eat prey species and depend on prey populations for food. Insufficient numbers of prey species will lead to declining numbers of predator species. As the number of prey increase, predator numbers will follow with an increase in numbers. Fluctuations in the numbers of predators generally follow fluctuations in the numbers of prey, as shown in Figure 23.3.
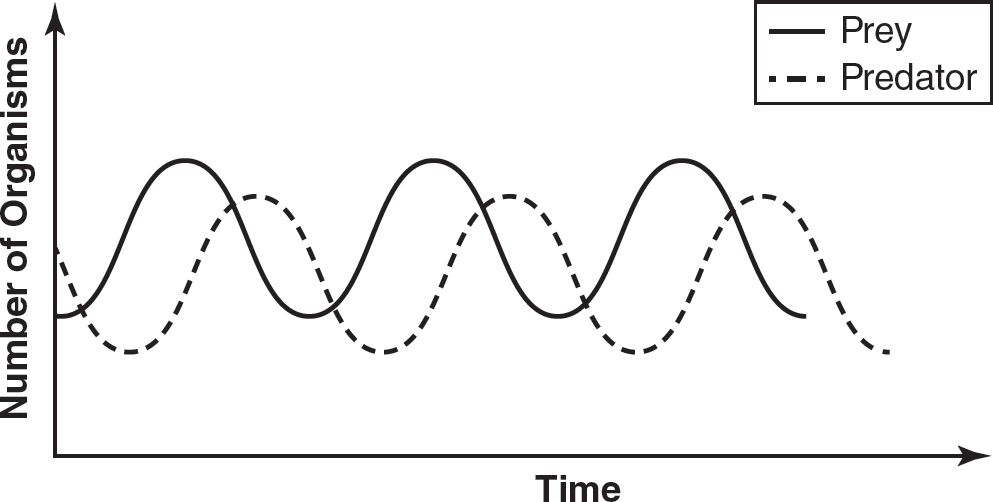
Figure 23.3 Prey-Predator Populations Over Time
§ Niche partitioning: Competing species may coexist if they use the resources available in their habitat differently; this is known as niche partitioning. Competing species in a habitat may use dietary partitioning. An example of this is on the African savanna, where some animal species are grazers and eat grass, while other animal species in the same habitat are browsers and eat tree leaves. This allows them to coexist in the same habitat. Anole lizards exhibit habitat partitioning, with some anoles living in the forest canopy and others on the ground.
§ Trophic cascades: A trophic cascade refers to the far-reaching effects of the reduction of one trophic level in a food web. For example, the decline of sea otter populations on the Pacific Coast led to increases in the sea urchin populations. Sea otters eat sea urchins. Without the presence of sea otters, the sea urchin populations exploded. Sea urchins eat kelp, and the increase in the numbers of sea urchins led to a decrease in kelp forests. Declines in kelp forests led to decreased habitats for other marine organisms in the area. Changes in just one level of the food chain (the number of sea otters) had cascading effects throughout the food web.
§ Parasitism: This is a symbiotic relationship where one species benefits from the relationship but the other species is harmed. Fleas that live on dogs or cats are parasites. The fleas benefit from consuming the blood of the host animal, and the dog or cat on which the flea lives is harmed.
§ Commensalism: In commensalism, one species benefits and the other neither benefits nor is harmed. Cattle egrets are birds that follow cattle that are grazing. As the cattle graze, insects are disturbed and fly out of the grass; the cattle egrets eat these insects.
§ Mutualism: Mutualistic relationships benefit both species. Oxpeckers are birds that eat the ticks and other parasites from the backs of rhinos and zebras. Oxpeckers benefit from this food source, and the rhinos and zebras benefit from the parasite removal.
These relationships among members of a community can be classified as positive (as in mutualism), negative (parasitism), or neutral (commensalism). However, some interactions can be classified in multiple categories. For example, mistletoe is a parasite on trees and negatively impacts the growth of the tree. Some bird species eat mistletoe berries, so mistletoe provides a benefit to those birds. Some mistletoe species also provide habitats for small animal species.
Biodiversity
Biodiversity refers to the variety of living organisms in an ecosystem. Ecosystems that have greater biodiversity are usually more resilient and adaptable to changes in their environment.
Biodiversity depends on both abiotic (nonliving) and biotic (living) factors. Abiotic factors, such as climate and water availability, will influence the types of species and the number of organisms of each species that are found in an ecosystem. Biotic factors, such as the number of producers, will limit how many consumers can survive in an ecosystem. The biodiversity of an ecosystem will influence the structure of the food chains and food webs found in that ecosystem.
Keystone species have a disproportionally large effect on an ecosystem compared to their numbers. When wolves were hunted to levels that neared extinction in Yellowstone National Park 100 years ago, deer populations in the park increased. This overpopulation of deer led to a decrease in the biodiversity in plant species. Other animal species that depended on these plant species declined in numbers. When wolves were reintroduced in the 1990s, wolves limited the deer populations. The populations of other animal species and plant species increased, increasing the biodiversity of the entire ecosystem. Wolves are a keystone species in the Yellowstone ecosystem. When a keystone species is removed from an ecosystem, the ecosystem may be in danger of collapsing.
Disruptions to ecosystems can change the structure of the ecosystem or even lead to its demise. Invasive species are species that are not native to a habitat. If an invasive species has no predators in a habitat, it can outcompete native species in the area, leading to the extinction of the native species. Cane toads are an invasive species that were introduced to Australia in the early 20th century in an effort to control the cane beetle, which was destroying sugarcane crops. Unfortunately, cane toads have no natural predator in Australia and grew in numbers, outcompeting the native species for food and habitats. In addition, cane toads are toxic when consumed by other animals. Larger animals that tried to eat cane toads died from the toxins the cane toads produced. Cane toads have led to the extinction of many native species in Australia.
Human impacts can also cause disruptions to ecosystems. Habitat destruction (as new cities are built) can lead to decreased biodiversity. When humans move into a previously uninhabited area, new diseases may be introduced into the ecosystem. Humans may also come into contact with previously unknown diseases when they move into new areas. Humans also generate pollution that can make water sources less habitable for other species.
Geological events, such as volcanic eruptions, can also disrupt ecosystems, leading to changes in biodiversity. Severe weather events, such as hurricanes, can decrease plant and animal diversity in an area. Prolonged droughts can change the biodiversity of an ecosystem.
These disruptions in ecosystems can lead to the evolution of populations. Environments will select for adaptations that provide an advantage in an environment. As the environment changes, the adaptations that are favored and selected for will also change. Adaptations are generated by mutations. Mutations are random events, but selection is not random. Rapid changes in the environment can accelerate the pace of evolution.
Practice Questions
Multiple-Choice
Questions 1 and 2
Refer to the figure, which shows the population of wild rabbits on an island as time progresses.
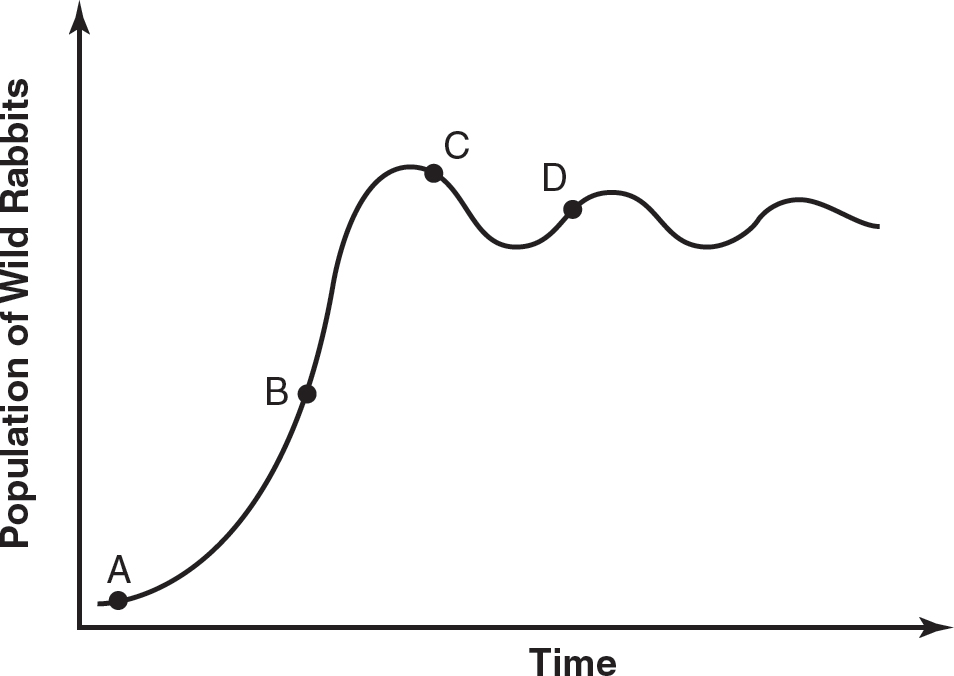
1.Which of the following best represents a time when the rabbit population was experiencing exponential growth?
(A)A
(B)B
(C)C
(D)D
2.Which of the following points best approximates the carrying capacity of the island for rabbits?
(A)A
(B)B
(C)C
(D)D
3.Wildlife management introduces 135 ducks to a reservoir in an effort to restore the duck population in the area. The growth rate of the population (rmax) is 0.074 ducks/year. Which of the following is the best estimate of the size of this duck population after one year?
(A)135
(B)141
(C)145
(D)152
4.In 1986, the quail population in Golden Gate Park in San Francisco was 140 birds. Hunting by feral cats reduced the number of quail to 32 birds by 2016. If the birth rate of quail over this period averaged 20.4 quail/year, what was the average death rate of quail during this period?
(A)2.4 quail/year
(B)3.6 quail/year
(C)24 quail/year
(D)36 quail/year
5.A population of 190 jackrabbits lives in McInnis Park in San Rafael, California. The carrying capacity of the park for jackrabbits is approximately 200 rabbits. If the rmax for the jackrabbit population is 1.5 surviving jackrabbits per year, what is the estimated increase in the number of jackrabbits in one year?
(A)10
(B)14
(C)285
(D)300
6.Which of the following statements describes a population that could experience exponential growth?
(A)a population that was limited by density-dependent factors
(B)a population whose size is beyond the carrying capacity of the environment
(C)a population in which there are no limiting factors
(D)a K-selected population
7.Acacia ants (Pseudomyrmex ferruginea) live on acacia trees (Vachellia cornigera). The ants obtain food and shelter from the acacia trees, and the ants drive away animals that would otherwise eat the leaves of the acacia trees. Which of the following best describes the relationship between Pseudomyrmex ferruginea and Vachellia cornigera?
(A)niche partitioning
(B)commensalism
(C)mutualism
(D)parasitism
8.Two species of lynx spiders, Peucetia rubrolineata and Peucetia flava, both inhabit the plant Trichogoniopsis adenantha, a type of sunflower found in Brazil. However, Peucetia rubrolineata inhabit plants in shaded areas, while Peucetia flava inhabit plants in open areas. This is an example of
(A)competition.
(B)mutualism.
(C)niche partitioning.
(D)predator/prey relationship.
9.Cytisus scoparius, also known as Scotch broom, was introduced into California from England in the mid-1800s as an easy-to-grow plant that helped stabilize soil on the hillsides. One Scotch broom plant can produce over 12,000 seeds a year. Scotch broom forms a dense shade canopy that prevents seedlings of other plants from growing. There are no natural predators for Scotch broom in California since its leaves are toxic to most animal species. Which of the following most accurately describes Scotch broom’s role in the California ecosystem?
(A)keystone species
(B)invasive species
(C)mutualistic species
(D)native species
10.Tidal marshland A, which is adjacent to the San Francisco airport, has a Simpson’s Diversity Index of 0.65. Tidal marshland B, which is two miles from the airport, has a Simpson’s Diversity Index of 0.80. An oil spill occurs at a location at the halfway point between the two marshlands. If both marshlands are equally contaminated by the oil spill, which marshland is more likely to recover from the oil spill?
(A)Tidal marshland A is more likely to recover, because its lower Simpson’s Diversity Index means that few species will be affected.
(B)Tidal marshland B is more likely to recover, because its higher Simpson’s Diversity Index means it has a wider variety of species and can better absorb the effects of a disturbance.
(C)Both ecosystems will be equally affected, because they are the same distance from the oil spill.
(D)Neither ecosystem will be able to recover, because oil is toxic to all organisms.
Short Free-Response
11.A population of 45 geese are introduced to a lake. The birth rate of the population is 0.28 geese per year, and the death rate is 0.18 geese per year.
(a)Calculate the rate of population growth.
(b)Determine whether the population of geese is increasing or decreasing.
(c)The carrying capacity for geese at this lake is about 80 geese. Make a prediction about the population of geese relative to the lake’s carrying capacity for geese in the next 10 years.
(d)Justify your prediction from part (c).
12.On an island north of the Arctic Circle, the Arctic fox preys upon puffins, and puffins consume Arctic grass.
(a)Identify the trophic levels to which the Arctic fox, puffin, and Arctic grass belong.
(b)Explain why the number of Arctic foxes on this island will most likely be less than the number of puffins in a healthy ecosystem.
(c)Predict the effect that the elimination of all Arctic foxes on this island would have on the puffins and Arctic grass.
(d)Justify your prediction from part (c).
Long Free-Response
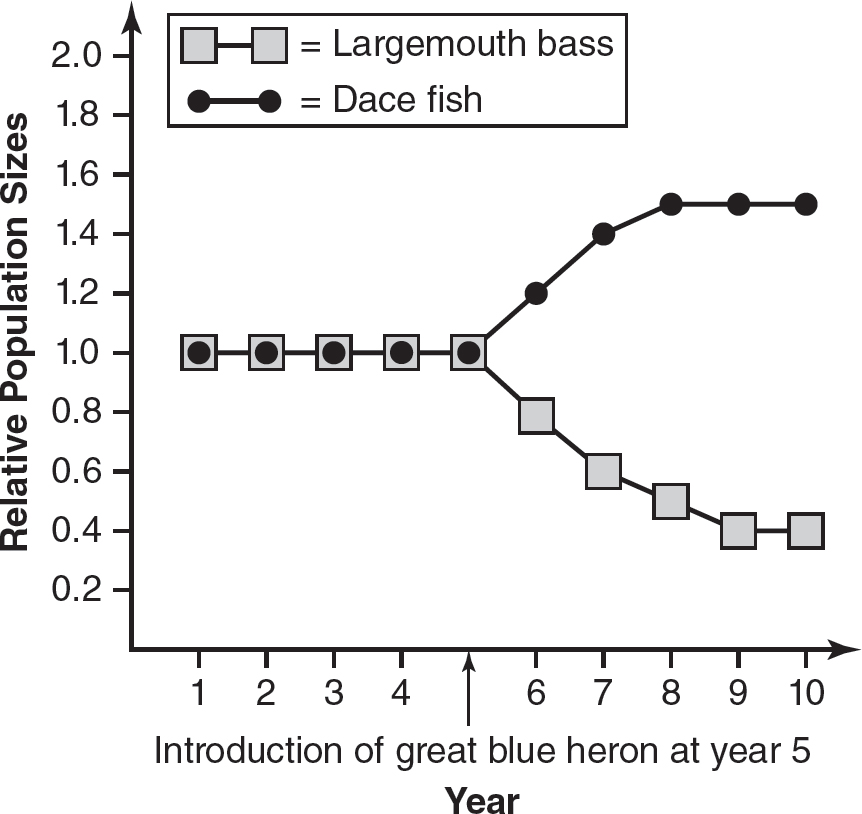
13.Largemouth bass (Micropterus salmoides) eat dace fish (Leuciscus leuciscus). Dace fish eat daphnia. Daphnia eat algae in the lake. The number of largemouth bass and dace fish in a lake are recorded over a 10-year period. At year 5, great blue herons (Ardea herodias) are introduced to the lake. Great blue herons feed on young largemouth bass. The following graph shows the data regarding the relative population sizes of the largemouth bass and dace fish over the 10-year period.
(a)Describe the trophic level of the dace fish in this ecosystem.
(b)Identify the independent variable and the dependent variable in this experiment.
(c)Analyze the data to determine the effect of the introduction of great blue herons on the population sizes of the largemouth bass and the dace fish.
(d)Predict the effect of the introduction of the great blue herons on the algae density in the lake. Justify your prediction.
Answer Explanations
Multiple-Choice
1.(B)The most rapid population growth occurs during exponential growth, which is at point B. Choice (A) is incorrect because it represents growth during the lag phase. At point C, the population is starting to decline in numbers, so choice (C) is incorrect. Point D represents the carrying capacity, so choice (D) is also not the answer.
2.(D)Point D represents the carrying capacity because the population size is stabilizing at point D. Point A represents the lag phase, point B represents exponential growth, and point C represents a population that is starting to decline, so choices (A), (B), and (C) are incorrect.
3.(C) ![]() ducks in one year. Since the starting population size is 135 ducks, after one year, there will be 135 + 10 = 145 ducks.
ducks in one year. Since the starting population size is 135 ducks, after one year, there will be 135 + 10 = 145 ducks.
4.(C) ![]() . So the average death rate would be
. So the average death rate would be ![]() . The death rate is
. The death rate is ![]() .
.
5.(B) Since there is a carrying capacity in this environment, use this equation: ![]() . Choice (B) is the closest estimate to this number and is therefore the correct answer.
. Choice (B) is the closest estimate to this number and is therefore the correct answer.
6.(C)Populations grow exponentially if there are no limiting resources or predators that would limit the population size. If the population was limited by density-dependent factors, its growth would be logistic, so choice (A) is incorrect. Choice (B) is incorrect because if the size of the population was beyond the carrying capacity of the environment, its numbers would be declining, not growing. K-selected populations experience logistic growth, so choice (D) is also incorrect.
7.(C)Since both the ants and the acacia trees benefit from the relationship, the symbiosis between them is mutualistic. Niche partitioning is using different parts of a resource, so choice (A) is incorrect. Choice (B) is incorrect because commensalism benefits one member of the symbiosis but the other member neither benefits nor is harmed. In parasitism, one member of the symbiosis benefits but the other is harmed, so choice (D) is incorrect.
8.(C)Niche partitioning occurs when different species use a limited resource differently. The two species of spiders use the same species of plant, but one species of spiders only uses plants in the shade while the other only uses plants in open areas. So they partition the resource differently. Choice (A) is incorrect because the spiders are not in direct competition for the same resource. This is not a mutualistic relationship between the spiders because they do not provide a benefit to each other, so choice (B) is incorrect. Choice (D) is incorrect because the spiders do not prey on each other.
9.(B)Scotch broom is not native to California. It outcompetes other plants and has no natural predators in California, so it is an invasive species. Choice (A) is incorrect because if a keystone species is removed, the entire ecosystem may collapse. Removing Scotch broom would most likely help the ecosystem, not cause it to collapse. Scotch broom does not benefit other organisms in this ecosystem; therefore, it is not a mutualistic species and choice (C) is incorrect. Choice (D) is incorrect because Scotch broom is not native to California.
10.(B)Ecosystems with more biodiversity are more likely to be able to recover from ecological disturbances. Choice (A) is incorrect because a lower Simpson’s Diversity Index means less biodiversity and that ecosystem would be less likely to recover from a disturbance. The difference in the two marshlands’ biodiversity will result in different abilities to recover from the disturbance, so choice (C) is incorrect. Choice (D) is incorrect because while oil is toxic to all organisms, some organisms may be able to recover from exposure to oil.
Short Free-Response
11.(a)The rate of population growth is ![]() geese per year.
geese per year.
(b)This population of geese is increasing because the birth rate is greater than the death rate.
(c)It is expected that the geese population will exceed the carrying capacity of the lake within the 10-year period.
(d)The growth rate of the geese population is 0.10, or 10%. If that growth rate continues over the next 10 years, the population of geese will exceed the lake’s carrying capacity before the end of the 10-year period.
12.(a)The Arctic fox is a secondary consumer. The puffin is a primary consumer. The Arctic grass is a producer.
(b)On average, only about 10% of the energy is available to the next trophic level. So the number of puffins must exceed the number of Arctic foxes or else the Arctic foxes would not be able to meet their energy needs.
(c)The elimination of all Arctic foxes would increase the number of puffins and decrease the density of the Arctic grass population.
(d)Since Arctic foxes prey on puffins, the elimination of the Arctic foxes would increase the number of puffins. Since puffins consume the Arctic grass, this increase in puffins would decrease the density of the Arctic grass on the island.
Long Free-Response
13.(a)The dace fish are secondary consumers because they eat daphnia, which are primary consumers (that eat algae, which are the producers). Dace fish are also the prey of the largemouth bass.
(b)The independent variable is the introduction of the great blue herons. The dependent variable is the relative population sizes of the largemouth bass and the dace fish.
(c)The introduction of the great blue herons reduced the relative population size of the largemouth bass by about 40% and increased the relative population size of the dace fish by about 40%. This is because the great blue herons fed on the largemouth bass, reducing their numbers. As a result of this decrease in largemouth bass, the number of dace fish increased since there were no longer as many predators (largemouth bass) to contend with.
(d)The algae density in the lake would increase. This is because algae are consumed by daphnia and daphnia are consumed by dace fish. If the numbers of dace fish increase (following the introduction of the great blue herons), more daphnia will be consumed and there will be fewer daphnia to consume the algae. Thus, the algae density in the lake will increase.