CCEA GCSE Biology - Denmour Boyd, James Napier 2017
Unit 2
Osmosis and plant transport
Specification points
This chapter covers sections 2.1.1 to 2.1.6 of the specification. It is about osmosis, plasmolysis, turgidity, transpiration and the potometer, and the prescribed practical activities that demonstrate these processes.
The movement of substances into and out of cells
Cell membranes allow some substances to pass through, but prevent the movement of others; they are selectively permeable. Plant cells are also surrounded by a cell wall. The cell wall is totally permeable and has no role in controlling what enters or leaves the cell.
Diffusion, the random movement of a substance from where it is in high concentration to where the concentration is lower, is an important process in the transportation of substances through cell membranes. We have already met diffusion in Chapter 1.
Osmosis
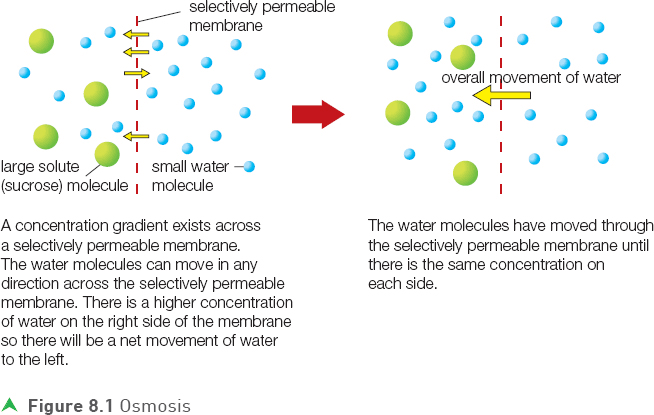
Osmosis is a special type of diffusion involving the movement of water molecules through a selectively permeable membrane. If pure water and a sucrose solution are separated by a selectively permeable membrane (such as dialysis tubing or Visking tubing) then osmosis will occur. The water will move from where it is in a higher concentration (pure water) to where it is in a lower concentration (sucrose solution); we say it moves down the concentration gradient. Another way of describing this is to say that the water moves from the weaker to the stronger solution.
Osmosis can be defined as the diffusion (movement) of water from a dilute solution to a more concentrated solution through a selectively permeable membrane.
Figure 8.1 shows how, in osmosis, water molecules move through the selectively permeable membrane but other larger molecules, such as sucrose, cannot fit through.
Tip
A selectively permeable membrane allows some substances through but not others. In osmosis, water can pass through the membrane because its molecules are small, but the sucrose cannot pass through as its molecules are large.
Osmosis in cells
Water moves into or out of a cell depending on the concentration of the solution surrounding it.
When water moves into an animal cell, the cell increases in volume, stretching the cell membrane. If this continues, the cell membrane will eventually split and the cell will burst. This is called lysis.
Tip
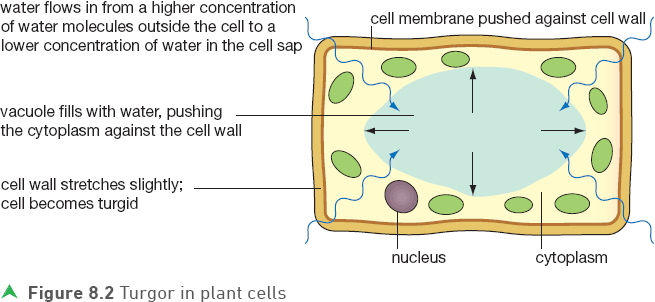
For a plant cell to be turgid the cell must have a more concentrated solution than that surrounding the cell.
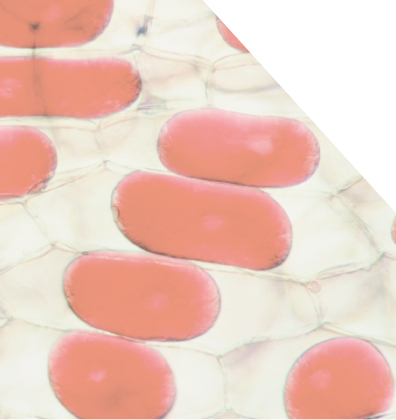
When water enters a plant cell, as shown in Figure 8.2, the vacuole increases in size, pushing the cell membrane against the cell wall. The force of the membrane pushing against the stiff cell wall increases the pressure in the cell, making it firm or turgid. This turgor pressure created by the cell wall prevents too much water from entering and thus stops the cell from bursting, as happens in animal cells. It also gives plant cells support and in non-woody plants this is essential in keeping the plant upright.
The importance of turgor in providing support can be seen when there is a shortage of water. When plant cells do not receive enough water, they cannot remain turgid and wilting occurs. Cells that are not turgid are described as being flaccid.
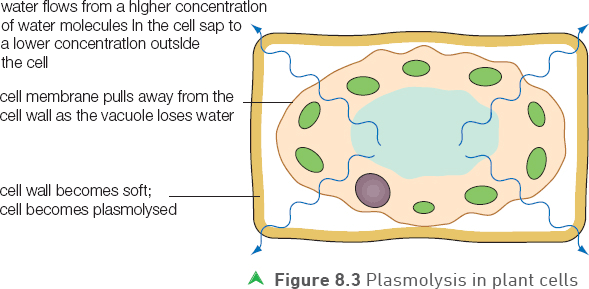
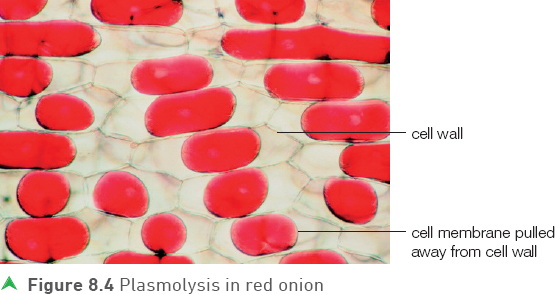
If a plant cell loses too much water by osmosis, a condition called plasmolysis occurs as shown in Figures 8.3 and 8.4. During plasmolysis, so much water leaves the cell that the cell’s contents shrinks, pulling the cell membrane away from the cell wall. Although loss of turgor and wilting is a common occurrence in many plants, plasmolysis is much less likely in healthy plants. This is just as well, as plasmolysed cells are unlikely to survive.
Tip
A cell will only become plasmolysed if the solution surrounding the cell is more concentrated than the cell itself.
You should be able to use a microscope to observe turgid and plasmolysed cells. Revise how to use a microscope in Chapter 1.
Test yourself
1 Define the term osmosis.
2 Explain the difference between osmosis and diffusion.
3 Explain the importance of the plant cell wall in turgor.
Show you can
Explain why it is important that the cells in plant roots have a higher concentration of water molecules than the surrounding soil water.
Prescribed practical
Biology Practical 2.1 Double Award Science B5: Investigate the process of osmosis by measuring the change in length or mass of plant tissue or model cells using Visking tubing
Investigating osmosis by measuring the change in mass of plant tissue in solutions of different concentrations
Tip
Remember to wear eye protection when carrying out this practical.
Procedure
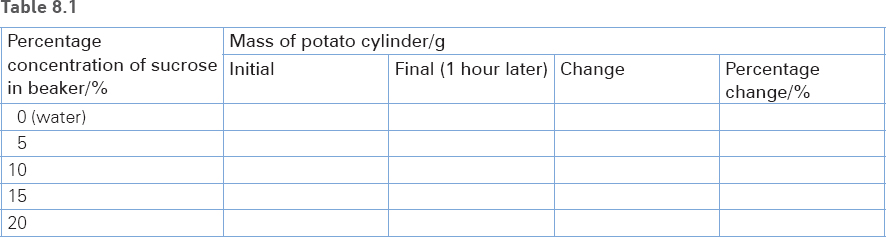
1 You will be given a range of sucrose solutions of different concentrations, such as 5%, 10%, 15% and 20%.
2 Set up and label a number of beakers, each with a different sucrose solution. There should also be a beaker containing water only.
3 Using a cork borer, cut five potato cylinders.
4 Weigh each cylinder of potato and add one cylinder to each beaker.
5 Leave the beakers for at least an hour.
6 Pat dry and reweigh the potato cylinders.
7 Copy and complete the table below with your results.
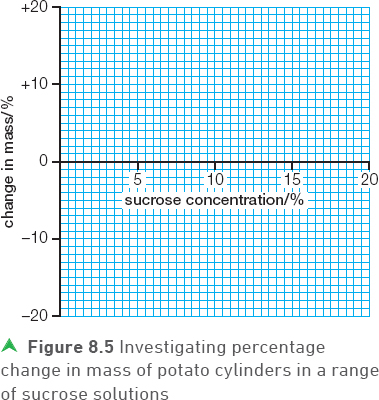
8 Draw a graph of percentage change in mass against concentration of sucrose using axes similar to the outline drawn in Figure 8.5. When drawing this graph you should use a best-fit line (not a point-to-point graph).
9 Describe and explain your results.
In this investigation you need to be able to calculate percentage change. An example of how to do this is shown below.
Example
The mass of a potato cylinder changed from 11.45 g to 9.04 g. Calculate the percentage change.
Answer
![]()
Questions and sample data
1 Explain how you would use your graph to find the concentration of sucrose that has the same concentration as the potato.
2 Suggest why you should use a best-fit line, rather than point to point, in this investigation.
You can complete a similar investigation by measuring the length of the potato cylinders rather than mass.
The table below shows the results of an investigation measuring length of potato cylinders in different concentrations.
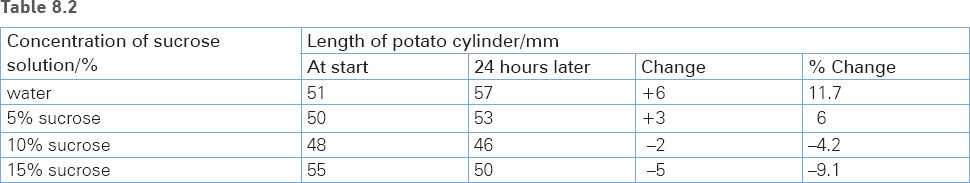
3 Using the data in the table, estimate the concentration of sucrose that could have the same concentration as the potato.
4 Explain why it is important in this investigation to use percentage change rather than just change in length.
5 Suggest two reasons why it is more accurate to use mass rather than length of potato cylinders in this investigation.
Investigating osmosis using Visking tubing
Visking tubing is selectively permeable and can therefore be used to model the movement of substances through the cell membrane.
Procedure
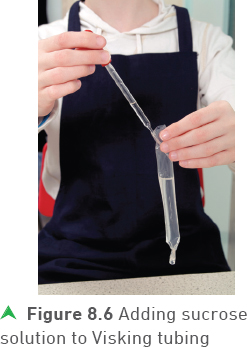
1 Add 5% sucrose solution to a section of Visking tubing, ensuring the tubing is tied securely at each end.
2 Dry the outside of the tubing if necessary and weigh the tubing and contents.
3 Add the Visking tubing to a beaker of water and leave for at least 1 hour.
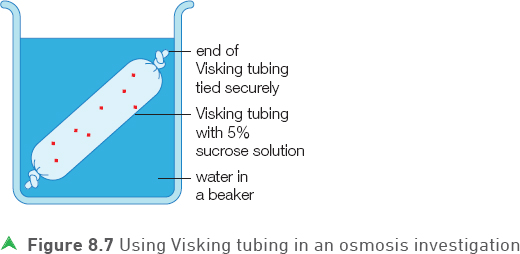
4 Pat dry the outside of the Visking tubing and reweigh.
5 Describe and explain the results obtained.
Tips
• The general principles involving water movement in the three investigations described above are the same: the water will move from a dilute to a more concentrated solution.
• In the investigations with potato, the cell membranes of the potato cells are selectively permeable membranes. In the Visking tubing investigation, the Visking tubing itself is selectively permeable.
Tip
It is very important that the Visking tubing is tied tightly at both ends in this investigation.
Transpiration
Much of the water that enters the leaves of a plant evaporates into the atmosphere. This loss of water by evaporation is called transpiration. Transpiration takes place in the spongy mesophyll cells in plant leaves, through the air spaces and out of the stomata (small pores).
Transpiration is defined as evaporation from mesophyll cells followed by diffusion through air spaces and stomata.
This continuous movement of water through a plant (the transpiration stream) is very important for four reasons:
1 The supply of water to the leaves acts as a raw material for photosynthesis.
2 The movement of water transports minerals through the roots and up the stem to the leaves and other parts of the plant.
3 As water passes through the plant, it enters cells by osmosis to provide support through turgor.
4 Providing water for the process of transpiration itself.
Plants often need to reduce water loss by transpiration. They do this by closing the stomata, which are most common on the underside of leaves. The stomata are necessary to allow gases to enter and leave the leaf, but they can be closed on occasions when it is important to conserve water.
Tip
When covering transpiration it is useful to revise the structure of the leaf; see Chapter 2.
Measuring water uptake using a potometer
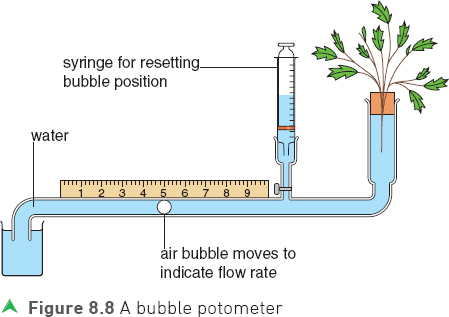
The bubble potometer, (Figure 8.8), is a piece of apparatus designed to measure water uptake in a leafy shoot. As water evaporates from the leaves of the cut shoot, the shoot sucks water up through the potometer. The distance an air bubble moves in a period of time can be used to calculate the rate of water uptake.
The reservoir, or syringe, allows the apparatus to be reset so that replicate results can be recorded or the water uptake can be measured in different environmental conditions. Air leaks will hinder the uptake of water into the plant, so it is important that the potometer apparatus is properly sealed, particularly at the junction between the shoot and the neck of the potometer. To prevent the development of unwanted air bubbles in the water column entering the plant, it is necessary to assemble the apparatus under water initially.
A bubble potometer can be used to measure how environmental conditions such as wind speed, temperature or humidity affect the rate of water uptake. Conditions that increase the rate of evaporation and transpiration, such as higher temperatures or higher wind speed (through using a fan), will increase the rate of water uptake. Higher levels of humidity, created through covering the shoot with a polythene bag, will reduce evaporation and transpiration and therefore slow the rate of water uptake by the shoot.
Obviously, when changing a particular environmental factor (such as wind speed) to show how it affects water uptake, it is necessary to keep other environmental factors constant, including temperature, humidity and light. This ensures that the results are valid. Replicated results will help ensure that the results are reliable.
Leaf surface area, while not an environmental factor, will also affect transpiration rates. Larger leaves will have more stomata, through which water can evaporate and diffuse. You should be able to plan an experiment to investigate the effect of leaf surface area on transpiration rate.
Tip
If you are asked to give three environmental factors that affect transpiration, give wind speed, temperature and humidity. Do not give leaf surface area, as this is not an environmental factor.
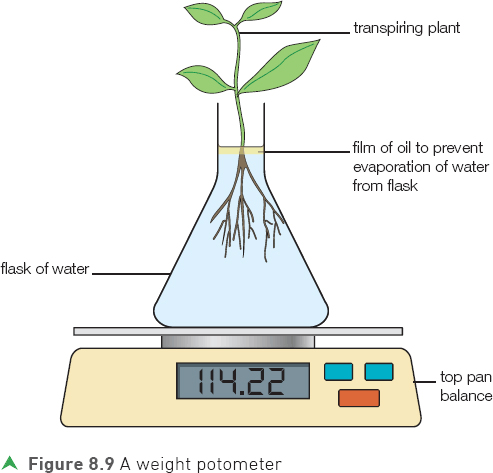
The potometer shown in Figure 8.9, can accurately measure the volume of water taken up by the shoot, but it cannot give an absolute value for transpiration itself. It is impossible to calculate how much of the water taken up by the plant is actually transpired through the leaf surface. Some of the water will be used in photosynthesis and in providing support through turgor, so the volume transpired will inevitably be less than the volume taken into the shoot. However, it is an excellent method for comparing rates in different conditions.
Transpiration rates can also be measured using a weighing method, by weighing how much water a plant loses over a period of time.
Test yourself
4 Define the term transpiration.
5 State three environmental factors that affect transpiration rate.
6 State four reasons why plants need water.
Show you can
Explain why the rate of transpiration in a plant and water uptake are closely linked, but will not be exactly the same.
Prescribed practical
Biology Practical 2.2 Double Award Science B6: Use a potometer (bubble and weight potometer) to investigate the factors affecting the rate of water uptake by a plant and washing line method to investigate the factors affecting the rate of water loss from leaves.
Using the bubble potometer to investigate the factors affecting the rate of water uptake by a plant shoot
Procedure
1 Set up a bubble potometer by attaching a shoot to the neck of the apparatus. Take the precautions to prevent air leaks as described earlier.
2 Calculate the rate of movement of the bubble over a set time for a particular environmental condition, such as still air.
3 Repeat to obtain more reliable results.
4 Adjust the environmental conditions. For example, use a fan to create windy conditions.
5 Repeat steps 2 and 3 above.
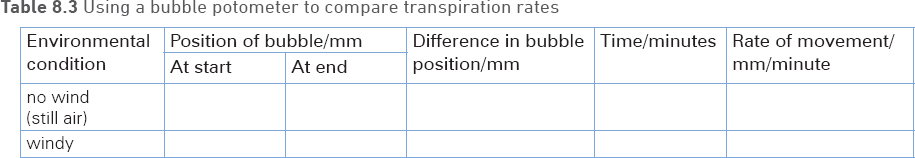
6 Record your results in a table similar to the one below.
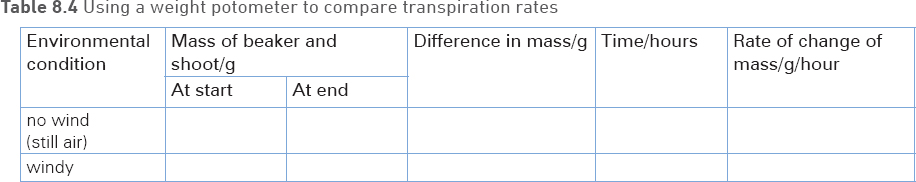
Similar investigations can be carried out using a weight potometer. When using a weight potometer, a table similar to the one below can be used.
Questions and sample data
When comparing transpiration rates in different environmental conditions, it is not always necessary to calculate the ’rate’ of water loss. The table below shows typical results for using a weight potometer to compare water loss (transpiration rate) in two different humidity levels.
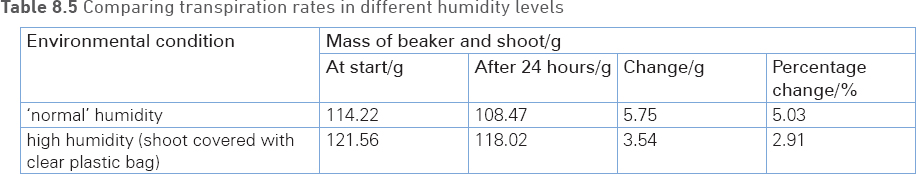
1 Suggest why a top pan balance accurate to two decimal points was used in this investigation.
2 Describe and explain the difference in water loss in the two conditions.
Using the washing line method to investigate the factors affecting the rate of water loss from plant leaves
Procedure
1 Detach six leaves from a tree.
2 Smear petroleum jelly over the cut stalks to make them waterproof.
3 Measure the mass of each leaf and then, using paper clips, hang them on a line of string suspended between two retort stands.
4 Suspend half the leaves on a line of string at a high temperature (such as 30 ºC) and the other half at a lower temperature (such as 20 ºC), in order to compare the effect of temperature on water loss by a leaf.
5 After 24 hours, reweigh the leaves and calculate the average loss of mass for each environmental condition.
6 Describe and explain the results obtained.
Practice questions
1 a) Define the term osmosis.
(1 mark)
b) Explain the role of osmosis in providing support in plants.
(3 marks)
2 Figure 8.10 shows Visking tubing containing 5% sucrose solution surrounded by a solution of 10% sucrose in a beaker.
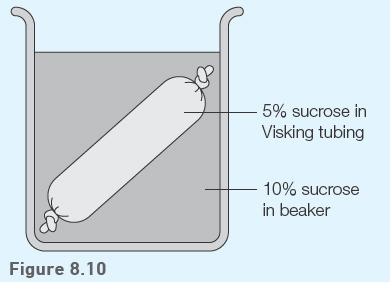
a) Suggest how the appearance of the Visking tubing will change after 24 hours. Explain your answer.
(3 marks)
b) A student carried out a similar investigation, but she found that there was no change in her Visking tubing after 24 hours. Suggest an explanation for this.
(2 marks)
3 A farmer put too much fertiliser onto part of a field. A few days later many of the cells in the roots of his plants had become plasmolysed. Suggest why this occurred.
(2 marks)
4 Some students were asked to investigate whether more water was lost by transpiration through the upper or the lower surface of leaves. They collected 20 leaves and separated them into two groups. They covered the upper surface of the first group and the lower surface of the second group in petroleum jelly. The leaves were weighed on a top pan balance and then attached to a line running between two retort stands with paper clips.
The leaves were reweighed 24 hours later. A summary of the results is recorded in Table 8.6.
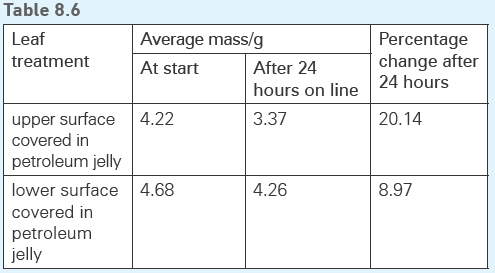
a) Describe and explain the results in the table.
(2 marks)
b) Why were 10 leaves used for each treatment?
(1 mark)
c) State two variables that should have been controlled in this investigation.
(2 marks)
d) State one procedure that is necessary when setting up the investigation to ensure valid results.
(1 mark)
5 a) Briefly describe two ways you would try to avoid air leaks when setting up a bubble potometer.
(2 marks)
b) A student carried out an investigation into the effect of wind speed on transpiration rate using a bubble potometer.
i) Suggest how the wind speed could be changed in this investigation.
(1 mark)
Figure 8.11 shows how the distance the bubble moved in 10 minutes changed with different wind speeds.
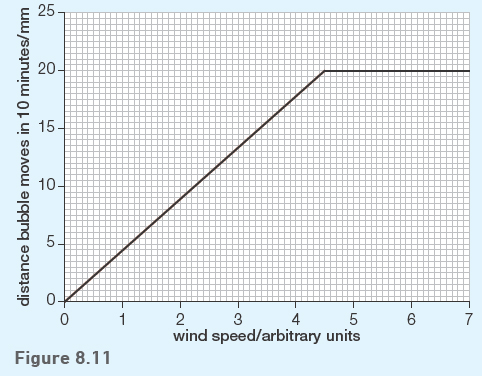
ii) Describe and explain these results.
(4 marks)
iii) State two variables that should have been controlled in this investigation.
(2 marks)
iv) Give one advantage in using a weight potometer, compared with a bubble potometer.
(1 mark)
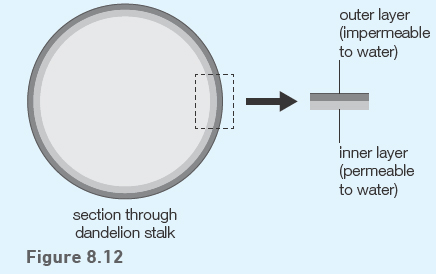
6 Dandelion stalks have two layers: an outer layer that is largely impermeable to water and an inner layer that is permeable to water.
A small section of dandelion stalk was removed, as shown in Figure 8.12, and placed in a beaker of water.
After two hours in the water, the section of stalk had changed, as shown in Figure 8.13.
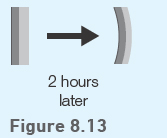
a) Describe and explain the result shown.
(3 marks)
b) Another section of stalk was placed in a weak sugar solution and left for two hours. After two hours, the section of dandelion stalk had not changed shape.
Explain this observation.
(2 marks)