Must Know High School Biology - Kellie Ploeger Cox 2019
PART FOUR Evolution
Microevolution: Evolution of Populations
MUST ![]() KNOW
KNOW
![]() Evolution can be measured as a change in allele frequencies.
Evolution can be measured as a change in allele frequencies.
![]() Hardy-Weinberg provides a “snapshot” in time of allele frequencies, so you can see if allele frequencies are changing over time.
Hardy-Weinberg provides a “snapshot” in time of allele frequencies, so you can see if allele frequencies are changing over time.
Genetic Variation in a Gene Pool
A population is a group of interbreeding species and is the smallest biological unit that is able to evolve. The genetic variation in a population means everyone has slight differences in their phenotype due to slight differences in their genes (genotypes). If one particular phenotype allows that lucky individual to better adapt to their environment, their chances of surviving and reproducing are increased. More reproduction means more babies, which means more chances to pass on their more-fit genes to their offspring. This leads to an increase of that particular allele in the next generation … and that means the population is EVOLVING! Our must know concept is that evolution can be measured as a change in a population’s allele frequencies. An allele frequency means the proportion of one allele compared to all alleles for that trait.
Microevolution refers to the evolution of a single population, as seen by a change in the allele frequencies in that population. The term gene pool refers to all the alleles held by all the members of a population. When studying a gene pool, it helps to focus on a particular locus (meaning one specific gene). Each member of a population has two copies of each gene, right? So, if there were 50 critters in a population, and each has two genes for feather color, then there would be a total of 100 alleles for the feather-color trait in this population. That is the population’s gene pool for the feather-color gene.
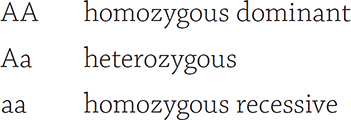
Now, let’s take it one step further. In simple genetic examples, an allele has two options: the dominant allele (which we’ll call A) and a recessive allele (a). When considering the possible genotypes for each individual, there are three options:
Let’s jump into a specific gene pool example. Consider a leafhopper.
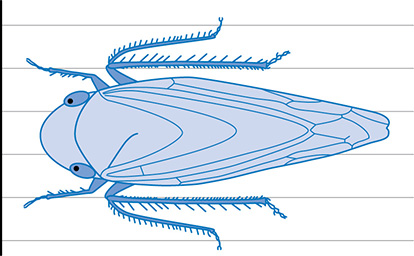
A leaf hopper
This little arthropod specializes in eating plants and avoiding predators, so it has adapted to jump far distances with its tiny bug legs. We will say that the leafhopper has two alleles for leg muscles (yes, leafhoppers have muscles. By definition, all animals have muscles. Well, except for sea jellies … but I digress). The dominant allele is for big muscles (B) and the recessive is for small muscles (b). The population we’re studying consists of ten leafhoppers, and each little arthropod has two genes for leg muscles.
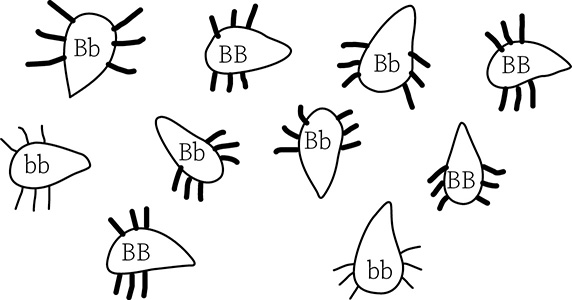
Leafhopper gene pool. B = allele for big leg muscles; b = allele for small leg muscles. Notice the only leafhoppers with small legs are homozygous recessive (bb).
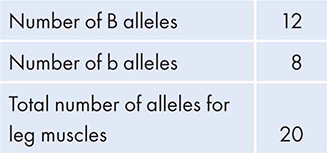
When studying the evolution of a population, it’s helpful to calculate the allele frequencies. To do so, count up all the individual dominant and recessive alleles (remember: each critter holds two alleles):
The frequency of an allele in a gene pool is calculated by:
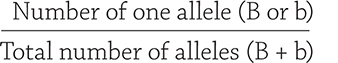
That enables us to determine the frequency of B:
B = 12/20 = 0.60 = 60%
As well as the frequency of b:
b = 8/20 = 0.40 = 40%
This is helpful! Now we have a quantitative measurement and a way to see if the allele frequency changes in this population over time … which is evolution!
The Hardy-Weinberg Equations
It is natural for a population to sometimes be at an equilibrium for a given gene. That means the allele frequencies aren’t changing and everything is fairly stable. If this is the case, the population is said to be at Hardy-Weinberg equilibrium. In order to be at Hardy-Weinberg equilibrium, (and keep those allele frequencies stable), five conditions must be in effect:
1. No mutations!If there were mutations, you would make a new allele and everything would get thrown outta whack.
2. Only random mating allowed.You want all the alleles in the gene pool to be randomly shuffled. No picking and choosing allowed.
3. Large population.When you’re doing any sort of statistical analysis, the bigger the sample size the better!
4. No gene flow.You can’t have new individuals waltzing their way into (or out of) your population, bringing their fancy new alleles with them.
5. No natural selection (aka evolution).Because, well, that would certainly disrupt equilibrium.
This all seems unlikely. How could a population not be evolving? If you only consider a single gene in that population, however, it makes it easier to imagine. The Hardy-Weinberg equations are a super helpful tool in determining if a population is evolving. You can look at one single gene when the population is at equilibrium, and figure out the fraction of alleles that are dominant and the fraction that are recessive. Then, in a couple years, do the same thing again! Any change in the gene pool’s allele frequencies means your population is evolving. It is a must know to realize the Hardy-Weinberg equilibrium provides a “snapshot” of allele frequencies, so you can see if those allele frequencies are changing over time.
Two equations are used when calculating the Hardy-Weinberg equilibrium:
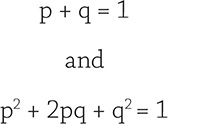
Not bad, right? The “p” stands for the frequency of the dominant allele and the “q” stands for the frequency of the recessive allele. There are only two options available—dominant and recessive—so when you add them up it has to equal 100%:
p + q = 1 (meaning 100%)
The previous equation focuses entirely on the alleles in the population. The second equation focuses on the genotypes of the members of the population. Keep in mind that each individual has two genes for each allele. To understand the equation, consider a cross of two big-muscled leafhoppers, both of which are heterozygous (Bb). Instead of using our letter designations specific to this one gene, use Hardy-Weinberg’s “p” and “q”:
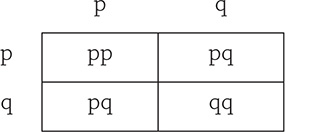
Now the second equation makes sense, because it’s showing you the different kinds of genotypes you can get: homozygous dominant (pp), homozygous recessive (qq), and heterozygous (pq):
p2 + 2pq + q2 = 1 (meaning, as before, 100%)
The 2 before the pq is because if you look at our Punnett square, we generated two different heterozygous genotypes (pq).
EXAMPLE
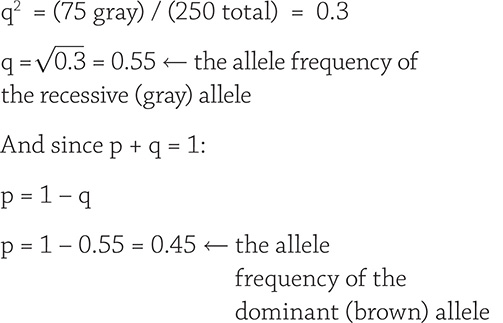
![]() You are studying fur color in a population of proud and majestic wild hamsters. This population is currently in the Hardy-Weinberg equilibrium. The fur allele comes in two forms: brown (dominant) and gray (recessive). In this population of 250 hamsters, 175 are brown and 75 are gray. What are the frequencies of the brown and gray alleles? How many hamsters are heterozygous for fur color?
You are studying fur color in a population of proud and majestic wild hamsters. This population is currently in the Hardy-Weinberg equilibrium. The fur allele comes in two forms: brown (dominant) and gray (recessive). In this population of 250 hamsters, 175 are brown and 75 are gray. What are the frequencies of the brown and gray alleles? How many hamsters are heterozygous for fur color?
![]() When given a Hardy-Weinberg problem, start with the phenotype for which you know the genotype: gray. It’s recessive, so it has to be q2. Always start by finding the frequency of the recessive allele “q.” Once you get that, everything else is cake! The dominant phenotype, on the other hand, could be p2 or pq … and you’re not sure how many individuals are homozygous dominant or how many are heterozygous. Just leave it alone and focus on your recessive numbers:
When given a Hardy-Weinberg problem, start with the phenotype for which you know the genotype: gray. It’s recessive, so it has to be q2. Always start by finding the frequency of the recessive allele “q.” Once you get that, everything else is cake! The dominant phenotype, on the other hand, could be p2 or pq … and you’re not sure how many individuals are homozygous dominant or how many are heterozygous. Just leave it alone and focus on your recessive numbers:
![]()
Just because a gene is recessive doesn’t mean it’s rare. Most (55%) of the alleles in this fictitious hamster population are for the recessive allele, and this often occurs in nature, too.
![]() The question also asked us how many hamsters are heterozygous for brown fur. This is tricky because it’s easy to forget to actually finish the problem:
The question also asked us how many hamsters are heterozygous for brown fur. This is tricky because it’s easy to forget to actually finish the problem:
Heterozygous genotype: 2pq = (2)(0.45)(0.55) = 0.50
![]() As many of my students have found out, it’s tempting to stop at this point (but you would be wrong!). Read the question carefully. It asks how many hamsters are heterozygous. You just calculated the frequency! So, to finish the problem:
As many of my students have found out, it’s tempting to stop at this point (but you would be wrong!). Read the question carefully. It asks how many hamsters are heterozygous. You just calculated the frequency! So, to finish the problem:

How Populations Can Change
As we learned earlier, there is always variation in a population (it would be so boring otherwise). A good way to model variation is by relating the different phenotypes to how many individuals have each phenotype. The perfect type of graph to use is a histogram, where the x-axis shows the different possible variations and the y-axis shows the number of individuals with a given variation. Because traits are selected for by natural selection, the highest number of individuals possess the most-fit phenotype. Flanked on either side are the rarer “extreme” members of the population. There are not as many of these guys because their phenotypes are not as advantageous as the most-fit phenotype. This creates a bell-shaped curve (also called a “normal distribution”) where the majority of individuals have the average measurement:
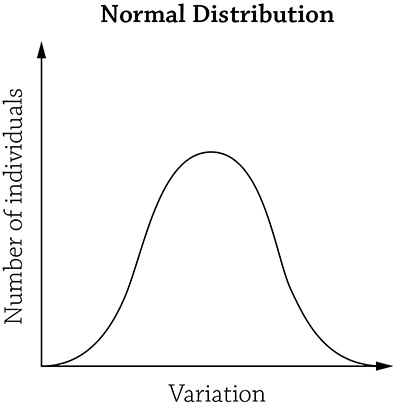
Normal distribution in a population
When conditions change, so does this curve. What if something happened to the environment and one of the extreme phenotypes was now the most-fit phenotype? The individuals with the not-frequently-seen extreme phenotype are now living the happy life of having a selective advantage that results in their increased survival and more successful reproduction. Meanwhile, the majority of the population now are stuck with a phenotype that is no longer so helpful. They don’t survive as well anymore, and they don’t leave as many offspring. This creates a change in the gene pool of the population, and the graph will now shift.
This small-scale evolution within a single population is referred to as microevolution. The differing patterns of microevolution include stabilizing, directional, and disruptive selection. Stabilizing selection does what it says: it stabilizes what you already have by reinforcing the current average most-fit phenotype. Extreme phenotypes continue to be selected against and you maintain the status quo! Robin birds lay an average of four eggs (their clutch size). If their clutch is too big with too many eggs, there may not be enough food to go around and all the chicks will be malnourished. Too small a clutch size and there’s a possibility of no surviving offspring. Stabilizing selection ensures the extreme phenotypes (too many or too few eggs) are selected against.
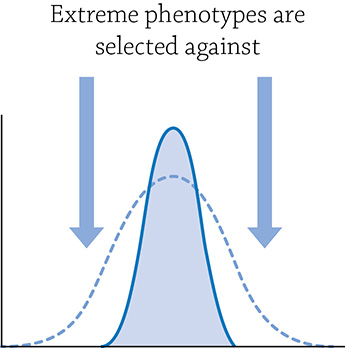
Stabilizing selection
Directional selection occurs when one extreme phenotype is favored over the other, causing a shift toward one end of the spectrum. For example, a new insect-eating predator moves into an ecosystem currently populated with dragonflies with medium-length wings. The new predator easily chases down the small-winged, slower dragonflies, and the faster insects with larger wings are better at evading the new predator. The few insects that were the extreme phenotype are now the most fit, and are better able to survive, reproduce, and pass on their long-winged genes. The next generation (the solid line in the graph) now has a new (longer-winged) most-fit average.
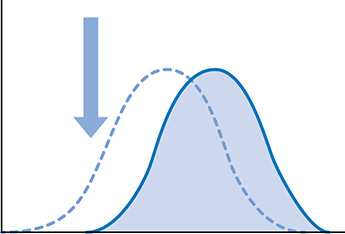
Directional selection
Finally, there’s the chance of disruptive selection (and it’s quite, uh, disruptive to the current population). Imagine a population of flowering plants that produced numerous clusters of flowers on each plant. A new species of bee began to pollinate the flowers, but it preferred plants with fewer flowers (easier to position itself correctly to reach the nectar) or plants with tons of flowers (which were very visible to the flying bees). What used to be the most-numerous phenotype with an average number of flowers is now being passed over by the bees! These plants aren’t being fertilized, and instead, the plants with the extreme phenotypes are getting pollinated and are producing the seeds for the next generation.
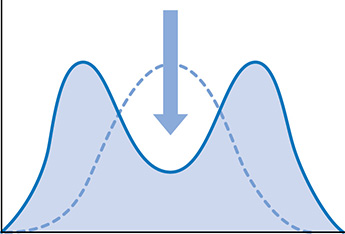
Disruptive selection
Gene flow and genetic drift
It’s logical to assume evolution always occurs because some phenotype is better than another, and natural selection is in the biological driver’s seat. But it’s a bit more interesting than that, because sometimes evolution can occur because of totally random events, and natural selection isn’t involved at all! This is called genetic drift, and any change in allele frequencies is due to chance. In order for genetic drift to occur, the original population size has to be drastically reduced, and the remaining population randomly has a different allele composition compared to the original population. There are two ways in which population size could be decreased enough for genetic drift to happen: bottleneck effect and founder effect.
The bottleneck effect happens when a population is drastically cut, and only a few survivors are left. By random chance, some alleles may be completely lost from the surviving population, or some alleles are now overrepresented. When the population increases again, its gene pool is created from the survivors and the new gene pool can look drastically different from the original. Bottlenecks often cause a loss of genetic diversity.
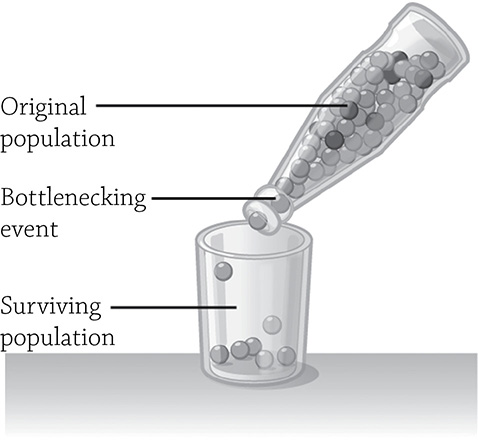
Bottleneck effect
Author: OpenStax, Rice University. https://commons.wikimedia.org/wiki/File:Bottleneck_effect_Figure_19_02_03.jpg
![]()
IRL
The rare Siberian tiger was hunted nearly to extinction in the 1940s, with their lowest numbers dropping to a devastatingly small 40 tigers. That small handful of tigers contained the only alleles left from their original population. Due to decades of conservation and protection, their numbers have since increased to 900. Unfortunately, this new tiger population has very little genetic diversity because of their having undergone the bottleneck effect.
If a handful of members of an original population move away and begin their own population, this is called the founder effect. A loss of genetic variation occurs when any new population is established by a very small number of individuals. If the founding individuals happen to carry rare alleles, then the newly created population will have a higher frequency of those alleles.
![]()
If you are asked for an example of a bottleneck effect, don’t make the mistake of accidently describing natural selection. In natural selection, a large portion of the population dies but those who are more fit survive. The survivors of a bottleneck event have to just randomly survive (and not because of some advantageous trait).
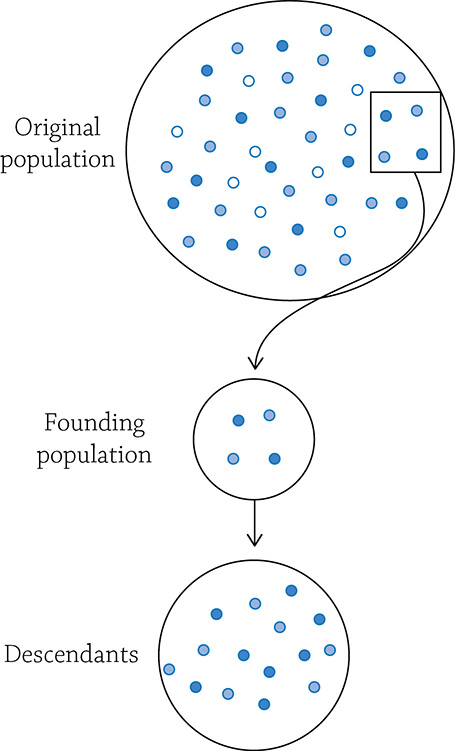
Founder effect
![]()
IRL
Here is an example of the founder effect for fans of books and cats: In the mid-1930s, the author Ernest Hemingway somehow gained possession of a polydactyl six-toed cat that happily lived with the author at his home in Key West. This cat brought in its unusual polydactyl gene and started to create its own cat colony with the native cats. The gene for polydactylism is rare in the general population, but now more than half of the 50 cats who are descendants of that original feline are also polydactyls. That’s a lot of toes.
REVIEW QUESTIONS
1. The Hardy-Weinberg equation is a way to check the allele frequency of a population, but only if the population in question meets five conditions. List them.
2. Within a population of 251 snails, the shell color brown (B) is dominant over the shell color tan (b), and 40% of all snails are tan. Given this information, calculate the following:
a. The number of snails in the population that are heterozygous.
b. The number of homozygous dominant individuals.
3. If a population suddenly suffers a drastic reduction in numbers due to a catastrophic lava flow, the remaining population will eventually repopulate. The reestablished population has very little genetic diversity due to the _________________.
4. A population of stinkbugs range from slightly smelly to extremely smelly, with the majority of bugs with the medium-smelly phenotype. If a predator began to only eat the medium-smelly bugs, explain what kind of selection this describes.
5. Write the Hardy-Weinberg equation that tallies the different alleles for a given gene: _________________. Next, write the equation that summarizes all the given genotypes possible: _________________. Explain what each component of the equation stands for.
6. The ability to taste the chemical phenylthiocarbamide (PTC) is due to a gene that codes for a receptor in the taste buds. The two most common alleles for this gene are the dominant tasting allele (T) and the recessive non-tasting allele (t). You sampled 220 individuals and determined that 150 could detect the bitter taste of PTC and 70 could not. Calculate the frequencies of both alleles in this population.
7. Evolution in a population that occurs because of a chance change in allele frequency is referred to as _________________. For example, a small number of individuals may leave their original population and start their own. If these colonizing individuals happen to carry an assortment of _________________ that are not similar to their original population, their new population will have a different _________________. This is an example of _________________.
8. What type of selection would strengthen the status quo of what is currently the most-fit phenotype?